The Reserve Bank’s challenge tomorrow

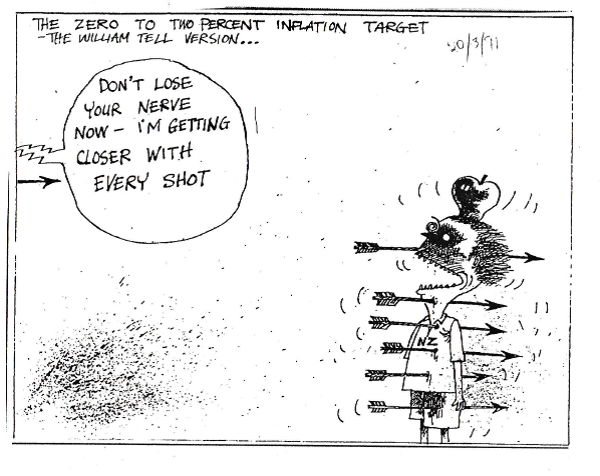
I ran a couple of cartoons from my 1980s and 90s collection a couple of weeks ago.  Many of the ones in my folder were about monetary policy –  the hugely controversial disinflation process we were engaged in, trying to get inflation down to 0 to 2 per cent per annum, and then keep it there.  No one much believed we would manage it (or even be allowed to do so by the political process)  –  there were even cartoons along the lines of “pigs might fly”.  This was one from my collection.

william tell cartoon

These days the challenge is the other way round –  getting inflation back up to (a now higher) target.

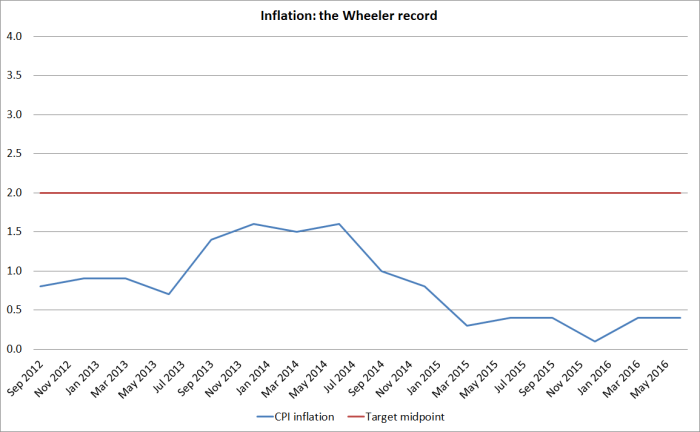
This chart shows inflation over Graeme Wheeler’s term as Governor. It has never got nearer the 2 per cent target midpoint that he and the Minister explicitly inserted into the PTA in 2012.  Most of the time, the annual inflation rate has been below the 1 per cent lower bound of the target range.

wheeler inflation

And so the cartoon struck me as apposite on the eve of the next MPS.  At almost every single OCR review and MPS the Governor has assured us that inflation will soon be getting back to around 2 per cent. Each time, so far at least, he has been wrong.  Forecasts have been revised down repeatedly, and with them the OCR.

Of course, if you look carefully, that cartoon was dated March 1991. By the end of that year, inflation was finally inside the target range.  Indeed, most studies looking at New Zealand’s experience of low inflation start from around then.

Perhaps we will be surprised, and after all the surprises and failures  so far inflation really will be back to around 2 per cent before too long.    The right monetary policy judgements are a part of making that prospect real.

A submission to the Reserve Bank’s faux consultation

A bit under three weeks ago the Reserve Bank announced a proposal for a further, substantial, extension of its LVR controls on banks’ mortgage lending  It is formally a proposal, subject to a consultative process, but it is all done in such a mad rush that it is difficult for anyone to take the “consultation” process seriously.  Late last year, the Bank announced that it would be allowing substantial consultative periods, and on this occasion they have offered no argument or evidence for why it is so urgent that such a short time is allowed for consultation and the preparation of submissions.  Presumably it is just the impatience –  backed by very little analysis – of the Governor –  much the same impatience that means this is now the third attempt in three years to get LVR controls “right”.  What was worse was the instruction to banks to simply fall into line now.  We live in a country supposedly governed by the rule of law, not the whims of men.  And until the proper consultative process has been completed, and the Governor has had regard to all the submissions, what he is proposing (a) is not law, and (b) cannot be counted on as ever being so.  But just to write that is to explain why it is hard to take the consultative process seriously.

I have  written and lodged a submission.  It was a fairly rushed job, but I’m out of commission for the next couple of days and needed to get it in this evening.

Submission to RBNZ consultation on further extension of LVR limits Aug 2016

This is the heart of the conclusion of my submission

In substance, the proposal if adopted will further undermine the efficiency of the financial system, while doing little or nothing to reduce any threats to financial stability (risks which, on your own stress tests are already very low). Indeed, there is a risk that such direct controls could increase, albeit modestly, the risk of serious financial system stresses because it will reduce the volume of capital held against bank mortgage books.    Over time, the growing use of direct controls risks progressively undermining the willingness and ability of banks to do their credit risk assessments, and to compete with each other in doing so,  rewarding going along with the Bank’s assessment of risks, while gaming the rules at the margin wherever possible. 

Since the Bank offers us no reason to think that its own assessment of credit risks –  in the aggregate or at a more disaggregated level –  is superior to that of the market, and since our banks actually came through a much larger housing and credit boom largely unscathed, there is little basis for us to prefer the Bank’s judgement.  And it has offered nothing to suggest how much its planned intervention might affect the probability or severity of any crisis. 

Over-reliance on a very slender base of international evidence, and a failure to think hard about the distinctiveness of New Zealand (from, say, the Irish or US experience) or to make the attempt to gather and analyse New Zealand loss experiences should give citizens little reason to have any confidence in what the Bank is proposing,   Even if investor loans were to prove slightly riskier, all else equal, than owner-occupier loans, the scale of the differentiation in the rules for the two types of lending suggests the Bank is driven at least as much by tilting the playing field against investors and in favour of first-home buyers as by its statutory responsibilities to use its powers in the interests of financial system soundness and efficiency.  If so –  and I hope there is nothing to that suspicion –  it would have involved the Bank stepping well beyond its responsibilities (with little ability for citizens to hold it to account if it did so).

There isn’t much to like in the consultative document.  The empirical evidence they now rely on is two studies undertaken by a central bank (the Irish one) which had already decided to have a regulatory distinction between investor loans and owner-occupier loans.  One of those studies is claimed to examine the UK experience –  in fact, it looks as the loan books in the UK of the three (failed) Irish banks, not necessarily a representative sample of UK experience.  I’m open to the possibility that investor loans are slightly riskier than owner-occupier ones, but have simply not yet been presented with any compelling evidence.  And the Bank has still made no effort to look at the experience in New Zealand, where the post-2008 reductions in house prices in some regions were not dissimilar to the UK experience, where unemployment rates lingered high, and where in some cities nominal house prices stayed well below previous peaks for a prolonged period. Obviously, New Zealand data reflecting New Zealand banking practice, New Zealand law, and New Zealand cultural norms would be more persuasive than the experience of the Irish banks (and even those research papers have some real problems).

The proposed controls differentiate between investor loans and owner-occupier ones to a huge extent.  Implicit in these proposed new rules is the view that loans to an owner-occupier with an 80 per cent LVR are less risky – not just as risky –  as loans to investors with a 60 per cent LVR.   Nothing in the data they’ve presented warrants that sort of differentiation, and it looks like a bit of covert redistributive policy: regardless of the riskiness of the respective loans, make things harder for investors and help out the first home buyers (even though those young buyers might be getting in right near a peak).  That simply isn’t the Bank’s job.  It is charged with financial system soundness and efficiency: it pays lip service at best to the efficiency issues (and the way its controls will progressively undermine competitive credit allocation decisions) and its own stress tests say that the financial stability risks are slight.  And why should regulatory policy be prohibiting a young person in, say, Wanganui getting into the rental property market with an LVR above 60 per cent.  Direct controls lead to arbitrary boundaries, absurd outcomes, and/or ever-increasing regulatory complexity.  That was part of the reason why we deregulated markets, and relied more extensively on indirect instruments, in the 1980s. it remains a good model –  and served New Zealand well through the boom and bust of the last decade, when our banks came through largely unscathed.

A key feature missing from the consultative document is any recognition that to the extent that the controls reduce high LVR lending, they will also reduce the amount of capital banks need to hold against their mortgage books. The Bank argues that the proposals will reduce the risk of financial crisis, but they show no sign of having thought much about the implications of the reduction in required capital.  If the capital requirements for high LVR loans were too low in the first place, that might be one thing. But our risk weights on housing loans are among the highest anywhere, and the Bank went through a consultative process not that long ago to increase those risk weights on high LVR lending.  And as part of what the controls will do is push a pile of lending to just below the respective ceilings –  there will be a lot of 59.9 per cent investor loans , even though a 59.9 per cent loan is little less risky than, say, a 60.1 per cent loan.  Capital requirements are likely to fall further as a result, even if the underlying risks haven’t changed much.   It would be unfortunate if measures ostensibly designed to reduce financial system risk actually modestly increased those risks, by reducing the capital buffers banks have to hold.

I don’t suppose submissions will make any difference to the Bank, but time (not much time, if they plan to have the restrictions in effect from 1 September) will tell.

Readers will recall that a couple of weeks ago the ANZ’s local head, David Hisco, called for the controls to be much more constraining than what the Bank is proposing. As I noted, there was nothing to stop ANZ restraining its lending accordingly.  But I do hope the ANZ will now pro-actively release its submission to the consultation so that we can see if Hisco’s submission on regulatory policy aligned at all with the rhetoric in his newspaper article.

I have lodged an Official Information Act request for all the submissions the Bank receives.  If past practice prevails they will eventually release those of entities other than banks, while claiming that the Reserve Bank Act prohibits the release of the bank submissions. I discussed this curious interpretation of section 105 of the Act the other day.  It cries out for a short amendment to the Reserve Bank Act to make it clear that all submissions on new regulatory proposals of this sort are covered by the Official Information Act.  That, of course, would be just a start on the sort of extensive reforms of the governance of the Reserve Bank that are needed.


Perhaps 20 more terms in office will be enough?

The ever-ebullient Minister of Economic Development (and a great deal else beside) Steven Joyce was interviewed on TVNZ’s Q&A programme yesterday, defending the government’s economic record.  Despite the efforts of the interviewer to pin him down –  including on the rising degree of unease even among some of those one might think of as “elites” about immigration policy –  Joyce put up a pretty forceful defence, often citing the Prime Minister’s mantra that if New Zealand has challenges they are ‘quality problems” or “side-effects of success”.  If one didn’t have access to the facts, it might even have sounded persuasive.

I was tempted to devote a lengthy post to the Minister’s claims, but I have other stuff I really have to finish today.  So apart from noting in passing New Zealand’s continuing lousy productivity performance (see the chart in this post), I wanted to focus on just two of the areas the Minister covered.

The first was around the skills of immigrants.  In June the OECD released the results of a fascinating multi-country study of the skills level of workers.  It suggested that the skill levels of New Zealand workers –  over several dimensions – were pretty high.  I wrote about it at the time, and summarized the high-level findings this way

Looking across the three measures, by my reckoning only Finland, Japan, and perhaps Sweden do better than New Zealand.    Perhaps there is something very wrong with the way the survey is done, and it is badly mis-measuring things, but those aren’t usually the OECD’s vices.  For the time being, I think we can take it as reasonably solid data.

As I also noted, the survey also looked at the skill levels of non-native born workers.  In almost every country, including New Zealand, the skill levels of immigrants were below that of natives.  Of course, in every country there will be many very able immigrants, but these are averages across the full samples of native born workers and immigrants.  As I pointed out, if your country (New Zealand) already had among the very highest skill levels in the world, and immigrants had less good skills, it didn’t lend much support to the idea that we needed lots and lots of immigration to lift the productivity of New Zealand workers, and make up for deficient skill levels at home.

But none of that stopped Steven Joyce introducing this same report in support of the government’s immigration policy.  How did he manage that?  Well, he correctly pointed out that New Zealand’s immigration policy is more skills-focused than those of most countries.  Unlike most countries, we have almost complete control over who we let in –  there isn’t a material illegal immigration problem –  and unlike, say, the United States (where legal immigration is mostly family-focused) we have an explicit economic/skills focus.  We may not do it well –  my argument –  but we are less bad, on that score, than most.

One might reasonably expect literacy skills of immigrant workers to lag behind those of natives –  after all, for many/most English isn’t their native language.  But the OECD survey also reports results for “problem solving proficiency in a technology-rich environment” (Figure 3.15 of the OECD report).  There are 28 countries/regions in the OECD study, but there is only data on the skill levels of immigrant workers for 17 of them (many of the other simply don’t have much immigration).

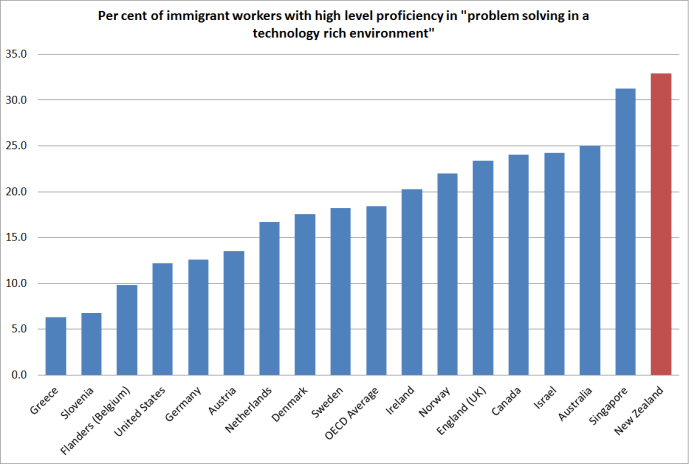
Here is the proportion of foreign-born workers with what the OECD calls relatively high level skills in this (problem-solving) area.

skills technology

New Zealand scores well here.  Our (really large scale) immigration programme seems to have done better in attracting people with these sorts of skills (and keeping out others) than most other countries have.

But remember that our overall workforce –  mostly native-born –  also has among the very highest level of skills of any of these countries. On this particular measure, we were top equal with Sweden.

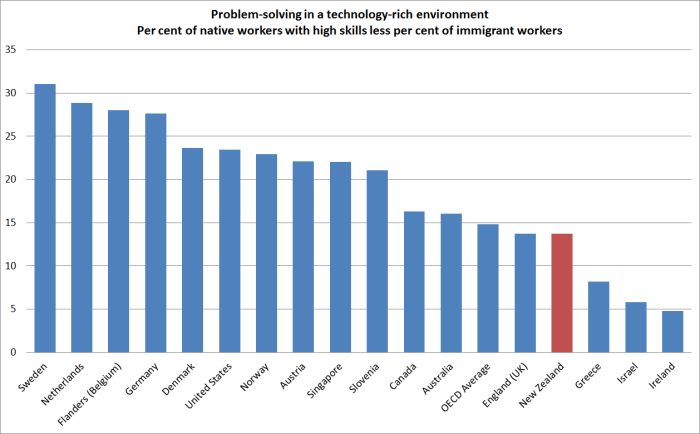
So here is the gap between the skill level of natives and the skill levels of immigrants (again, on this problem solving proficiency measure).

skills gap

New Zealand doesn’t do too badly –  although Israel and Ireland stand out as clearly better –  but in every single one of these countries the skill levels of the average immigrant worker are less than those of the average native worker.  And this in an area –  the use of technology –  where the Minister often likes to stress the importance of immigration.  We don’t have the problems of Sweden or the Netherlands, but these OECD data –  which the Minister himself quoted in support of his policy –  just do not support the claim that our immigration programmes have been boosting overall skill levels in New Zealand.  If anything, those programmes have been a net drag.  As I’ve repeated many times, I’m not suggesting immigration never could boost skill levels –  or that there are not many highly-skilled individual immigrants (as there are many highly skilled natives) –  but our skills-focused programme, on the scale the government continues to stick to, just isn’t achieving that goal.  Perhaps with annual target of 10000 to 15000 non-citizen migrants (per capita, the same sort of rate as the US has) we might do so.

The interviewer also attempted to push the Minister onto the back foot over the government’s target for the share of exports in GDP.  The goal, announced several years ago, was to lift exports as a share of GDP from around 30 per cent to around 40 per cent by 2025.  I thought the formal target was daft and dangerous, even while sympathizing with the intuition that motivated it – small countries get and stay successful by selling lots of stuff, competitively, in the rest of the world.

As the Minister fairly noted, the base level of exports got revised in one of SNZ’s long-term national accounts revisions.  But that does not change the fact that exports as a share of GDP have been going nowhere.  It is all very well to blame low dairy prices –  as Mr Joyce sought to –  but on other occasions he’d be telling us just how well tourism and export education sectors were doing right now.

Here is chart of exports to GDP, going back to the start of the quarterly national accounts data in 1987. This time, I’ve also shown the average export share for each of the last three governments.

exports to gdp by govt

Plenty of things cause fluctuations in the series, and not many of them are under the direct control of governments.  Nonetheless, the average export share of GDP is materially lower under this government than it was under the previous government, and the latest observations are below even that average. Since the start of 2009, exports have averaged 27.7 per cent of GDP.  Under the previous National government –  one that first took office more than 25 years ago, that average was 27.5 per cent.  The government’s goal was to lift the export share by 10 full percentage points, and there is now only nine years left until the target date.  On performance to date –  and policy to date – we might be waiting several more centuries to achieve that sort of goal.

It is time Mr Joyce and his colleagues faced the fact that they are simply failing on this count.  A rather different approach is needed –  one which permits/facilitates a sustainably lower real exchange rate, orienting the economy more strongly towards investment in the tradables sector, and enabling more able firms to grow (and locate here doing so) by successfully selling to the rest of the world.  As I’ve noted before, per capita output in that vital outward-oriented part of the economy hasn’t increased at all for 15 years now.  It seems unlikely that that sort of reorientation will occur, all else equal, while we continue to bring in, as a matter of policy, so many not-overly-highly-skilled non-citizen migrants each year.

And finally, the interviewer introduced my name to the discussion as one of those skeptical of some of the government’s claims.  Mr Joyce suggested that I was among those who had predicted a large balance of payments blowout, thus apparently undermining the credibility of my arguments.  Of course, economists are pretty hopeless forecasters, so when an economist offers a prediction about the future one should (a) always take it with a considerable pinch of salt, and (b) wonder if the economist recognizes his/her own unwarranted over-confidence.  But in this particular case, I didn’t even recognize the forecast.  Since I’ve spent the last four years –  both inside and outside the Reserve Bank –  arguing against interest rate increases and for interest rate cuts, it would be surprising if I had been worrying about the current account deficit blowing out.  Demand has been consistently weaker than it should have been –  inflation has been below target, and unemployment has lingered above the NAIRU.  Whatever I’ve warned about, I’m pretty sure it hasn’t been the current account of the balance of payments.

(UPDATE: And, as a reader notes, as banks’ dairy losses mount there will be an almost one-for-one temporary reduction in (mostly foreign-owned) banks’ profits, and thus in the current account deficit.   That won’t be a sign  of economic success either.)

Government consumption

Playing around in the consumption data yesterday prompted me to have a look at what had been happening with government consumption spending.  Government consumption, in the national accounts, isn’t the same as total government operating spending.  The latter includes transfers –  the huge amounts modern governments spend on direct payments to households, through the welfare and social insurance systems etc.  Government consumption parallels private consumption –  it is the stuff governments and their agencies (central and local) purchase directly (excluding capital spending, which is investment).    That includes stuff directly consumed by households but paid for by governments –  think of lots of health and education spending –  as well as stuff “consumed” collectively, or in some sense by governments themselves.  The cost of The Treasury, MFAT, the courts, or defence spending are examples of the latter.

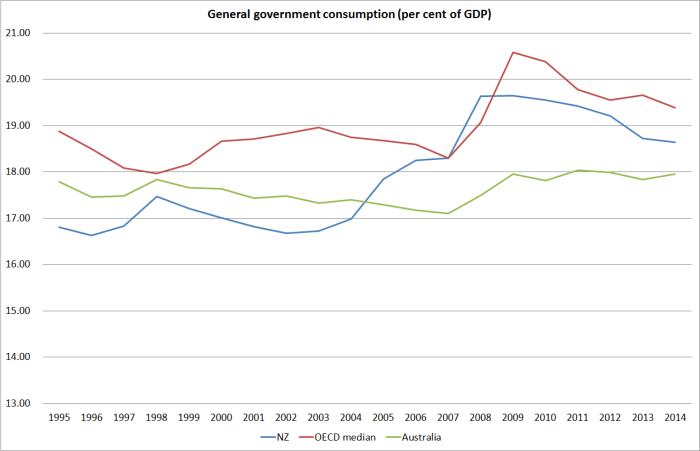
Take total government consumption spending first.  The OECD has data for all its member countries since 1995, so I’ve focused on that period.  Here is how New Zealand and Australia have done relative to the median OECD country over that period.

gen govt C aus nz

It is sobering to observe (a) how stable the government consumption share has been in Australia, and (b) how much government consumption as a share of GDP has increased since 1995.  We were consistently a bit below Australia, and in recent years we’ve been a bit above.  Australia may have more pressing fiscal problems right now than New Zealand does, but government consumption has been better held in check there than here.  That increase in government consumption spending will have contributed to the upward pressure on the real exchange rate (tending to raise non-tradables prices relative to tradables prices).

And here is the chart for all OECD countries, showing both the 2014 numbers and the average for the full period 1995 to 2014.

gen govt C oecd

A few things struck me.  There is, of course, a huge range across quite similarly successful countries –  Switzerland and the United States at one end, and the Netherlands, Sweden and Denmark at the other.  The same pattern shows up when one looks at total government spending.  But what struck me more forcefully this time was that while there was little change in the government consumption share of GDP among the countries in the middle of the chart –  say those from Australia to Canada – most of the countries with very high government consumption spending had been increasing that share further over the last 20 year (all seven of the countries furthest to the right).  And at the same time, the countries with the lowest government consumption shares had also been increasing that share (five of the seven countries furthest to the left).   Only a handful of countries had government consumption shares of GDP lower at the end of the period than the full period average –  and there wasn’t anything very obvious in common among those countries (eg Israel, Hungary, Portugal and Latvia).

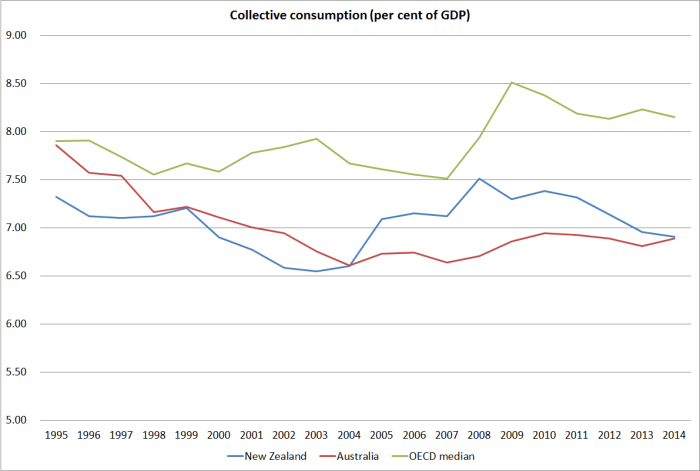
As I noted earlier, total government consumption spending includes stuff individual households consume directly but the government pays for, as well as the more traditional stuff of government (policy advice, defence, law and order etc).  The latter is known by the national accountants as “collective consumption”.  Here are the same two charts as above, but this time just for collective consumption.

The New Zealand/Australia comparisons

collective C nz and aus

Trends here look quite a lot more favourable for New Zealand (and Australia even more so).  No doubt it helps how little we spend on defence, but I think it is generally accepted that – even if there are whole agencies that could be closed with no real loss – that the New Zealand core public sector is fairly lean.

And the OECD as a whole.

collective C oecd

Note that the countries at the right of this chart are quite different from those at the right of the total government consumption chart above.  The Nordic countries are actually towards the left of the chart –  Sweden, Denmark and Norway don’t spend much more running their governments than we or Australia do.  The big differences are in the individual consumption the government pays for   – be it childcare, health or education.  The countries to the right of this chart look a lot more like those which tend to spend a lot on defence –  those that really need to (Israel, and increasingly perhaps the Baltics,  as well as Greece and Turkey with their historic rivalries and suspicions).   It is interesting then how far to the left Korea is –  perhaps offset in part by US defence spending and security pledges?

There aren’t any very obvious patterns in the changes between the 1995 to 2014 average and the current level.  Overall, the OECD median has increased a little (as the earlier chart showed), but the increases don’t seem to be concentrated in low-spending countries, or high-spending countries, or countries that are militarily exposed, or countries that had strong fiscal positions.  And I can’t see such patterns for the countries that have been shrinking collective consumption either.

Reasonable people can differ on the appropriate role for government in income support, or provision of health and education, but this is collective consumption.  I’d be keen to learn a little more about how Switzerland manages to run such a successful and well-functioning country with collective consumption of only around 5 per cent of GDP.

Perhaps there is an example after all

I’m pretty pessimistic about the prospects of sorting out the housing supply/land use regulatory mess that, in conjunction with population pressures, has given us –  Auckland in particular –  extremely high house prices (and price to income ratios).  There are no great technical barriers to getting the market working again, with housing as affordable as it used to be.  But I have repeatedly noted here that I’m not aware of any country/region/locality that had once got into such a mess and had found its way back again, unwinding the morass of regulation (tell me again how many pages there are in the draft Unitary Plan).  Each time I make the point, I really hope someone is going to tell me about a compelling counter-example, demonstrating that what it technically possible has also proved politically feasible.

But reading Tyler Cowen’s Marginal Revolution blog just now I found a really encouraging piece headed Laissez-faire in Toyko Land , which in turn draws on a fascinating Financial Times article Why Tokyo is the land of rising home construction but not prices .  I hadn’t paid much attention to Japanese house prices, implicitly ascribing the lack of house price inflation to (a) the aftermath of the 1980s boom, and (b) the flat and now falling population.    But here is the key chart in the FT article

tokyo

Over the last 20 years, Tokyo itself has had about the same rate of population increase as London.  A nice locality apparently relatively near the centre has had faster population growth than San Francisco.  And yet look at the differences in the rates of house price increases.   Sure, the chart flatters Japan because Japan has had general consumer price deflation, while the US and the UK have had general inflation –  but even in real terms, the differences would be large.

Anyway, I’d encourage people to read the blog piece and the underlying article itself.  It isn’t a totally laissez-faire story, but the flexibility that seems to have been introduced to the system following the 1980s boom looks impressive.  I’m not expert – no doubt there are other perspectives on the Tokyo experience –  and perhaps the changes that were put through in Japan could never be done in Anglo countries.  But they were done in Japan. That in itself is encouraging.

UPDATE: I had been continuing to mull this FT material.  It focuses on the change in prices over the last 20 years as a whole, and not at all on the levels.  This 2014 link from one of the FT blogs confirms that the bulk of the 1980s boom in Tokyo prices had been reversed by 1995.  However, it also includes a chart showing price to income ratios for new Tokyo apartments (in the greater Tokyo area) which –  while pretty stable over the last 20 years –  still seem strikingly high, especially once one takes account of the “famously diminutive” size of Tokyo apartments.

And here is an interesting post with a more extensive discussion of Japanese zoning procedures and rules.

Are we just pulling consumption forward?

I was having a discussion with someone the other day about interest rates, the OCR, and how we should think about what has been going on in recent years.  The person I was talking to was worried that, whatever short-term support lower interest rates might be providing to demand, activity and employment, it was at the expense of simply pulling forward consumption.  And (lifetime) income which is spent today can’t be spent again tomorrow.

My usual starting point in such discussions is to draw attention to the little-recognized fact that consumption as a share of GDP has been largely flat in New Zealand for decades.  There is some cyclical variability –  consumption is a bit more stable than income, so the ratio tends to rise in recessions, and falls back as the economy recovers –  but the trend has been almost dead flat.  Actually, GDP isn’t the best denominator, because GDP measures what is produced here, not what accrues to New Zealanders (the difference is mostly the income earned by foreigners on the relatively large negative NIIP position New Zealand has). GNI is a measure of the aggregate incomes of New Zealanders, and here I’ve shown the various components of consumption relative to GNI since 1987, when quarterly national accounts data are available from (but using four-quarter running totals)

First, private consumption (including non-profits)

pte consumption to gni

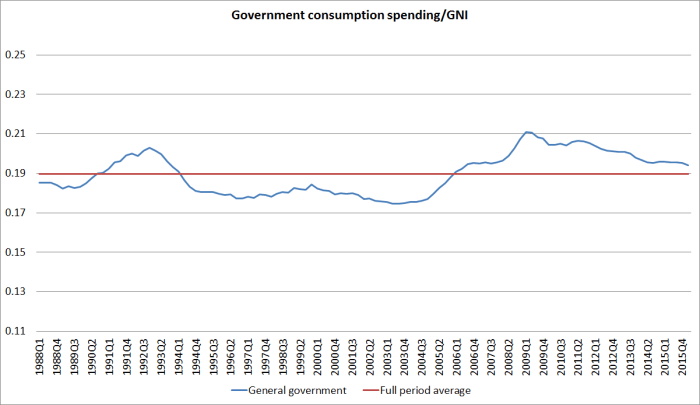
And then general government consumption

govt consumption to gni

And then total consumption

total consumption to GNI

I’ve shown full period averages for each.  The only component of consumption where the share of GNI is a bit above the long-term average is general government consumption, the bit that is least likely to be sensitive to changes in interest rates.

Of course, if interest rates had been kept arbitrarily higher then consumption as a share of GNI might well be weaker now than it actually is, but there is really isn’t any sign of a great consumption splurge –  a society desperately (over)spending now and thus increasingly likely to come a cropper later.    (And as I’ve noted previously there is also nothing in any of these charts to suggest some large average wealth effect from the sharp rise in real house prices in recent decades –  not surprisingly, since wealth is being transferred among New Zealanders, but no additional real wealth –  future purchasing power –  has been created in aggregate).

As we continued our discussion, the person I was talking to reminded me that the US picture has been somewhat different.

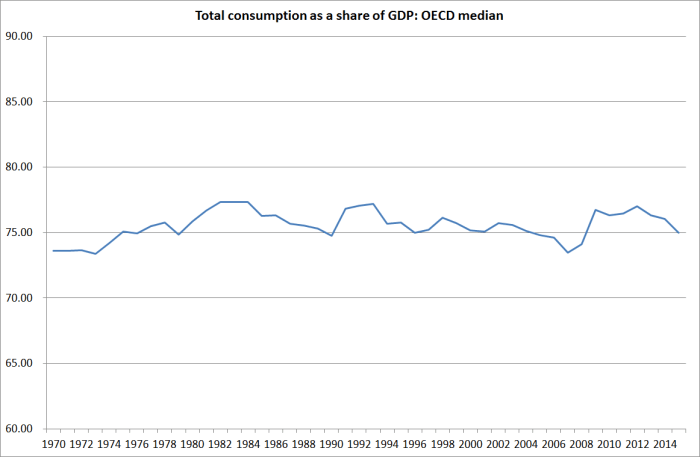
Here I draw on the OECD database, which has annual data for most of its members back to 1970. Here is total consumption (public + private) as a share of GDP for the United States, United Kingdom and New Zealand.

consumption us uk and nz

Even over the full 45 year period there is no upward trend in the consumption share in New Zealand.

And here, on the same scale, is the consumption share of GDP for the median OECD country.

oecd median consumption

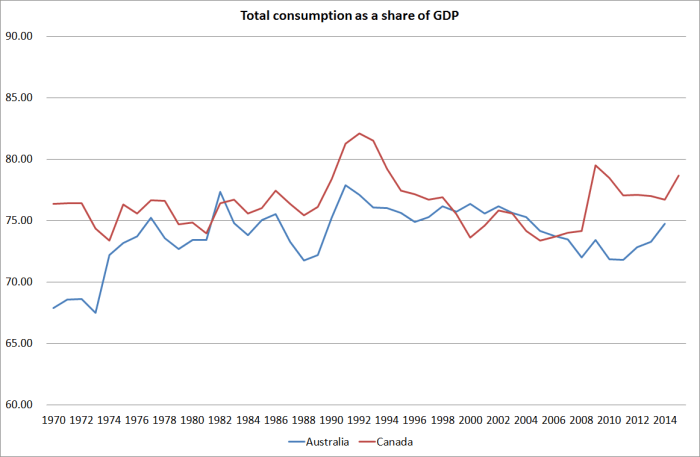
And here are Australia and Canada

consumption aus and canada

Like New Zealand, no trend in either country, at least (see Australia) since the mid 1970s.

And here is Actual Individual Consumption (private consumption plus the stuff the government purchases but individuals consume directly eg healthcare and education) as a per cent of GDP for New Zealand, Australia and Canada.

aic consumption

I’m not quite sure what was happening to this data in New Zealand around 1985, but again for the last thirty years there has been no upward trend in consumption as a share of income.

What does all this mean?  To be honest, I’m not quite sure.  After all, if population growth rates have been slowing, less of GDP needs to be devoted to investment and that might mean more is available for consumption.  But in the UK in particular, population growth rates have been somewhat faster in the last couple of decades than they had been previously.    And things like defence spending trends can also complicate the picture –  weapons system purchases are now part of investment, and we know in the US (and the UK) defence spending as a share of GDP is much lower than it was some decades ago.

I guess all I take from it is my original point. At least in New Zealand –  and in most of the OECD –  there is no sign that lower interest rates are resulting in a large scale bringing forward of consumption, for which at some point there must be payback.  But that shouldn’t be too surprising.  After all, interest rates are as low as they are for a good –  if ill-understood by anyone –  reason: in summary, because if they weren’t this low, consumption and investment spending would be even weaker.  That, in a market economy, is really all interest rates do: they balance desired savings and investment patterns.  Central banks that are too slow to adjust to changes in desired savings or investment patterns –  at any given interest rate –  can slow the adjustment, but in that respect a good central bank shouldn’t be trying to stand in the way of the sorts of real adjustments the private sector has underway,  A century or more ago Wicksell introduced the concept of a neutral or natural interest rate.  Those rates change over time, for reasons that aren’t always easy to recognize.  Markets don’t need a fully convincing analytical reason –  they just reflect the changing balance of demand and supply.  Central banks shouldn’t let the difficulty of finding a good explanation stand in the way of allowing what would be the market processes to work

But quite why consumption shares in the US and UK have risen so much is an interesting question –  to which I don’t have any good answers right now.


Wellington Airport: a factual high level summary

This morning’s Dominion-Post features a full page advert, notionally inviting people to make submissions on the resource consent application to extend the runway at Wellington Airport.

In fact, the advert is mainly an opportunity to tout the case for the hugely-expensive proposed extension –  in what must be one of the most expensive locations in the world in which one could add 300 metres to a runway (and still not comfortably meet international safety guidelines).  The pretty graphic highlights 20 Pacific Rim cities which planes could reach from Wellington –  without ever mentioning that the most likely outcome, if the project succeeds at all, is flights once or twice a week to one or two of them.

All one really needs to know about the proposal is that the owners of the airport think the project is sufficiently unattractive that there is no way they would proceed with the extension if it involved investing their own money.

The owners –  WIAL, majority-owned by Infratil – have been quite clear that the project will only proceed, even if it gets resource consent, if there is a massive public subsidy –  huge contributions from some combination of local, regional, and central government that would not be reflected in a commensurate ownership interest in the airport.  But there is no mention, at all, of this fact.

In a little note at the bottom of the advert  it is described as a “high level factual summary of some of key effects from the extension”.   I did spot the odd fact in the advert, but mostly it was boosterish opinions, clothed in consultants’ reports – and  all summarized in the huge alleged national benefit estimates.  I’m deeply unconvinced by the economic case for this airport runway extension –  the benefits appear to be overstated, and the discount rate used to evaluate them seems too low – but would have no real objection if private shareholders were paying for it.  But they aren’t.

I wrote a few posts about this proposal late last year, here, here, and here. Ian Harrison, at Tailrisk, has a nice piece here on the same issue.

I’m not making a submission.  As a matter of principle, I don’t think the Resource Management Act should be used to block business developments, unless there are compelling environmental grounds –  and I have no expertise in environmental issues, and am interested only to the extent Lyall Bay remains a pleasant spot for the family to swim.

The real debate should be around decisions new local and regional councilors consider making about injecting public subsidies to this operation (over and above what has already been spent). The quality of public sector investment spending is typically quite poor, and around the country airport investments (see eg Rotorua) are no exception.   As the local body elections are just weeks away, the focus needs to be on the attitude towards the project that each candidate takes.  So much money is involved, and attitudes to this project seem to reveal so much about candidates’ views on the role of local and regional government, that for me it will be a defining issue.  I will be seeking out candidates who are clearly opposed to spending public money on the extension.  In the huge field of mayoral candidates there appear to be a couple of options –  but their fine print needs checking out.  I haven’t yet done my research on the council and regional council candidates.  I encourage greater Wellington readers –  because although the Wellington City Council has been driving this, they’ll be looking for money from other local authorities in the region –  to prioritise this issue.

My fear is that once the election is over, there will be a behind-closed-doors process rushed through, with no rigorous evaluation of the economics of the project.  Cheer-leading from the local business community –  always keen on the sort of public subsidies and activities that don’t face the market test that keep Wellington afloat – reinforces the risk.

Surveyed expectations

The Reserve Bank’s quarterly survey of semi-expert opinion on the outlook for various macroeconomic variables was out the other day –  a bit earlier than usual, presumably because of the changes in the schedule of MPS releases.  This is a really rich survey, covering a wide range of variables, and has been running now for nearly 30 years.  But I noticed that the number of respondents is now down to only 52 (and on some questions there were fewer than 40 answers).  Once upon a time, if my memory isn’t failing me, there were nearer 200 respondents.

My impression is that the Bank’s aims have shifted over time: when the survey began in 1987 it was designed to capture the expectations of people making key transactional decisions in the economy.  There were always some economists, but quite a lot of effort went into getting business people and –  reflecting the much greater role of collective employment contracts then  – union officials to participate.   We even had large enough samples that we used to report responses separately for the different classes of respondents.  For some years, we ran a staff survey in parallel, which occasionally highlighted interesting differences between staff and external expectations for the same variables.    I’m not sure who is captured in the 52 respondents the survey now has, but I suspect economists must now make up quite a large proportion.  There isn’t necessarily anything wrong with that –  I suspect few people other than economists have explicit expectations for most macroeconomic variables (inflation might be an exception) and if they ever need such forecasts, they will typically draw on the numbers prepared by economists.  But it probably means the survey is drifting progressively ever closer to something like a consensus forecasts exercise of economists, rather than capturing how people are necessarily thinking in the wider economy.  It is broader than, say, the NZIER Consensus exercise, or than the pool of forecasters the Reserve Bank benchmarks its forecasts against (after all, it includes views of people like me who don’t prepare formal forecasts), but it is a similar class of exercise.

But what to make of the latest survey?  Only one thing really took me by surprise and that was that inflation expectations didn’t fall further.  I revised mine down, after having been stable for several quarters, and had expected the overall survey to show something similar.  After all, the June quarter CPI had surprised on the low side, the exchange rate had increased quite markedly and –  for what its worth –  the breakeven inflation rates derived from indexed and conventional government bonds had fallen further.  In fact, there was barely any change  –  if anything, a barely perceptible increase.

But it is worth remembering just how very weak these inflation expectations are.  The target midpoint –  which the Bank is required to focus on –  is 2 per cent, and last survey in 2014 was the last time two year ahead expectations were as high as 2 per cent.  And that was before the easing phase even got underway.  There have only been two quarters in the last four years when one year ahead expectations have been as high as 2 per cent.  Many of the deviations aren’t that large, but respondents really don’t believe the Bank will be delivering inflation fluctuating around 2 per cent.  That should trouble the Reserve Bank, and must trouble those paid to hold the Bank to account.  After all, actual inflation has been below 2 per cent for a long time now.

There is some short-term noise in the inflation expectations series, and there is some seasonality in the CPI.  But here is another way of looking at the data.   I’ve just averaged the last four observations for each of the four inflation expectations questions (this quarter, next quarter, year ahead, two years ahead) and annualized the two quarterly numbers. In the chart, I’ve shown them against the target midpoint, going all the way back to the end of 1991 –  which was when inflation dropped into the target range for the first time.

inflation expectations ann avg

That prompts several thoughts:

  • we’ve never previously seen all the measures below the midpoint. The last eighteen months or so really is different
  • we’ve never previously seen the two year expectations measures detach from all the other measures for so long,
  • when the shorter-term expectations often ran above the two year measure during the pre-2008 boom, it was the shorter-term measures that better aligned with (I’m hesitant to say “predicted”) what happened to the core inflation measures (the Bank’s own preferred, quite stable, measure peaked above 3 per cent).

The Reserve Bank might defend itself arguing that the fact that the two year expectations are still not too far below 2 per cent is reassuring –  “people trust us, despite the short-term variability”.   I don’t think that is a particularly safe interpretation –  especially when for the shorter-term horizons, about which respondents have much more information, expectations just keep on tracking very low.  Another common response from the Bank is to highlight exchange rate and oil price movements –  but most of the collapse in oil prices was 18 months ago now, and the current exchange rate is around the average for the Governor’s term to date.

A couple of other aspects of the survey caught my eye.  The first was the question about monetary conditions.  Here is what respondents said when asked about the conditions they expected a year from now.

mon conditions yr ahead.png

For seven surveys in a row, respondents have revised down their future expectations. This question has only been running since 1999, but that sort of run of downward revisions has no precedent –  not even during the 2008/09 recession.  Typically, the Bank raises or lowers the OCR and people seem to eventually expect policy to work and conditions to get back to normal. You can see that during 2008/09  –  by the June 2009 survey, respondents were already beginning to revise back up their future expectations.   But not –  yet –  this time.  I’d argue that isn’t surprising –  after all, the 2014 tightening cycle was a mistake, and even now with the OCR at 2.25 per cent, real policy interest rates are still higher than they were as that cycle was getting underway.  But perhaps there is another interpretation that is more favorable to the Bank?

I was also interested in the responses on expected 90 day interest rates –  a close proxy for the OCR.  Quarter ahead and year ahead expectations both fell by 10 basis points, but by next June the median respondent still thinks the 90 day rate will be 2.1 per cent.  That is probably consistent with the OCR at 1.85 per cent.  Respondents expect one more OCR cut –  most probably next week, according to the survey responses, but aren’t sure there will be anything much beyond that.  Perhaps more surprising, the lower quartile response for the year ahead was 2 per cent.  No one can tell the future with any great confidence, but I’d have thought there was rather more of a chance than that that the OCR might need to be cut to 1.5 per cent, or even below, to get inflation back nearer target.

It isn’t obvious how it is going to happen otherwise.  Respondents expect GDP growth to remain around 2.5 per cent.  And they don’t expect any material further reduction in the unemployment rate –  even though I see that Treasury has now revised its NAIRU estimate to 4 per cent –  and they expect only as very modest increase in nominal wage inflation (and of course those responses were completed before yesterday’s wages data).  It typically takes increased capacity pressure to get an acceleration in core inflation, and there is little or no sign of those sorts of pressures emerging in this survey.

So perhaps what we have is respondents reading the Governor much the way I do –  really reluctant to cut the OCR, but he will do so if events overwhelm him (his recent statement suggests next week’s MPS might be that time, if there hasn’t been another miscommunication or policy reversal).  But such a stance offers little chance of inflation getting sustainably back to around 2 per cent in the foreseeable future –  unless there is some really big unforeseen demand shock.

So those two year ahead survey expectations of inflation still look too high to me.   For many years, the ANZ’s survey of (non-expert) small and medium businesses had inflation expectations results above the Bank’s two year ahead survey.  Even those non-expert respondents now have (year ahead) expectations of only 1.49 per cent –  and that much larger survey has had an upside bias, over-predicting actual inflation, over the years.  I still feel pretty confident that the OCR will get to 1.5 per cent before too long –  but the sooner it is done, the less the risk of having to cut even further to restore practical confidence that future inflation will be averaging near the target the Bank has been set.  Sadly, with only 13 months of his term to go, it seems unlikely that Graeme Wheeler will ever preside over a 2 per cent inflation rate, let alone one that averages 2 per cent. But he can still set a better platform now for his successor.


Let’s not give even more statutory powers to the Reserve Bank

This morning the Reserve Bank released a variety of material that followed on from the leak of OCR at the time of March MPS.    Slipped out quietly onto their website – in response to an OIA request from me – was what might best be called the second stage of the leak inquiry report.  It is a document written by Deloitte almost a month after the release of what the Governor has called the “summary report” that was released on 14 April, and in places it is clearly phrased to respond to criticisms made after the release of that report.  I’ll have more to say about that document another day, but would just note that I was touched by the solicitousness of the Bank in deleting my name from a report they were releasing to me, apparently so as to “protect the privacy of natural persons”.  Perhaps they thought I’d forgotten my involvement?

The Bank also put out a press release headed “New Reserve Bank procedures for policy releases”.   After the discontinuation, from 14 April, of pre-release MPS and FSR lock-ups for journalists and analysts, there was pushback, especially from journalists, seeking the reinstatement of media lock-ups, under new and improved security arrangements (as distinct from what Deloitte call the “very high trust” arrangements –  under  which journalists could simply email from the lock-ups whenever they liked –  which had been found sorely wanting).   The Governor had indicated that the Bank would consider the options, and apparently commissioned a “security review” to explore the feasibility of lock-ups with much tighter security.  That review was undertaken under the leadership of Deloitte, but from the text the Bank has released today it is clear that it had a high degree of Reserve Bank staff involvement.

At the end of the process, the Governor has come to the right conclusion.  Lock-ups are not being reinstated, whether for analysts or journalists.  That was an approach I recommended at a time when the Bank itself didn’t even believe there had been a leak.  I commended the Governor’s initial decision to terminate the lock-ups, and I commend him again today.  There is simply no need for such lock-ups, and to hold them inevitably exposes the Bank to unnecessary security risks and/or unnecessary costs.  The public might have been well-served by lock-ups in a pre-internet age –   when it was hard to get timely access to the released documents –  but with today’s technology, the text is open to everyone at much the same time, and the onus is on the Bank to write its documents in a way that clearly communicates the messages it wants to convey.

Of course, the Bank is not seriously committed to openness or competitive neutrality in the access to information.  I have heard that they are still running briefings for analysts after the release.  [UPDATE: A market economist tells me that although they had such a briefing in June, there won’t be any in future]  An overseas expert on central bank communications has recommended –  and I agree with him –  that if such briefings are to be held (and there may be a useful place for them) they should be webcast, so that everyone has access to the same information/interpretation, not just the invited few who find it worthwhile to come all the way to Wellington (recall that most trading in the NZD is done offshore, and most New Zealand government bonds are held offshore).

[UPDATE: On further reflection, I would argue that such a post-release briefing, provided it is made openly available, would be a sensible option and cannot really understand why the Bank has scrapped them.  At a minimum it is less bad (and less costly in time) than lots of analysts approaching the Bank individually, and getting answers that could be (a) inconsistent across analysts, and/or (b) could be influenced by how well the analyst in question gets on with – eg  doesn’t criticize too much – the Bank and its senior economic staff in particular.]

For the media, the Bank notes that

We will also be placing additional emphasis on other opportunities for media access, such as on-the-record media briefings which have been trialled successfully this year.

There may be a place for such briefings, but if they are on-the-record again there is a strong case for webcasting them –  or even quickly publishing a transcript –  again so that everyone has the same information on a timely basis.  And, of course, on-the-record briefings –  with an emphasis on what the Bank wants to tell the media –  are very different from the sort of on-the-record searching interviews that the Governor consistently refuses.

I noted the other day that the Bank is sheltering behind an old provision of the Reserve Bank Act which, they argue, imposes serious sanctions (including a large fine or a term of imprisonment) if they were to release submissions –  especially from banks –  on proposed changes in regulatory policy.  I argued that if they had any sort of commitment to open government they should be promoting a simple amendment to the Act, to ensure that such submissions were fully, and simply, within the ambit of the Official Information Act.  If the Bank won’t promote such a change, perhaps an MP with a commitment to open government might.

So when I read through the Deloitte security review document, I was struck by the number of times that report had encouraged the Bank to seek a change to the Reserve Bank Act, this time to provide criminal sanctions for the early unauthorized release of OCR or MPS (or FSR?) material.  I suspect the idea for such a change did not come from Deloitte, but from Bank management themselves – in particular from the Deputy Governor responsible for such things (and former Government Statistician) Geoff Bascand.  In previous material released on the OCR leak, Bascand was on record as noting that Reserve Bank material of this sort did not have the sort of protections the Statistics Act provided to Statistics New Zealand.

It is really important that when the coercive powers of the state are used to compel individuals and firms to provide information to state agencies that people can be confident that that information is held securely.  Severe punishment for the inappropriate release of private information supplied by other people is quite appropriate.  But in fact, both the Statistics Act and the Reserve Bank Act already provide such penalties –  under the Reserve Bank Act someone can be sent to prison for three months, or a company can face a half million dollar fine.

But the economic forecasts and policy views of a government official (the Governor in this case) are a quite different matter.  And in many respect, that sort of information is not so different than the private information a firm might hold about a proposed merger or acquisition, about its planned dividend, about a new investment project, or –  in the New Zealand case –  Fonterra’s expected dairy payout.  Perhaps I’m wrong, but I’m not aware that there are criminal sanctions that protect, say, government Budget documents, or any other release of planned policy or legislation by government ministers.

In all those cases, confidentiality is clearly important to the information holder.  But in each case there would appear to be civil procedures open to information holders to protect the confidentiality of their information.  Typically, some staff in the relevant organization would have access to such information, and early unauthorized release would typically be a grounds for disciplinary action or perhaps even dismissal.    But other parties might too –  government Budget documents are printed externally, as is the MPS.  Sometimes professional advisers –  eg lawyers –  will be involved. And in some cases, entities will choose to provide information under embargo, or even to hold a lock-up.  In each and every case, it is open to the owner/provider of the information to specify in contract the confidentiality obligations of any party receiving the information.   Remedies for breaches of those policies are the responsibility of the institution providing the information.  There is no obvious need for criminal sanctions to be introduced in the process.  I hope that the Reserve Bank thinks again, and decides not to seek amendments of the sort Deloitte (no doubt at the Bank’s prompting) has suggested.  There is simply nothing that special about the OCR information –  it is not private information involuntarily provided to a government agency, and nor is it (say) material relating to national security.

In conclusion, it is interesting that in all the material that has emerged in recent months there has been little or no mention of one of the greatest security risks the Bank –  quite unnecessarily  – faces.    In most countries, the OCR decision is made and released on the same day –  that will have been what happened at the RBA yesterday.  The Reserve Bank has considerably shortened the lags over recent years, but as their recent article on the monetary policy process decision illustrates, the OCR decision to be released next Thursday will be made by the Governor this Friday.  There is six whole days when the information about the decision is known within the Bank.  Even if the formal knowledge is kept to a relatively small group –  when I was involved it was 10 to 15 people – it is simply an unnecessary risk.  With the best will in the world,it is almost inevitable that one day some one will let something slip, and there will be a huge uproar.  In terms of tightening security, still the best reform the Bank could make would be to release the OCR decision on the day it is made.


Wellington…still growing sluggishly

There was an annoying story on the front page of the Dominion-Post this morning.  The online version of the story is headed “The big squeeze: Wellington’s population could almost double in the next 30 years”, a proposition which appears to be based on nothing more than compounding last year’s estimated population growth for the Wellington city area.  I suppose anything could happen.  The annual immigration target could be doubled or trebled, central government could go on a massive expansion path, or the private sector could discover hitherto untapped opportunities in Wellington.

But if Wellington has outstripped Dunedin over the years, it has hardly managed strong growth.  I went back to my 1913 New Zealand Official Yearbook.  Back then, greater Wellington made up 17 per cent of the total population of the 14 large urban areas (a group made up of the places that were largest then, and those which are largest now –  eg in 1913 Hamilton and Tauranga barely figured, while Gisborne and Timaru did).  Today, the population of greater Wellington (including Kapiti) is about 14 per cent of the population of those 14 urban areas.
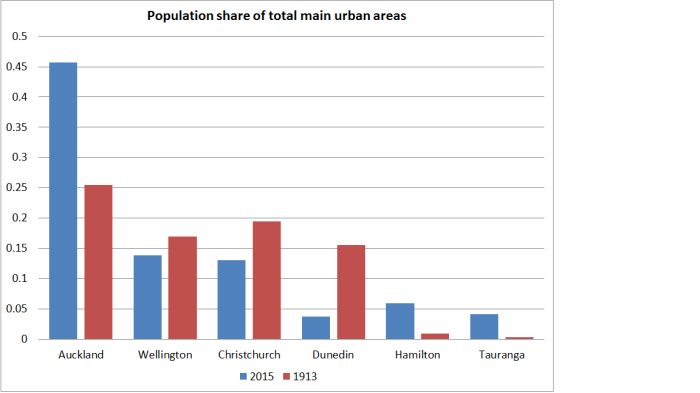
population shares wgtn

More recently, SNZ reports estimated data for urban area populations from 1996 to 2015.  Over that period, even Wellington city’s population growth has only slightly exceeded population growth for the country as a whole  –  and been ever so slightly slower than population growth in Nelson.  Take the greater Wellington area and population growth has been slower than that in greater Christchurch, despite the massive disruption from the earthquakes.

population growth since 1996

I’m not sure that this should greatly surprise anyone.  Wellington has been helped by the growth of government (the regulatory state needs staff and it keeps growing, even if the tax share in GDP doesn’t) and by happening to have industries which it remains fashionable to subsidise (the film industry).  On the other hand, it has a somewhat bracing climate –  albeit one staunchly defended by some true Wellingtonians.    There have been some good market-driven businesses built here, but not many choose (and find it optimal) to stay in the longer-term.

Average GDP per capita in Wellington is higher than that in New Zealand as a whole –  no doubt reflecting some combination of the huge number of professional government and government-dependent roles, and the fact that Wellington tends to be attractive to young people not old ones (it is windy and not very warm).  The labour force participation rate in Wellington averages higher than those in, say, Auckland and Christchurch.  But over the 15 years for which we have regional GDP data, average per capita GDP in Wellington has been growing more slowly than that in the rest of the country (a similar story to Auckland).
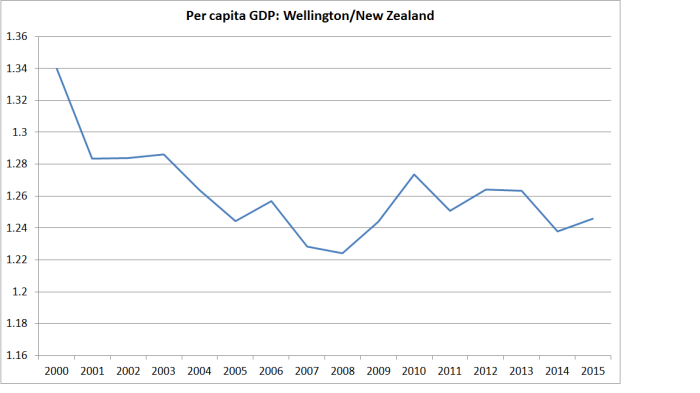
wgtn regional GDP

So I don’t really see much chance that the population of Wellington – even just that of Wellington city –  is going to double over 30 years.   Even the Wellington City Council’s “chief city planner” (shouldn’t anyone from outside the old eastern-bloc be embarrassed to hold such a title?) acknowledges it is unlikely.

But the focus of the Stuff article was on the Wellington housing market.    Of course, since it is an article about local authorities perhaps it isn’t too surprising that the word “market” does not appear at all –  not once in a reasonably substantial article.  The Council’s British chief bureaucrat, Kevin Lavery, is quoted instead as saying

Lavery said the 15 people who find themselves sitting around the Wellington City Council table after October’s election will have some big decisions to make on the supply, quality and diversity of housing in the capital.

Which really sums up all that is wrong with our system of local government.  Councils and their officials simply should not be in the business of making decisions on the “supply, quality, or diversity” of housing in the city.  That is what we have –  or should have –  markets for.  They are the mechanisms through which private tastes and preferences are reflected and private businesses respond to that (actual and anticipated) demand.  We need local authorities to do things like pave the streets, manage the water and sewerage, provide parks, and perhaps even run libraries.  We don’t need them deciding what sort of houses people are living in and where   The problems –  including the affordability problems – mostly arise when officials and councillors get in the way.  Now if Mr Lavery had simply been noting that no one can really predict what future population growth rates will be, or where people and businesses will prefer to operate, and that Council rules need to be sufficiently minimalistic and flexible to enable housing supply to easily respond to emerging demand, I’d have applauded him.  But no, he doesn’t see a dominant role for the market, but for 15 elected individuals, with neither the expertise nor the incentives to get those decisions right –  and that is no criticism of them individually, no one has that knowledge.

But the “chief city planner” is worried.

The danger was that developers would concentrate more on packing people in than on good design. “We’re not out to generate developments and profit margins for developers. We’re building communities.”

Council bureaucrats are “building communities”?  The mindset is really quite starkly on display.  In market economies, profit margins are part of what makes people willing to take risks, and build businesses –  even develop new subdivisions or apartment blocks –  taking the risk that things might actually go badly wrong.  But “profit margins” seem anathema to the chief planner.  And “good design” seems mostly to be a mantra to impose the tastes of some on everyone, and raise costs of housing.  Again, why is it a matter for local government?

It isn’t just the bureaucrats. Here is our Mayor, presumably somewhat torn between her Green Party credentials (supposedly sceptical of population growth) and her local authority boosterism.

Wellington Mayor Celia Wade-Brown said she believed her council had done plenty during her six years in charge to set the city up for a population boom.

It had signed off on a number of special housing areas with the Government, and was actively consulting communities in several suburbs on potential medium-density housing rules.

Establishing an Urban Development Agency this year would also help increase the city’s housing stock and keep prices in check, she said. The agency will be able to buy and assemble land parcels, and partner with developers.

It is all about bureaucrats and politicians, not at all about empowering markets.  Nothing about respecting property rights or promoting market solutions –  just put your trust in the Mayor and Council staff.  I’m wryly amused by her references to SHAs. There are a few not far from here.  One –  on the site of an old church –  now has a few townhouses almost completed. A much larger one, not 200 metres from where I sit, remains as overgrown, dark, brooding, and undeveloped as ever.  I’m keen to see it developed – though I know many locals aren’t –  but there is simply no sign of any progress.

I guess the election is coming up and the incumbent isn’t well-positioned but when she can end with the observation that

“When our average house price is $560,000 and the Government considers $600,000 to be affordable in Auckland, then I think our city is looking pretty good.”

it is as if very small ambitions indeed have triumphed.

One only has to fly over Wellington to realise just how much land there is in both Wellington city, and the greater Wellington area.  No doubt, the development costs are higher than those for flat cities such as Hamilton, Palmerston North or Hastings.   But there is little excuse for average house prices of $560000 –  responsibility  for that mostly rests with the mayor, councillors and their legion of planners, aided and abetted by central governments that have allowed councils to have such powers.

The Productivity Commission’s draft report on a new urban land use policy framework is apparently due out next month.  They had a mandate to be ambitious in their proposals.  The Commission has so far shown a disconcerting enthusiasm for giving more powers to councils and governments, not fewer (they are bureaucrats themselves, so perhaps even if disappointing it shouldn’t be so surprising). I hope they take seriously the possibility of largely withdrawing the state (central and local) from the urban planning business.  There was a nice piece the other day from a US commentator, Justin Fox, marking the 100th anniversary of zoning in New York.

It also appears to have been the first set of land-use rules in the U.S. that (1) covered an entire city and (2) used the word “zone.”

That was 100 years ago Monday. So happy birthday, zoning! OK if we kill you now — or at least maim you?

There’s a thought. Put markets, and private contracts, back in the driver’s seat, and let local authorities respond to private sector developments, efficiently delivering the limited range of services we really need councils to provide.  Don’t “plan communities”, but provide services to ones that develop.  (And that doesn’t include airport runways.)