I’ve never really been persuaded that it is a good idea for public servants to be giving speeches, unless perhaps they are simply and explicitly explaining or articulating government policy. If they are, instead, purporting to run their own views or those of their agency it is almost inevitable that we will be getting less than the unvarnished picture and more than a few convenient omissions. Public servants still have to work with current ministers after all.
The thought came to mind again when I read a speech given last week by Struan Little, now a “chief strategist” at the Treasury but until recently a senior Deputy Secretary (and actually Acting Secretary for a time last year). The speech was to some accountants’ tax conference, under the heading “The role of the tax system in addressing New Zealand’s intertwined fiscal and economic challenges”. All else equal, you might suppose that lower taxes would be more likely to be part of dealing with the productivity failings and perhaps higher taxes might have some role to play in closing the gaping fiscal gaps. It isn’t clear that Treasury necessarily sees it that way. They seem quite keen on raising taxes generally, especially on returns to capital.
(To be clear, I’ve been on record for some time picking that whoever is in government over the next few years the GST rate will rise, but that is prediction not prescription – and I’m not a senior official. Somewhat oddly, in his speech Little claims that “there are no simple options to raise substantial merit over the shorter term” when, whatever the merits of such a policy, raising GST is certainly simple.)
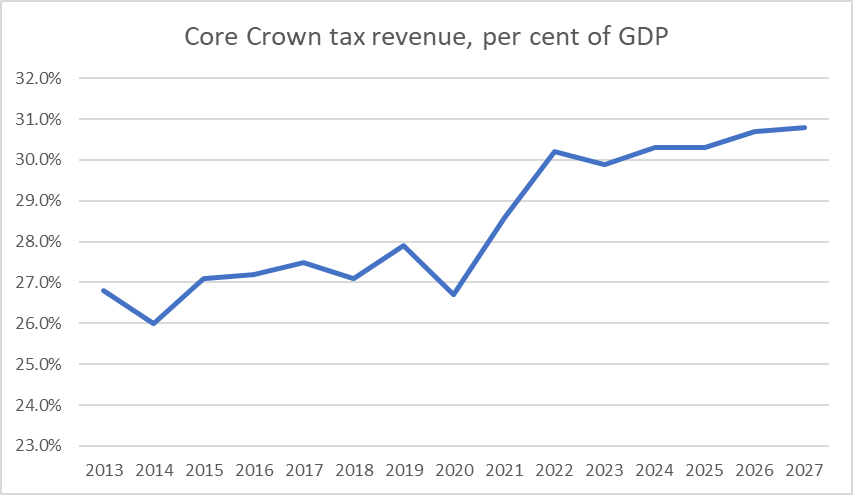
Now, I guess it was a tax conference, but it was slightly odd that not even once was it mentioned how much spending has increased in the last few years. Core Crown operating expenses were 28 per cent of GDP in the last full pre-Covid year (to June 2019) and in this budget were projected to be 32.9 per cent of GDP this year (25/26), slightly UP on last year. The current structural deficit, from the same budget documents, was projected to be about 2 per cent of GDP. I guess officials always need to have tools to hand if politicians want to go the higher tax route but it isn’t obvious that the scope of expenditure savings has been exhausted (or even much begun perhaps outside core departmental operating costs, which generally isn’t where the big money is).
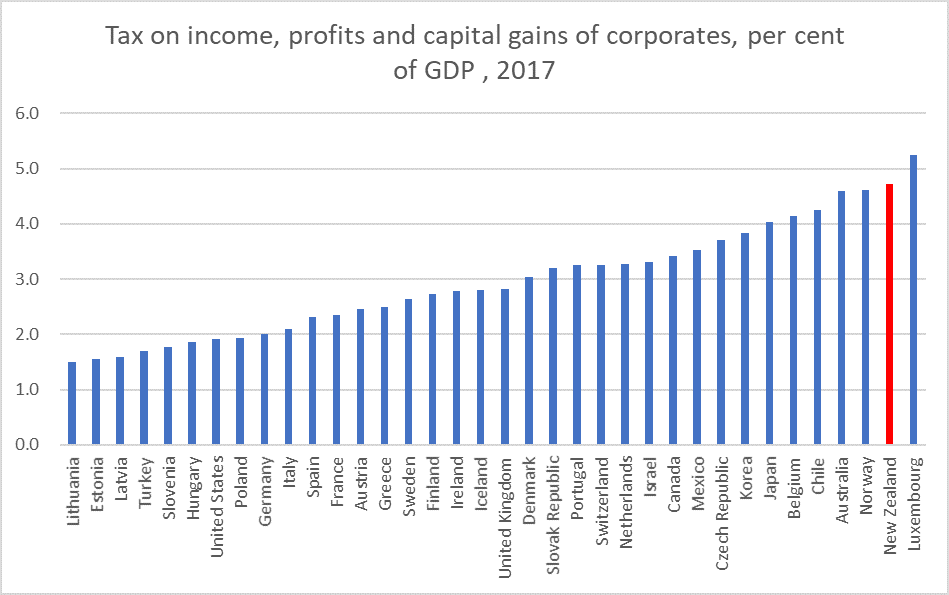
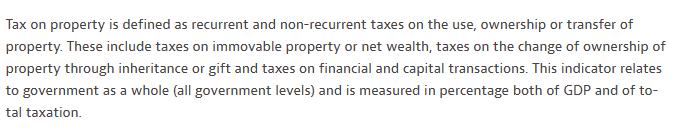
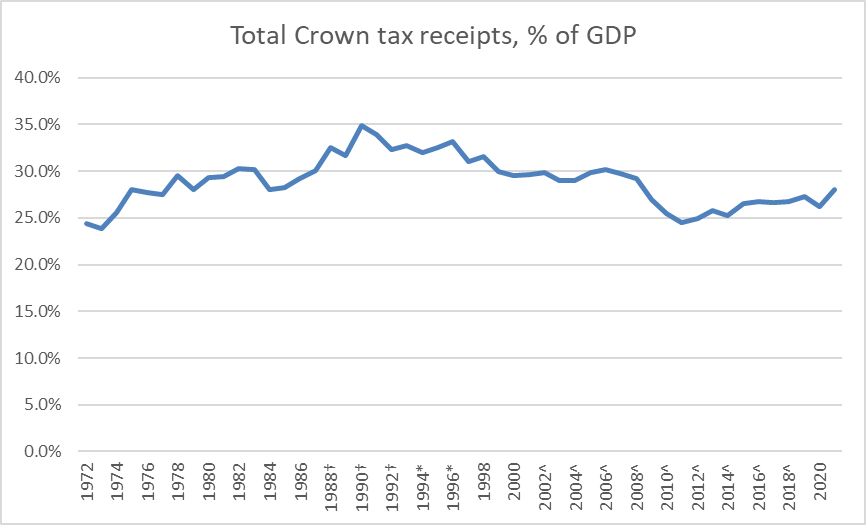
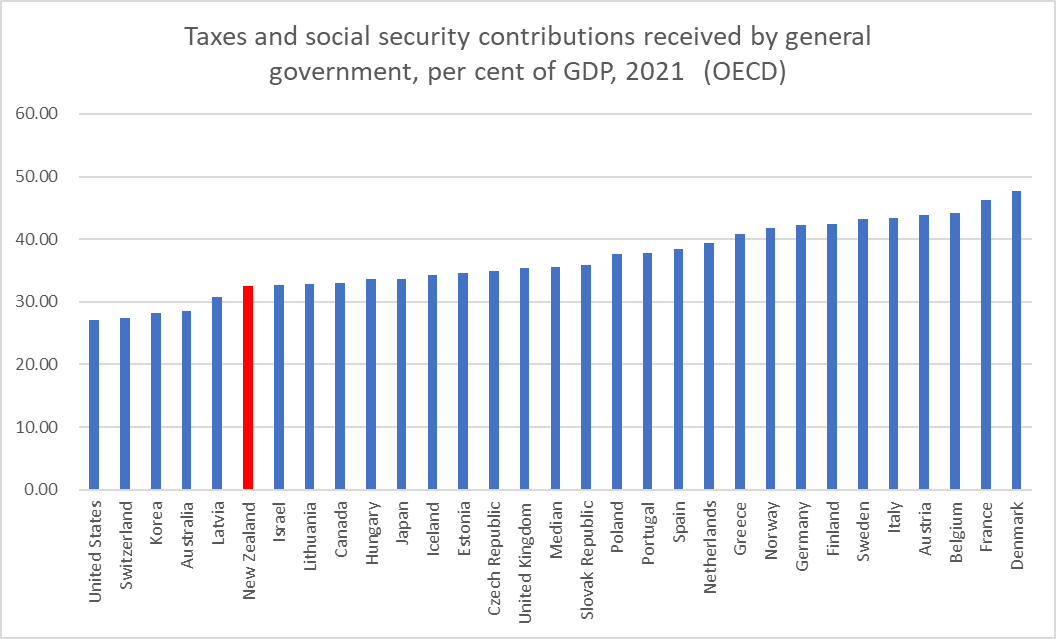
Remarkably also, there is no mention at all in the speech that New Zealand’s company tax rate is among the highest in OECD countries. In the literature, the real economic costs of company taxes are generally found to far exceed those of other main types of tax. There is no mention either that New Zealand has long taken one of the highest shares of GDP in corporate tax revenue.
That chart is a few years old now but the OECD data are very dated and the most recent I could find on a quick search was for 2020 (when, unsurprisingly, we would still have been well to the right on this chart).
Instead what we got is a straw man discussion, claiming that life (and literature) have moved on and that now everyone agrees the tax rate on returns to capital should be positive. In practice no one has seriously argued in the New Zealand debate that capital income should generally be taxed at zero, notwithstanding some literature suggesting that on certain assumptions a zero rate might be optimal. Where there is debate is a) how high that rate should be, and b) what should count as taxable (capital) income.
Now, to be fair, on a couple of occasions Little suggests that we need to cut taxation on returns to inward foreign investment (because of our imputation system the company tax rate falls most directly on foreign investors), but then never addresses the issue as to whether or why our income tax regime should treat foreign investors more favourably than domestic investors and what the implications of that might be.
Treasury has, of course, long been keen on the idea of a capital gains tax. Little repeats an estimate from the Tax Working Group some years ago suggesting that such a tax might raise 1.2 per cent of GDP per annum but then never bothers engaging with the fact that the largest source of (real) capital gains in recent decades has been in housing, and that the reform programme of the current government is supposed, at least according to the Minister responsible (if not to his boss) to be lowering house prices, and (presumably) making sustained and systematic real capital gains on housing/land a thing of the past.
Little champions the somewhat-strange Investment Boost subsidy introduced in this year’s Budget, and yet (of course) never notes that the biggest returns (by a considerable margin) to that subsidy are for investment in new commercial buildings. The very same sector that the government (perhaps over Treasury objections) increased taxes on last year, when it barred tax depreciation on commercial buildings. Where is the coherence in that? Or in the fact that Investment Boost offers a subsidy to rest home operators but not to providers of rental accommodation? But I guess Treasury wouldn’t really want to comment in public on any of that. The Minister would certainly not have been keen on them doing so. He never offers any thoughts either on why subsidising a specific input – as if capital goods are some sort of merit good – is preferable to lowering the tax rate on returns to whatever combination of inputs firms find most profit-maximising.
We also get the same (now decades-old) line about housing being tax-favoured while never noting either a) that the story of New Zealand in recent decades has been too little housing (& urban land) not too much, or b) that the largest tax advantage by far in respect of housing is to the owner-occupiers with no debt. Perhaps Treasury favours taxing imputed rents (with suitable deductions including for mortgage interest) but if so there is no hint of it in the speech (something for which the Minister would no doubt be grateful).
And there are tantalising but concerning lines suggesting Treasury might favour rather arbitrary distinctions between returns to different types of capital. Thus, there is mention late in the speech of possibly in future reducing tax on “productive capital investment” (which then does Treasury regard as “unproductive” ex ante), there is a reference at one point to taxation on “physical capital”, without being clear as to why physical capital returns should be treated differently than returns on intangible capital. And perhaps potentially most concerningly there was this line: “a coherent approach would not necessarily mean taxing all capital [returns to capital?] at the same rate, since not all capital is the same”. What, one wonders, does Treasury have in mind there? After all, not all human capital is the same either (you are different than me) but our tax system treats all financial returns to it much the same anyway (or so it seems to me; perhaps I’m missing something).
There are some fair points in the speech. Little notes that our system “penalises certain types of saving when inflation is high”, which is true but understates the point: even 2 per cent inflation results in such distortions, and they apply to borrowing (when interest is deductible, which it generally is for business) and depreciation, not just to returns on fixed interest assets. These distortions have been known for many decades, and yet there seems to be no momentum – political or bureaucratic – to address them, whether by changes to the tax system or to the inflation target.
And there was a paragraph late in the speech that I very much welcomed.
I’ve long been keen on a Nordic approach and it was an option noted by the 2025 Taskforce back in 2009. But what chance is there that the bureaucrats might support such a change? When I was involved in tax debates IRD was quite resistant to any cuts to business tax rates arguing (with little or no evidence) that many taxable profits were rents – returns above the cost of capital – and that taxing them came at little or no cost. And if by some chance a new generation of officials has emerged, what chance ministers (whichever main party is in government) being that bold. Another growth-supportive option that might have warranted mention in that paragraph would have been work on the possibility of a progressive consumption tax.
As I noted at the start of the post, I’m not sure senior officials really should be making speeches other than to represent the policy of the government of the day. They simply can’t add much, or any sort of unconstrained perspective. The free and frank advice has to be for ministers. That said, perhaps at some point it would be useful for Treasury to publish some research/analysis outlining what sort of tax structure would, in its view, be most conducive to supporting a much faster rate of productivity growth in New Zealand. It is unlikely that tax system changes could ever represent any sort of panacea but insights into the mental models of the government’s premier economic advisers could still be useful. Since it isn’t impossible that the answer might be much lower taxes (and thus spending) than at present, you could even put some constraints around the exercise: if you (or your political master) needed to raise 27 per cent of GDP in tax, which mix of taxes and tax rates would be most consistent with helping enable a materially faster rate of productivity growth.
After the discussion in my post yesterday on the Investment Boost subsidy scheme announced in the Budget I thought a bit more about who was likely to benefit the most from it.
The general answer of course is the purchasers of the longest-lived assets.
Why? Because if you have an asset which IRD estimates to have a useful life of 100 years, your straight line depreciation deduction normally would be 1% per annum for each of those 100 years. But under investment boost, you get to do almost the first 21 years of deductions in the first year (the 20% Investment Boost deduction plus your 0.8% normal depreciation), and then the annual deduction each year thereafter is reduced by a little. But money today is very valuable relative to money given up (ie higher taxable income because of reduced future annual deductions) decades hence.
If on the other hand, you have an investment asset that has an estimated life of only 5 years (and there are many of them) it would normally be depreciated (straight line) at 20% per annum. Under Investment Boost, you get to deduct 36 per cent in year 1, but that additional depreciation upfront is clawed back over only the following four years. The Investment Boost additional upfront deduction has a positive present value, but it is fairly modest for such short-lived assets.
And what are the longest-lived assets? They will mostly be buildings. And, as we know, last year the government (with Labour’s support) moved to abolish tax depreciation altogether on commercial buildings (with an estimated useful life in excess of 50 years).
And that hugely magnifies the advantage of the Investment Boost policy for purchasers of new commercial buildings. Not only are they very long-lived assets but because there is no general tax depreciation on these assets, there is no depreciation clawback. The 20 per cent Investment Boost deduction is just pure gift (recall that the actual value to companies of all these deductions is 28 per cent of the value of the deduction itself – the company tax rate).
I did a little illustrative exercise in the table below, comparing the present value of the Investment Boost deduction for three different types of assets: commercial buildings, a winch (which IRD estimates has a 10 year useful life), and a printer (IRD estimates a five year useful life). Under the policy, in year 1 you get to deduct 20 per cent of the value of the asset plus normal depreciation calculated on the remaining 80 per cent. I’ve evaluated each option using a discount rate of 5 per cent (choice of discount rate won’t change the relative story across assets).
On plausible scenarios, Investment Boost is much much more beneficial to purchasers of commercial buildings than it is to most other assets (eight times as much for the same capital outlay on an asset with a life of five years[but see update at end of post]). There are, of course, other business assets with longer useful lives than 10 years (my winch example) but if you skim through the IRD schedule not that many more than 15.5 years.
And this a sector that just a year ago the government thought should get no tax depreciation at all…..
And a reminder, per yesterday’s post, that the IRD Fact Sheet on this policy says that (new or extended) rest homes will get to benefit from this (substantial) deduction, but that rental accommodation built afresh for any demographics to live in will not.
I challenge you to find the intellectual coherence in that.
Of course, you wouldn’t have got from anything announced on Budget day the sense that new commercial building purchasers were going to be by far the biggest winners. The Minister’s press release on the policy talks of how
To achieve that growth, New Zealand needs businesses to invest in productive assets – like machinery, tools, equipment, vehicles and technology.
But not a mention of commercial buildings. And perhaps more strangely, there is no discussion at all in the IRD/Treasury RIS of which sectors will benefit most, let alone the consistency with last year’s policy initiative on tax deprecation for commercial buildings, or of the rather anomalous situation where some new commercial residential accommodation (rest homes) gets the subsidy, while most of that market doesn’t. Quite extraordinary really.
It needn’t have worked out that way. Had the policy been set up to allow (say) double the normal rate of depreciation, until the asset was fully depreciated – rather than a flat 20 per cent in the first year – then there’d have been no benefit for commercial buildings at all (and whatever the merits of that at least it would have been consistent from one year to the next). Doing it in combination with restoring tax depreciation for commercial buildings might have involved initial backtracking but would at least have the merit of some consistency and coherence now.
UPDATE: A commenter notes that I really should compare scenarios with replacement at the end of the asset’s useful life. That is right. It will matter for the absolute comparison between 5 and 10 year assets (reduces the PV margin of a 10 year asset to 15% or so), and for the absolute scale of advantage of commercial buildings, but – since there is no clawback at all in respect of commercial buildings – it does not change the point that Investment Boost most strongly favours commercial building investment. Moreover, and all else equal, an investor with even a mild degree of risk aversion would favour cash in hand (20% immediate deduction on a 100 year life asset) over the uncertainty of the deduction regime at each replacement of shorter-lived assets.
Opening The Post on Monday morning it was as if the 2026 election campaign had gotten underway already, even as we sit waiting for the new government to form.
Under the headline “An answer to National’s revenue gap” was a column by the CTU economist, and former Grant Robertson adviser, Craig Renney suggesting that National should scrap most everything it campaigned on and adopt instead a left-wing tax policy approach that was not acceptable even to the Hipkins Labour Party this year. But then we learned last week that Labour itself was putting all revenue options back on the table as it thinks about its own future. One media profile last year suggested that Renney is keen on getting into Parliament, and to be fair you’d have to acknowledge that he was a more high profile, perhaps even effective, campaigner this year than most Cabinet ministers.
Anyway, Renney’s idea is that we should look to the United Nations for guidance on tax policy (why?). Some United Nations report apparently mentions windfall profits taxes, and the number of them introduced in various European countries last year and this.
Renney quotes this UN report saying “several developed countries introduced taxes aimed at ensuring a fair distribution of profits in industries that have experienced significant gains because of the pandemic and financing recovery programmes, or subsidies for energy consumers”.
And then he leaps into claiming the relevance of this to New Zealand. Where does he start? With, of all companies, Air New Zealand (“Last year, Air New Zealand’s profit was up 180%.”)
We are seriously supposed to believe that Air New Zealand experienced significant gains because of the pandemic? The company that only survived on government handouts and recapitalisations after its business dropped away very very sharply, through the mix of closed borders and individual reluctance to travel? The company that lost $454 million in the year to June 2020, lost $289 million in the year to June 2021, and lost $591 million in the year to June 2022, before recovering to make $412 milllion in the year to June 2023. Shareholders – the largest of which is the government itself – simply lost truckloads of money from owning an airline through a pandemic. As you might expect. But Renney apparently thinks them a serious candidate for a windfall profits tax….
Another extraordinary feature of his article is that as he talks up European governments imposing windfall profits taxes he never once mentions that the overwhelming bulk of such taxes were imposed on fuel companies in the wake of the sanctions the EU (and a bunch of other countries) put on Russian gas and oil exports after the invasion of Ukraine, which had the effect of driving European gas prices, and thus marginal wholesale power prices sky high. There is perhaps a certain logic in governments that make a product artificially scarce (in pursuit of admirable geopolitical ends) also taxing what might be genuinely windfall gains. One might haggle over how such taxes were imposed etc (there is good reason to think many were ill-designed if they were really supposed to be windfall taxes), but the basic idea isn’t prima facie absurd.
(If you want an accessible summary of what the Europeans have been doing, try this recent report.)
But……New Zealand wasn’t directly affected by those sky-high gas prices (one reason why headline here never went as high as it did in many European countries, including the UK). It doesn’t stop Renney of course (writing of New Zealand, “the top four energy companies made $2.7 billion in operating profits, or $7.4 milllion profit per day”, without any sense of context or scale (return on equity eg) or any sense at all of there being anything ‘windfall’ at all about those profits).
How wide-ranging are those European taxes?
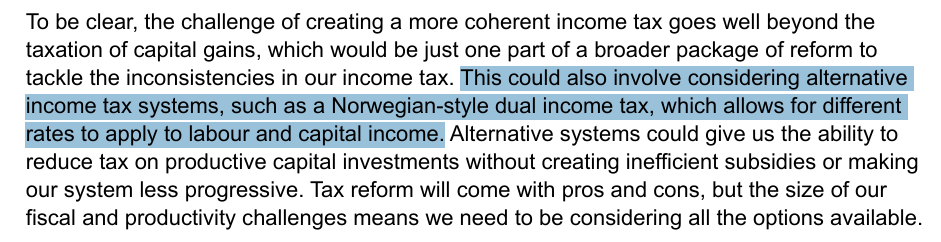
Renney tries to tell us that “globally, these taxes were aimed at……markets where there is little competition (such as supermarkets)”, but in fact that seems to be a sample of one country with a tax on supermarket-type entities (itself done in a distortionary manner to apply only to big companies), in one of Europe’s less-than-stellar economies. As that clip above says, Croatia introduced one (not really focused on true “windfalls” at all), imposed for a single year on all big companies (200 or so). Much of the focus of these measures was to pay for big consumer energy subsidies, in the face of that same energy price shock induced by the sanctions. None of which has any relevance to New Zealand, or to any sort of medium-term revenue strategy. And we know people think New Zealand supermarkets make “too much” money, but whatever the merits of that argument it has nothing to do with any serious analysis of a case for windfall profits taxes. (As it happens, I thought there might have been an arguable in-principle case in respect of the profits supermarkets were given by the government when it forced almost all other food retailers to close during lockdowns, channelling all business to the supermarkets………but I guess that rather arbitrary distortion was done on Renney’s own watch as adviser to the Minister of Finance.)
Ah, but then there are the banks, bete noire of the New Zealand left (whether they really dislike the banks or simply find them a convenient populist whipping boy is never quite clear). As that clip above noted, a handful of European countries had imposed “windfall” profits taxes on banks (whatever Italy was first proposing was substantially watered down). I didn’t look up all those cases, but I had a look at Hungary – a government that of course the left usually looks utterly askance at – where the so-called windfall profits tax isn’t even based on profits, or any credible sense of identifiable windfall – it is just a crude tax grab based on revenue (not profits) and this year was sharply modified through further financial repression – banks could avoid much of the tax if only they bought more government bonds.
But what of New Zealand and the banks operating here? We know Renney’s old boss the (still) Minister of Finance got tantalised a year ago by the idea, before being eventually talked out of it.
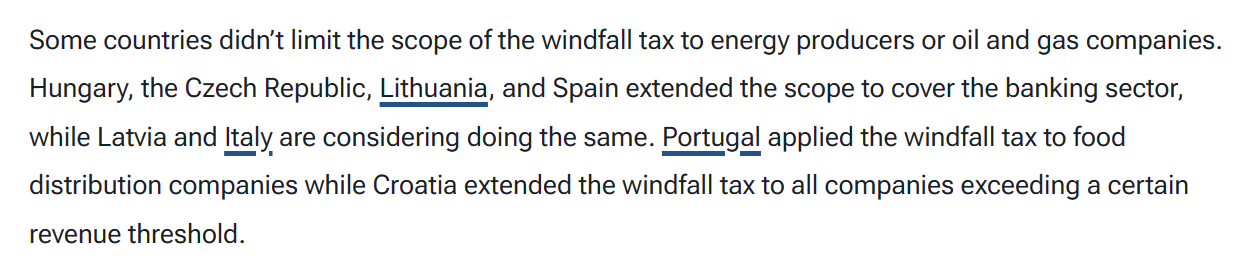
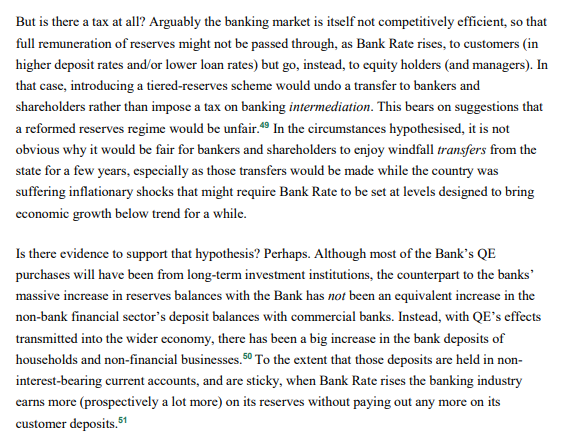
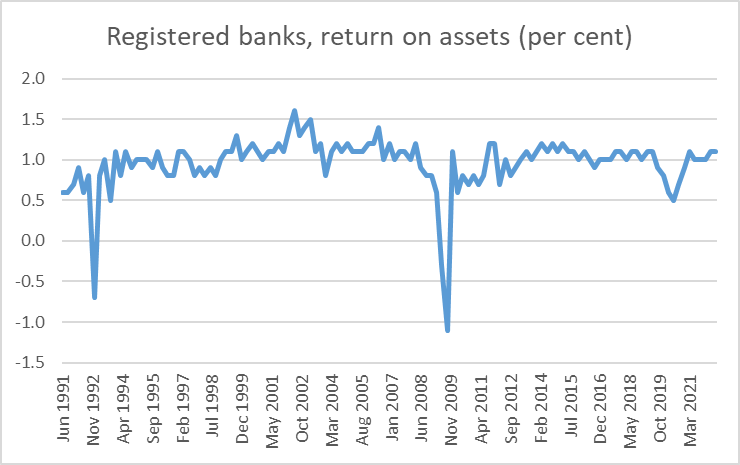
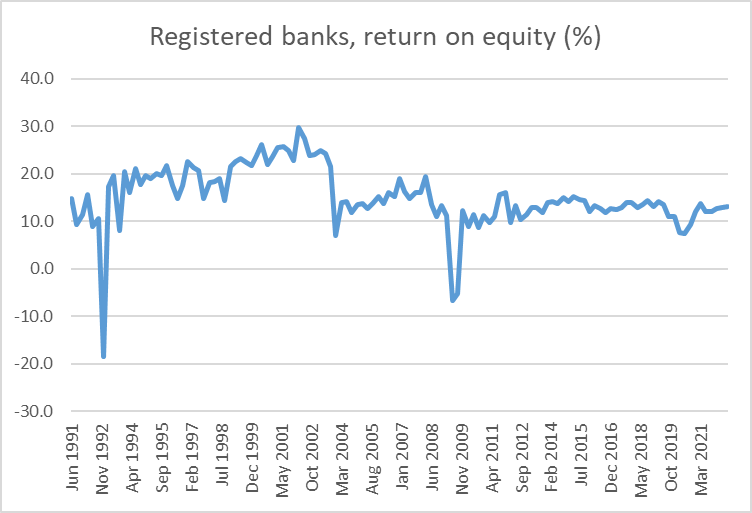
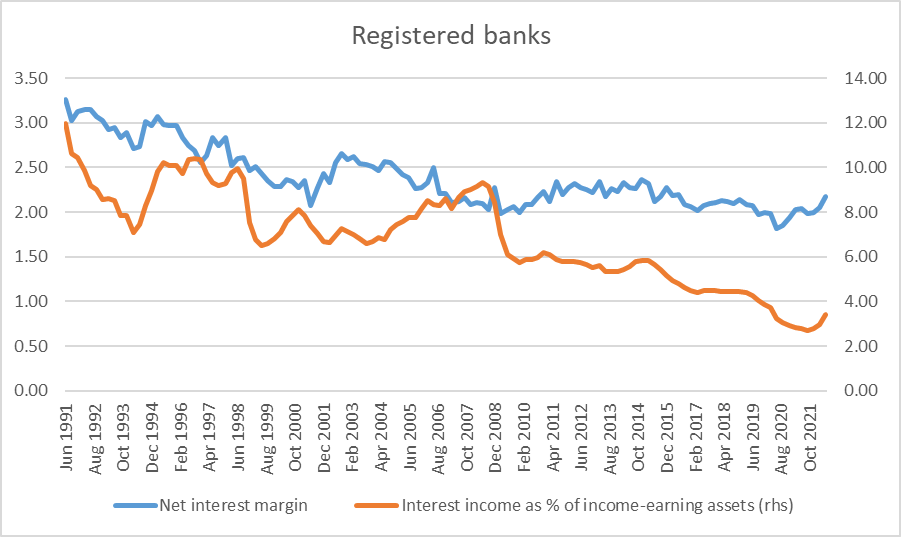
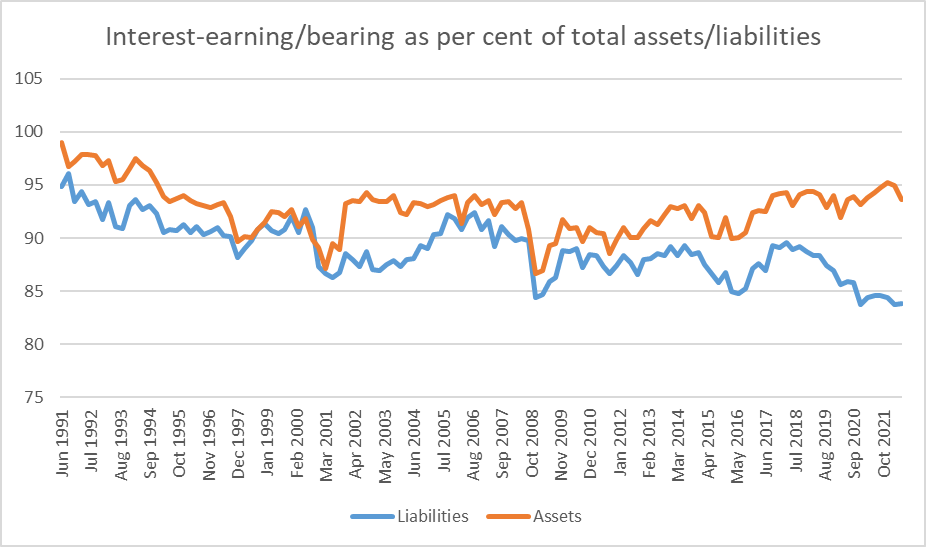
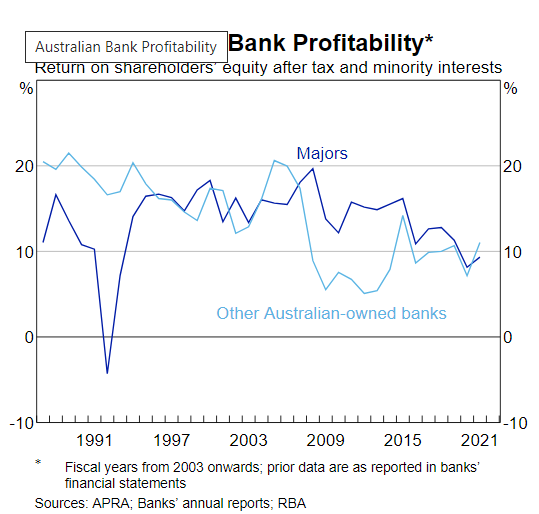
And as for the data
there is simply no evidence of a pandemic or post-pandemic windfall for banks. If anything, return on equity has been trending downwards (as you’d expect in the face of higher capital ratios), and if you really think there are important barriers to entry etc, tackle those directly. Your party was, after all, the government for the last six years.
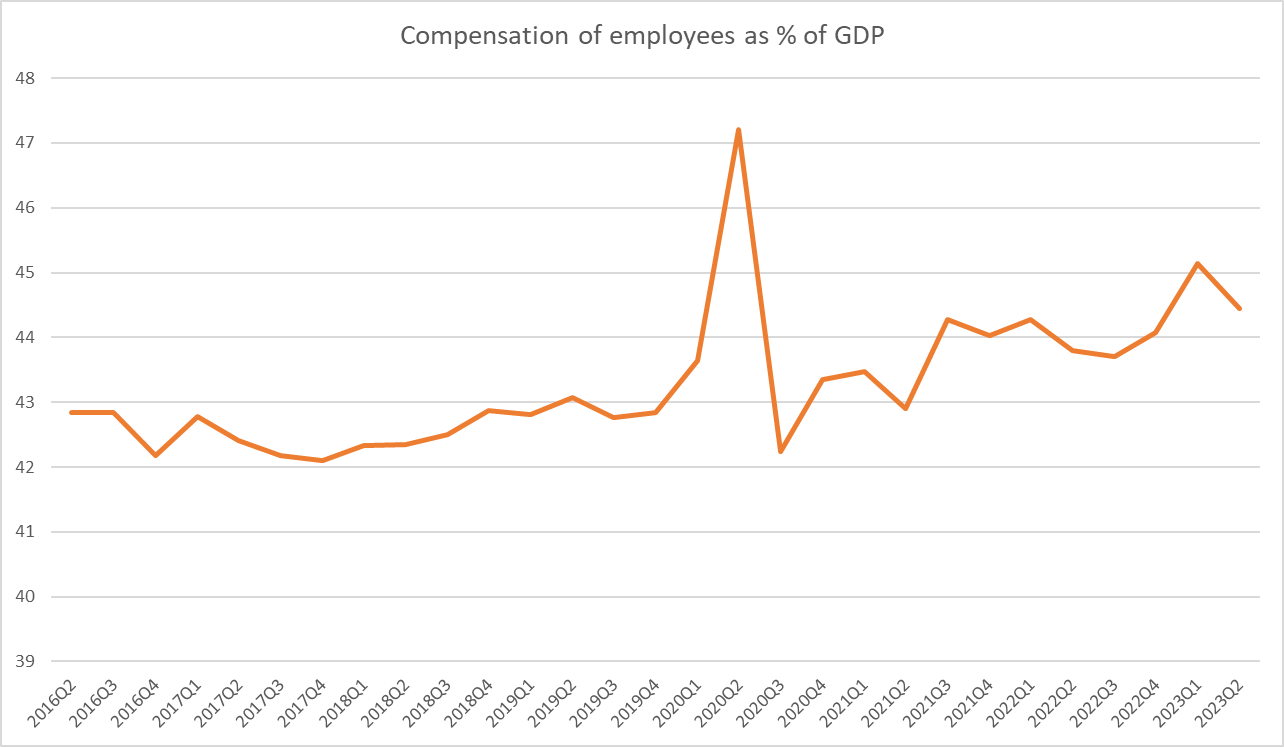
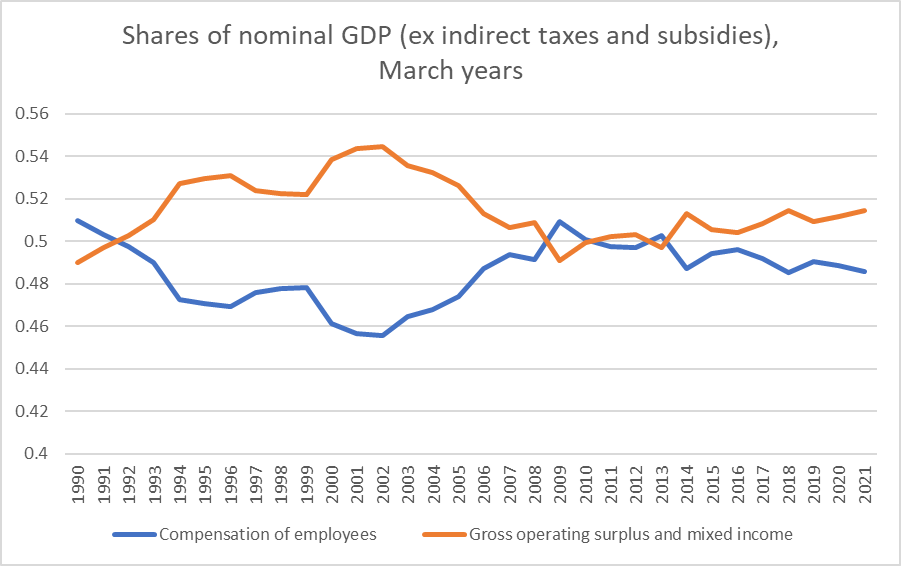
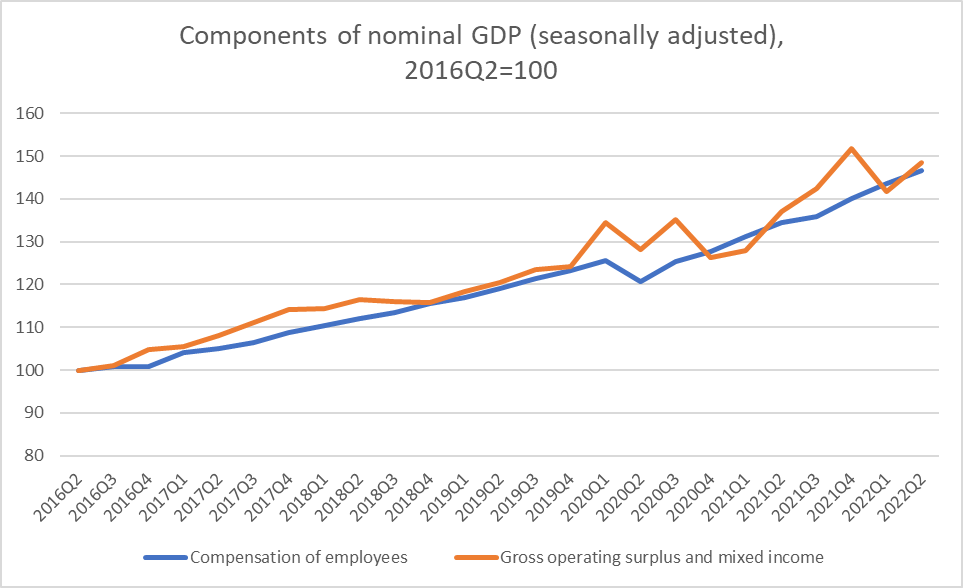
As for those rapacious businesses more generally……well, workers have had an increased share of GDP over the last couple of years (as you might expect in an badly overheated labour market).
Renney goes on to claim “perhaps the most compelling case for their use comes from the fact that many of the countries that have launched windfall taxes now have lower levels of inflation than New Zealand”. That isn’t even a serious attempt at economic or policy analysis (let alone something warranting “the most compelling case”, unless Renney is conceding that the actual substantive case is threadbare). Of course, if you use big direct subsidies to consumers you can lower headline inflation – Renney’s Labour government did that for a year with the petrol excise tax cut, without even suggesting a way to pay for that largesse – and many of these European so-called windfall taxes have been mostly about financing such subsidies. What matters macroeconomically is much more about measures of core inflation.
We could check out some of those countries that did more than just energy taxes, except that almost all of them are in the euro, where monetary policy is set for the region as a whole (Germany by far the biggest economy). And of the two that aren’t, Hungary had core inflation in the year to September of 12.8 per cent and the Czech Republic had 7.1 per cent core inflation in the same period.
In his final paragraph, Renney comes back to the banks – the honeypot the left keeps eyeing up. There he writes that “I’m confident that the current chairs of the big four banks wouldn’t mind a phone call from the incoming prime minister asking for their cash.” Perhaps that is supposed to be a dig at the overly close relationship between the incoming PM and the chair of the New Zealand ANZ subsidiary, but I think it is pretty safe to say that all the chairs (and the CEs) would tell the PM that they’d pay what the law demands, not a penny more or a penny less (the approach most of us take), and if somehow they were personally inclined to be more generous, they’d no doubt find their parent boards in Sydney and Melbourne, let alone shareholders around the world, not exactly impressed at scheme to give away shareholders’ money. Such a chair might not, and probably should not, last long.
What is quite extraordinary in the whole column is that there is not even a hint (and sure there are word limits, but you can squeeze in hints about things that might really matter) that we already have one of the highest company tax rates in the advanced world, and have historically had low rates of business investment. Arbitrary extra business taxes – with not a even a hint of symmetry (windfall refunds/handouts in tough times) – are not exactly a standard feature of prescriptions for prosperity. But then in six years in government (in three of which Renney was the key adviser to the Minister of Finance), Labour showed little or no interest in lifting productivity or longer term economic performance, just in redistributing the pie differently and channelling a larger share of GDP through the government’s book, often not even funded by tax revenue. Renney’s prescription boils down to the new National-led government doing more of the same. Low as my expectations of that government are, at least on Renney’s specific schemes (lots more business taxes, lots more subsidies) I don’t worry too much.
I’m just about to head to the airport but just saw Christopher Luxon’s interview on Newshub Nation and was sufficiently riled by his treatment of the foreign buyers’ tax issue that I thought one last post was in order.
I don’t get riled that easily. When Luxon on Morning Report the other morning dismissed some views of mine as “what a load of rubbish”, some people were outraged on my behalf, but we laughed over breakfast.
But the bluster……is really just too much
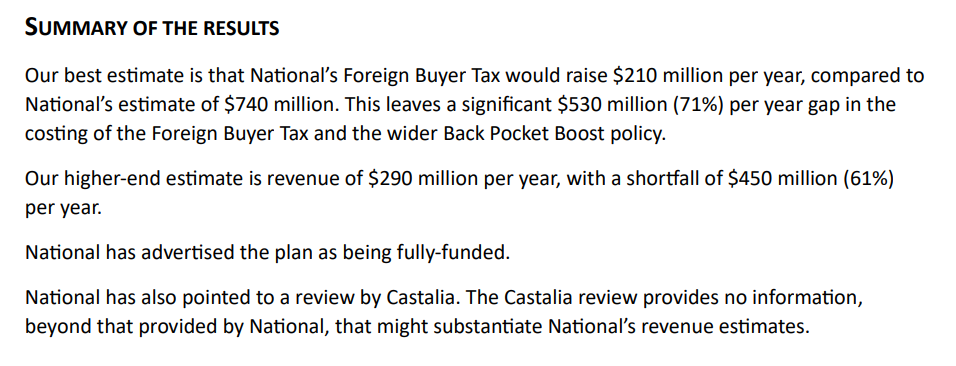
We got another round of “trust us, we are right”, repeated over and over again, but with simply nothing to back it up. We got the “we’ve published a 30 page document of costing etc” and have released the independent review we commissioned. All things he knows simply not to be so.
The 30 page document – described repeatedly by Newshub’s interviewer (a little uncharitably really) as a “marketing brochure” (heavy emphasis on the glossy photos) – is here. It is promoting the entire tax and spending plan, and is just fine for those descriptive and promotional purposes. There are 1.5 pages on the foreign buyer tax plan. The first bit is scene-setting advertorial, then there is a perfectly reasonable description of the features of the policy, then there is a glossy photo and a stylised example of a sort of person who might be motivated to buy under it. And that is all fine. What of costings? This is the text that Luxon repeatedly tries to play up with his talk of 30 page documents of costings and modelling.
For the sort of document it is, this is fine. A brief description of the broad way they went about trying to estimate numbers (in an area where there are no official estimates to use). That’s useful, but only until questions start being asked, whereupon you might think they’d be open to explaining rather more (they have added that they assume, broadly reasonably, an average sale price of $2.9m).
Then Luxon tells us they’ve had it all independently verified and have released that too. But the problem is that they haven’t. All they made available is what is described as an Executive Summary by Castalia. Perhaps there is a more substantial document behind that, but they have not released it.
In the document they have released Castalia say this
It is mildly interesting to know that Castalia agree with National’s numbers, but on its own it tells us nothing of substance, because we get no idea of their approach, no more detail on National’s, nothing beyond Luxon’s “trust us”.
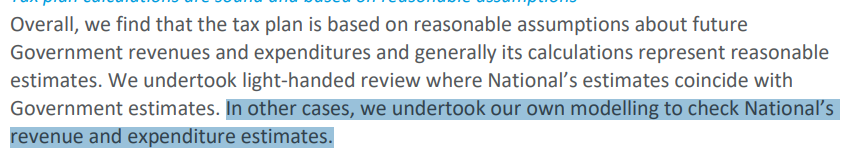
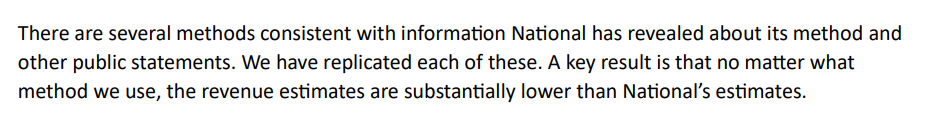
Castalia describes their general approach this way.
That is a reasonable approach in principle, and since there are no government estimates we should be led to believe they did independent modelling of foreign buyer tax revenue estimates.
Later in the same document there is a table, showing “National modelling” numbers on the left and “Castalia modelling” numbers on the right for each item in National’s plan.
For some items it makes sense that there is no difference between the two (when using government estimates). In others, they describe where and why there are differences.
What is puzzling if Castalia really did model estimates themselves for the revenue from the foreign buyers’ tax is that they came to exactly the same numbers in total and each year. Reasonable approaches to complex issues like this, with real uncertainty about behavioural responses etc, will almost inevitably come to slightly different estimates, even if they end up in much the same ballpark (eg in this case perhaps differences in how one might think of first year effects as a result of pent-up demand).
My point is not that Castalia did not honestly believe National’s numbers (I’m quite sure they did believe them to be reasonable) but to raise again the as-yet unanswered question as to just how much in-depth analysis and review went on for this specific line item. Luxon offers us nothing on that. He has released nothing more. We are just supposed to trust him.
It is quite astonishing, and particularly from a party that now avers its belief in a state Policy Costings Unit. In any such regime, any costings of policies parties actually adopted would routinely be released.
I have no idea why Luxon and Willis will not release their working, or a detailed carefully written up description of them. or why they won’t release Castalia to describe in detail what they did on this item.
But it isn’t reassuring. Not, as I’ve said repeatedly, that it matters much at macreconomically, but because it seems to say quite a lot about their likely approach to governing. Trust matters in politics and government, but trust is earned, and is reinforced by verification. It isn’t won, in functional polities, with a smile and some bluster and a refusal to provide any supporting detail, all while in interview after interview actively misrepresenting what they have done.
Anyway, our paper and my post on the wider issue is here. We’ve put our material and arguments out there.
The National Party’s “Back Pocket Boost” tax and spending plan, announced a couple of weeks ago, included a partial lifting of the foreign house buyers’ ban, to be replaced with a 15 per cent tax but only on properties selling for at least $2 million. “Foreign” here is a shorthand: the tax affects non-citizen purchasers who do not have a residence visa for New Zealand. Moreover, it does not (as the current ban does not) affect or constrain Australian or Singaporean purchasers.
My initial interest in the package was mainly macroeconomic, including noting that a fully-funded package made no inroads on the (large) fiscal deficit, and that it might actually add a bit to inflationary pressures, including because the revenue from the foreign buyers’ purchase was probably not going to be generated from New Zealand incomes and the income tax cuts were going to people with a high marginal propensity to consume. The revenue estimates from the foreign buyers’ ban seemed quite high – and are quite important to covering the costs of the package – but that seemed to be an issue other people could think about.
But as the debate began on that specific point I got interested. Initially still mainly as observer. As someone who has long been sceptical of the case for a state-funded policy costing office for political parties, I did a post observing that the political market seemed to be working: questions were being asked, experts were coming out of the woodwork, and in light of what emerged (including the party’s choice to, or not to, publish their detailed estimates) voters could reach their own conclusions. In the end, precise numbers were likely to matter less than what the whole episode told us about the group that aspires to form our government in a few weeks’ time.
But then Sam Warburton approached me about getting involved in an exercise with him and Nick Goodall of Core Logic that would attempt to use what National had described of its methods and assumptions to see (fairly mechanically) how much revenue the policy would be likely to generate, using that approach. I don’t support any political party but my inclinations tend to be more right-wing than otherwise, and Sam is fairly well to the left. But there are plenty of issues economists can generally agree on – the general disapproval of Labour’s GST policy being another – and here the issue wasn’t one of whether the tax was a good idea (I don’t think so, and would rather lift the ban altogether), but simply how much it would be likely to raise on credible assumptions. It was and is essentially a technical issue. Oh, and since I don’t approve of state-funded policy costing offices, there was a bit of a sense of obligation to do my bit.
The point of this post is not to repeat everything in the paper, which is a deliberately narrow exercise (and which seems set to have quite a bit of media coverage anyway). But I should note that both in the note, and in the discussion in this post, it is simply assumed that tax and trade treaties don’t in the end pose obstacles to implementing the tax much as National has described it. We proceed as if it can be implemented that way, leaving any treaty issues to the lawyers.
To understand what was done in the paper, we assume:
foreign purchases (over $2m) occur in the same TLAs (and old Auckland TLAs) as prior to the ban (that means disproportionately, although far from exclusively, in Auckland),
foreigners buy the same priced houses as locals (we have detailed data on the distribution of all sales by price band in each TLA),
to ease the constraints of the $2m threshold, potential foreign purchasers will routinely be willing to pay $2m for houses that would otherwise trade at anything above $1.75m.
If one were thinking in terms of risk, the 2nd bullet may understate likely sales, but the 3rd would overstate them.
Reasonable people can produce quite a range of estimates, using approaches inspired by what National has described and other possible approaches. The plausible range is at least as important as any specific numerical estimate. Accordingly, I want to take a slightly more discursive approach to the issue of how much revenue can be raised, and how best to think about it. That includes questions about how much revenue we might reasonably think the tax would raise, but also what the implications are if we are roughly right and National is wrong.
Here I would add that one of the most surprising things about this entire episode is that National has never made any attempt to send out expert surrogates of their own, who might have been willing to champion in technical detail the party’s numbers. I don’t really expect Willis or Luxon individually to be all over every modelling detail, but they should have people who are, and people who are able to tell the story behind the numbers. As it is, no one (other than National’s own claims) who has looked into the matter seems to think the tax will raise anywhere near $740 million per annum. If there were even one informed commentator championing, with a detailed story, numbers that high or higher we’d all stop and take note. But there aren’t.
Standing back, the main question we face in assessing the plausibility of National’s revenue estimates is the volume of sales that would be made to non-Australian non-Singaporean foreign buyers under the proposed policy. There is also some uncertainty around the average price those buyers would pay. National has told us they assumed $2.9 million, and whether that is right or not the average clearly cannot, by construction, be below $2 million. To raise the revenue they estimate with an average sale price of $2.9 million there would need to be 1700 sales a year.
So an appropriate starting point for analysis is the previous experience with sales of houses (transfers) to foreigners (ie non-citizens without residence visas) buyers. Statistics New Zealand publishes a reasonably extensive range of data but only back to the start of 2017.
The ban came on for sales entered into from October 2018 (settlements a bit later). Once Labour was elected in late 2017, it was clear that the ban was coming and so sales/transfers in 2018 are likely to have been somewhat inflated by people buying while they still could, bringing forward demand and sales that would otherwise have been spread over the following few years. We also have data on the (substantial) number of sales each quarter to Australian and Singaporean buyers (the total of the sales that are still happening). A reasonable base level of sales prior to the ban seems to have been about 800 a quarter of which 150 a quarter would have been to Australian and Singaporean buyers (the latter making up more than half of sales to foreigners in the single most expensive locality in the country, the Queenstown Lakes District Council area).
Of course, world population has increased since 2017, as has the stock of houses in New Zealand. So perhaps if there were no ban at all and no tax, it might be reasonable to think of a starting point now of foreign sales of a bit under 3000 a year (plus the Australian and Singaporean ones).
If that many houses were sold to non-Australian non-Singaporean buyers each year at an average price of $1.5 million (well above the average New Zealand price and above even the average Auckland house price), the tax would raise $675 million, getting close to (but still not as high as) the numbers in National’s document. (As an indication of where average sales might go at without any restrictions, a number like this seems generously consistent with Vancouver data on the price the average foreign buyer was paying relative to the average resident.)
But….remember that houses can’t be sold to these sorts of buyers for less than $2 million, and relative to a no-ban no-tax environment the cost to these buyers is higher now than it was (higher in real terms just because all New Zealand real house prices are higher than they were five years, but more specifically higher because of the 15 per cent tax). One large group of people who might otherwise buy are still simply banned while the others face a fairly heavy tax.
There are two big uncertainties in getting from, say, 2017’s position for the number of non-Australian and non-Singaporean buyers to the regime National proposes.
The first is that there is no hard data on what prices those foreign buyers were paying before the ban. And for all the talk of high-priced Queenstown, we know there were more foreign sales in Christchurch (cheapest main centre in the country) than in Queenstown pre-ban, and about as many in each of Hamilton or Wellington as in Queenstown. Even Auckland is a very diverse place, and far from all the sales were in Devenport, Waiheke, or Epsom/Remuera. It isn’t likely removal of the ban on houses over $2m will reawaken effective foreign demand in Otara or Mangere. Pre-2018 buyers were themselves a diverse bunch.
And the second substantive uncertainty is how responsive demand in that over $2m price range will be to the higher prices the tax now imposes. People buying, say, a $2.5 million house in Epsom aren’t poor by any means, but they probably also aren’t money-no-object people either (and recall that the tax doesn’t apply to people living here permanently but to those without residence visas). These aren’t all, or even mostly, billionaires.
I’m not aware of any country that has put a price-threshold based tax on foreign buyers. But in their policy document National cites the experiences in Canada, where both Vancouver and Toronto had for a time a 15 per cent tax on foreign buyers (similar definition to New Zealand) but on all houses. Canada has a similarly encouraging immigration policy to New Zealand, and Vancouver in particular has an (apparently well-earned) reputation as a magnet for Chinese purchases of real estate. In both places reports indicate that the imposition of the tax substantially reduced foreign purchases (demand responded to the increased price the tax imposed). One formal paper I read estimated a 30 per cent reduction in demand. Other suggest perhaps a 40 per cent reduction. Our paper I linked to above deliberately does not attempt to include an estimate of this demand effect.
What do we know of the revenue these taxes generated in Canada? I’ve only been able to find scattered reports regarding Toronto – a city 20%+ larger in population than New Zealand – but what I have seen suggests revenue estimates from the 15 per cent tax rate on all foreign purchases and at all price points was around C$200m per annum (about NZ$250m). Toronto has very high house prices (and price to income ratios).
What of Vancouver? There I found references to official British Columbia revenue numbers (in this think-tank note). The tax was initially set at 15 per cent and then raised to 20 per cent in 2018,
and
C$180 million per annum (NZ$220m) looks to be a reasonable pick for a 15 per cent tax. And if metro Vancouver has only about half New Zealand’s population (a) their tax applied to all nationalities and all price points (on both points unlike National’s proposal), and (b) Vancouver has historically been more of a magnet for Chinese purchases that most other cities internationally (including Auckland).
If I had just arrived from Mars – or were an Opposition leader without the benefit of The Treasury wanting to do a reasonableness check on my team’s numbers – I guess I’d look around at various revenue estimates locally and try to triangulate them against what I could find about other countries’ actual experiences (remembering that places typically put these taxes on primarily to deter demand not to raise revenue). Perhaps such a tax raises quite a lot more than $200m or so in a normal year, but it wouldn’t be my first guess. I’d be a bit troubled if no estimate – not one – was in excess of my own team’s number.
Now here it is worth noting a couple of caveats that could help with revenue raising (and one working in the opposite direction). If house prices take off again I guess it would only be a few years until the average (not median) house price in Auckland was $2m. If so, a lot more potential buyers would be eligible, but….the government responsible might have other problems and concerns.
More seriously, it probably is reasonable to expect that in the first year of the new policy quite a lot more revenue would be raised. There probably is some pent-up demand, perhaps especially at the very top end of the market. But even if one doubled the first year’s revenue estimates, it doesn’t make much difference to the four-year view. The year in year out shortfall would still be substantial.
Note, however, that some of these foreign buyer tax regimes have provided a refund of the tax if the purchaser later establishes residence. That is not a feature of National’s tax policy so should not affect the current costings, but it is an issue to be aware of if the policy moved to being legislated
On the best estimate in the paper the annual revenue shortfall is $530m. That would also be consistent with the scale of revenue that appears suggested by the Toronto and Vancouver experiences. But the gap could be smaller: a $400m shortfall isn’t impossible given the inevitable uncertainties in the modelling and likely experiences. But a shortfall of $400-500 million per annum is a touch more than 0.1 per cent of annual GDP. This year’s deficit forecast in yesterday’s PREFU was 2.7 per cent of GDP, and that too is only a point estimate within a (not formally specified) range. 0.1 per cent of GDP is simply not macroeconomically significant. That is so in respect of fiscal policy, but it is also true of monetary policy. In fact, on its own the revenue shortfall would make little or no difference to monetary policy because as I’ve pointed out previously – although National continues to resist the claim – the revenue wasn’t mostly going to be coming out of what would otherwise be local demand anyway.
One could add – and I will because I have repeatedly made this point about policy costings offices – that no poll at present suggests that the National alone will have a majority in the next Parliament. Under MMP in particular, manifesto promises (especially detailed ones) are mainly signals of opening bids in the negotiations to form a government or settle on a legislative programme. If National wins, actual details are near-certain to be at least somewhat different from what was in the Back Pocket Boost package.
That doesn’t mean this is all a big fuss about nothing. First, the signalling matters. When the fiscal deficit as it as large as it is, a major political party promising tax cuts really should be able to convincingly suggest to the public that the cost will be fully covered and that if their programme was adopted it would not worsen the already-large deficit. National’s package does not pass that test at present.
And, more generally, how they handle episodes like this provides us as voters with information about the people who want to run the government in a few weeks’ time. An assured performance enhances credibility. Otherwise, not so much. An assured performance might have meant there were no major questions about any costings at all (at least from anyone other than cast-iron partisans) even in a high- profile package. It might also have meant that if/when questions started arising, you’d be able to release some enlightening report from the consultants you hired to check your workings, or you might release your own workings – or a nicely written up version – yourself, or got some well-informed surrogates to tell your story. Your leader might even have persuasive lines to assuage doubts. In this episode none of that has happened, and it has been anything but reassuring about just how much on top of their game, ensuring detailed stuff is done well Luxon, Willis, and their key staff advisers really are. It may also speak to their instinctive response under pressure: openness and engagement or hunkering down defensively. Probably hardly anyone is going to change their vote on this one specific (perhaps they shouldn’t – lots of things matter more), but that isn’t the test of whether these things matter. They do.
I haven’t mentioned Castalia’s role in all this. In my first post on the package I pretty much took for granted that I’d be able to count on that. But as our joint report notes, and having seen the [Executive Summary of the] Castalia report, it offered no basis for any reassurance at all on the foreign buyers’ tax revenue estimates. It explained neither what National had done nor indicated what robustness checks Castalia had made. In fact, the single half-sentence reference to the tax has a distinctly “last minute add-on” feel to it. One would hope it was not so. RNZ reports this morning that Castalia is standing by their review, but we simply don’t know what that review consisted of, so that assurance adds barely any useful information.
In closing I am going to repeat my opposition to a state-funded policy costings office. It is up to parties themselves to decide what work they get done on policies and what material they release, when and how. In this case, the existing system is working, putting a spotlight on National and their estimates and giving them choices about how they respond and us information that we can use in forming our views of the party and its leaders. Is it messy? Yes. Is the substance a second-order issue? In many respects, yes. But much of politics, and much of life, is like that, even if technocrats would generally prefer it was otherwise.
As for the issue at hand, whichever way you look at the numbers it is hard – but not impossible – to see the policy raising much more than $200m a year, and not at all that hard – but not perhaps likely – to see it raising less.
UPDATE 16/9
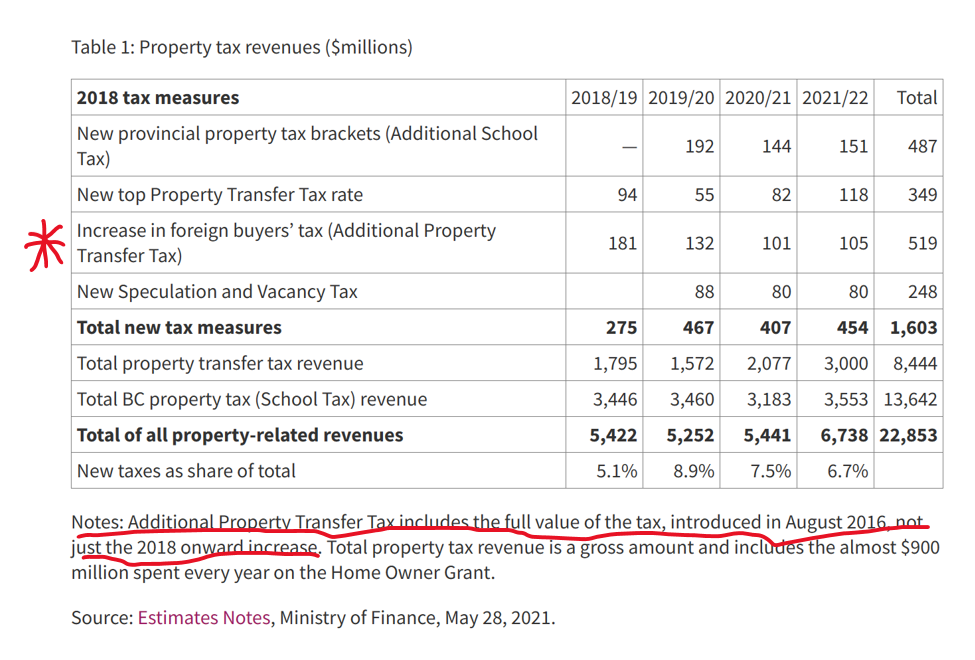
In the body of the post I used a Canadian think tank’s report on the Vancouver experience. That report quoted British Columbia Ministry of Finance revenue numbers, but I had not then got back to the source document. This table is from p321 in the PDF at that link.
Note that the parameters of the British Columbia interventions have changed repeatedly. They started with a 15% tax in Vancouver in (a surprise move in) 2016, and in 2018 both raised the rate to 20% but also extended the coverage to include some other areas including greater Victoria (another 400K people on top of Vancouver’s 2.6m). And from the following year’s Estimates Notes
Note that under the British Columbia tax rules you can receive a refund if you become a resident of Canada within a year of purchase. The data I have do not break about the scale ($m) of these rebates, but the gross revenue figures may be a bit higher than those shown in the Ministry of Finance table above.
Finally, on another aspect, this snippet is from the bit of the Castalia review that National has provided to some outlets (one of which gave it to us).
As an approach that seems fine. There are, however, no government estimates for the revenue impact of the foreign buyers’ tax.
Later in the same document there is a table, showing “National modelling” numbers on the left and “Castalia modelling” numbers on the right.
For some items it makes sense that there is no difference (when using government estimates). In others, they describe where and why there are differences.
What is puzzling if Castalia really did model estimates themselves for the revenue from the foreign buyers’ tax is that they came to exactly the same numbers in total and each year. Reasonable approaches will almost inevitably come to slightly different estimates even if they end up in much the same ballpark (eg in this case perhaps differences in how one might think of first year effects as a result of pent-up demand).
My point is not that Castalia did not honestly believe National’s numbers (I’m quite sure they did believe them to be reasonable) but to raise again the as-yet unanswered question as to just how much in-depth analysis and review went on for this specific line item.
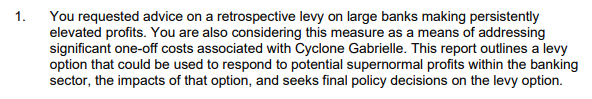
I’ve been reading the papers released the other day by Treasury (in one case written jointly with IRD) on the Minister of Finance’s hankering to tax Australian banks more heavily, retrospectively.
The 10 February paper is titled “Windfall gains in the New Zealand banking sector, and responses”, apparently part of something called “Project Cricket”. Retrospective taxes targeted at companies the Minister of Finance doesn’t like and are just considered politically ripe for the plucking are…..really not cricket. But perhaps that irony escaped both the authors and the Minister. The paper is signed by Treasury’s Manager, Tax Strategy, and as tends to be the way with Treasury, when one looks him up he seemed to have no background at all in tax (or banking), and little in New Zealand either. It wasn’t a promising start.
It is a fairly long paper (24 pages)
The Minister already had his enemies in sight but wanted a fishing expedition as well.
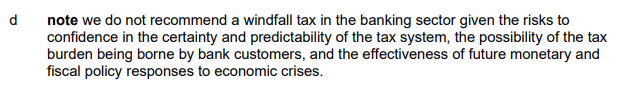
The Treasury paper wasn’t a very compelling piece of work. Without any serious analytical framework at all, it (slightly grudgingly, or perhaps just diplomatically) concludes “there is no clear evidence that banks made windfall profits during the recovery from COVID-19”. And instead of concluding strongly that since there is not the slightest evidence of anything that could seriously be called “windfall profits” and thus there was no serious analytical case at all for anything like a “windfall profits tax”, we just get this lame conclusion
as if otherwise it would okay.
As for those other sectors
All based on this
Quite how the agricultural sector “may have derived windfall gains” is left to the reader (and us) to guess. It all seems very loose and incoherent stuff. (Had one been interested in regulatorily-induced windfall profits, surely one place to look might have been the supermarkets that were given a monopoly position during Covid lockdowns at the expense of other food retailers, but….lets not encourage them.)
So lacking in any serious analytical framework is the discussion around “windfall profits” that Treasury apparently never thinks to point out that an unexpected burst of inflation (perhaps a 10 per cent change in the price level, engineered – albeit inadvertently – by the government’s own central bank), came closest to a true set of windfall gains and losses. Who gained – entirely unexpectedly? Why, that would be people with long-term fixed rate debt. And which party has the most long-term fixed rate debt on issue? Why, that would be the government itself. On the other hand, holders of fixed rate financial instruments were subject to fairly marked, close to genuinely “windfall”, losses.
I mentioned there windfall losses. That is more than the Treasury (or Treasury/IRD) advice ever does. Over time, true windfalls, such as they are, are pretty randomly distributed – gains, losses, sectors, individuals. But of course there was no sense here of a coherent or comprehensive approach to the issue, some systematic search for windfalls across the economy that the government might tax (or compensate). No, the MInister had his four Australian banks in target. With not the slightest evidence – even with Treasury doing what it could to try to find it for him – that there was anything that anyone other than the Green Party could seriously consider “windfall profits”.
And in this first paper, officials didn’t even think to point out that retrospective legislation of any sort – but perhaps particular one targeted at four of the king’s (or his Minister of Finance’s) enemies is generally pretty abhorrent. If anything, they seemed to quite like the idea of a retrospective tax (check the table on p15 of the release). On whatever strange definition of “coherence” these officials were using a retrospective tax aimed by four companies, when the advice said there was no serious evidence of windfall profits, also apparently raised no concerns.
(In passing, I would note that the Treasury is quite open in calling the Reserve Bank’s Funding for Lending programme a direct “subsidy” to banks. That is, perhaps unsurprisingly, not language the Reserve Bank has used. But as Treasury notes, there does seem to have been reasonable evidence that the subsidy – put in place as a conscious matter of policy – had mostly been passed on the customers.)
Somewhat surprisingly, when providing the Minister with advice on a tax that would be targeted at four specific Australian-owned companies, there is no discussion at all of the likely reaction of the companies’ owner, or of their government, or of whether and how such an arbitrary tax might raise difficulties in the trans-Tasman halls of financial regulators. Oddly, in all three papers there was not a single mention of the fact that the parents of these four wholly-owned companies also had active operating branches in New Zealand, and what (if any) implications there might be for the future mix between branch and subsidiary business.
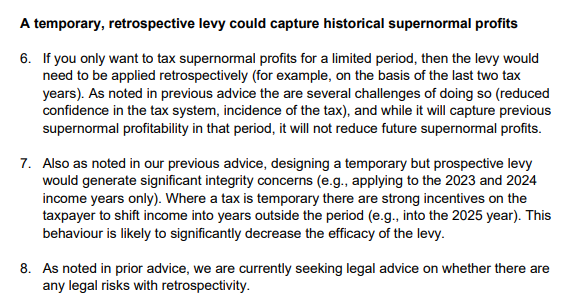
Despite Treasury’s recommendation in that 10 February paper, the Minister of Finance must have disagreed. The 17 February aide memoire ( 2 pages only) sets out briefly options that could be done for the Budget, then only three months away. They were retrospective and prospective levies. This was what they had to say about the former
There seems to be no sense that this would be something of a constitutional outrage. Sure, they say they were checking whether there were legal risks (perhaps anything in CER?), but as they and the Minister know Parliament in New Zealand is sovereign and the government easily has 61 votes for budget legislation.
This paper was for a meeting with the Minister on 20 February. The Minister was apparently undeterred.
The final paper in this suite is joint Treasury/IRD report of 10 March (also referring to “Project Cricket”). The introduction to that paper’s Executive Summary illustrates just how far off the rails the Minister was heading.
It was bad enough that the Minister was seriously considering a retrospective tax restricted to four foreign companies he didn’t like, in the face of official advice that there was no evidence of anything seriously akin to “windfall profits”, but now he was proposing such an arbitrary tax-grab specifically to help cover a cost pressure elsewhere in his budget which had nothing whatever to do with the four companies he wanted to tax or any of their activities. One hopes that privately officials were well and truly rolling their eyes by this point.
One might acknowledge that this advice – or perhaps another captain’s call from Hipkins – finally brought this work stream to a halt, but it simply wasn’t very good advice (at least based on what the government has chosen to release). Mightn’t one, for example, have expected some serious reference to a likely Australian reaction? Mightn’t one have expected some serious discussion of the precedent such an arbitrary tax might establish (actual or perceptions)? There is some reference to it – amid a weird sentence that talks about “the favourable position of New Zealand as an investment destination” – on what metric one might ask? – but it is all very muted. There is no discussion at all of the intellectual incoherence of picking on individual profitable firms ministers don’t like and not (say) responding symmetrically when unexpected sharp falls in profits happen (perhaps officials thought it not worth dignifying this nonsense on stilts?). There is no mention of the branches, or anything serious on the possible reduction in the availability of debt finance to New Zealand households and small and medium businesses (really big businesses can finance globally). We even find abstract comments, no doubt tantalising to the Minister, that “in theory, a one-off retrospective tax will not affect behaviour”. That sort of line might be fine from a traineee analyst fresh out of a basic university course, but this was serious budget advice from responsible Treasury and IRD officials
In what they published (perhaps it was in what was withheld, though there is no obvious reason to withhold_, there is also no reference at all to the New Zealand legislation guidelines, which state
Pretty sure the Minister not liking four particular foreign companies isn’t one of those “limited circumstances” in the final bullet.
What was proposed was an abomination, but – even though they didn’t favour what the Minister was hankering for – you get little sense of that in The Treasury/IRD advice. I’ve seen people responding “ah well, didn’t matter, as he didn’t go ahead”. Donald Trump didn’t go ahead with most of his mad, bad, or evil schemes either, but that is slim consolation. We should expect better from someone who has been New Zealand’s Minister of Finance for 5.5 years.
But at this point the advice gets a whole lot worse, losing all touch with reality and descending into some spirit world of officials’ imagining. I’m including the entire section
One wonders if officials are able to opt out of this nonsense on grounds that no one should be forced to practice someone else’s religion. Do other worldviews count? I guess not, at least if this advice is to be taken seriously.
Or which of “our Treaty partners” were consulted on this highly sensitive matter of tax policy, even in a not very material way?
Or look at that footnote 87: a retrospective tax grab from four named foreign companies for purposes unrelated to anything to do with the activities of those companies would apparently “strengthen” “the human domain” (whatever that means). I suppose it would indeed have played to the “concept of power” – power in an arbitrary retrospective way, much more akin to an abusive act of attainder than anything. People would then have known the Minister (and his ministerial colleagues with him) as an unconstitutional thug.
In the end, Robertson didn’t proceed with his egregious scheme and for that small mercy we should be grateful. But we now know that ideas of such egregious grabs do play in his mind – not just an idle fancy, but weeks of work – and who knows when they might return, or which other company or individuals might then be in his sights. It wasn’t exactly Treasury at its best either.
It must be relatively unusual for a political party in office to change tax law, and provide extra budget funding, to enable research to be done towards that party’s next campaign manifesto. But such it appears to be with the High-wealth Individuals research project, the report on which was released yesterday, loudly championed by the Minister of Revenue, David Parker. Not many government department research papers – and that, we are told, is all it is – get a Foreword from a senior Cabinet minister.
Whether or not there was a strong case for doing the research in the first place using the coercive powers of the state, and whether there is – in the broad – anything very surprising in the report (I don’t think I’ve yet seen/heard anything), no doubt there will interesting tables and charts that flesh out our understanding of the selected facts at least a little.
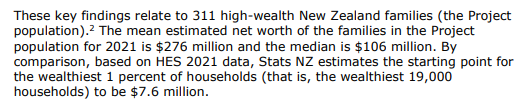
Perhaps the first snippet worth paying attention to is this
That is quite a lot of money in total – measured, by chance, at the very peak of a huge asset price boom – but what struck me was that only 155 families had estimated net worth in excess of $106 million. Quite possibly no readers of this blog fit that category, but in the grand scheme of global wealth NZ$106 million (measured at the peak of an asset boom) was if anything less than I might have expected.(By contrast, at his talk yesterday Parker told us he’d asked some of his rich mates to guess what the average number would be and none had gone for a high enough number).
Perhaps not unrelatedly, it is worth remembering that we don’t tax families, we tax individuals, and most of the families studied in this report included two spouses/partners. The median individual wealth is going to have been quite a bit lower than $106 million.
All of which seems consistent with the fact that the New Zealand economy has not exactly been a staggering success in recent decades. Setting the tax debate to one side for the moment, in a successful economy one might have hoped that there would be many more really wealthy families, at least if that wealth had arisen from the creation and development of new businesses/products. Few begrudge Bill Gates the wealth created via Microsoft.
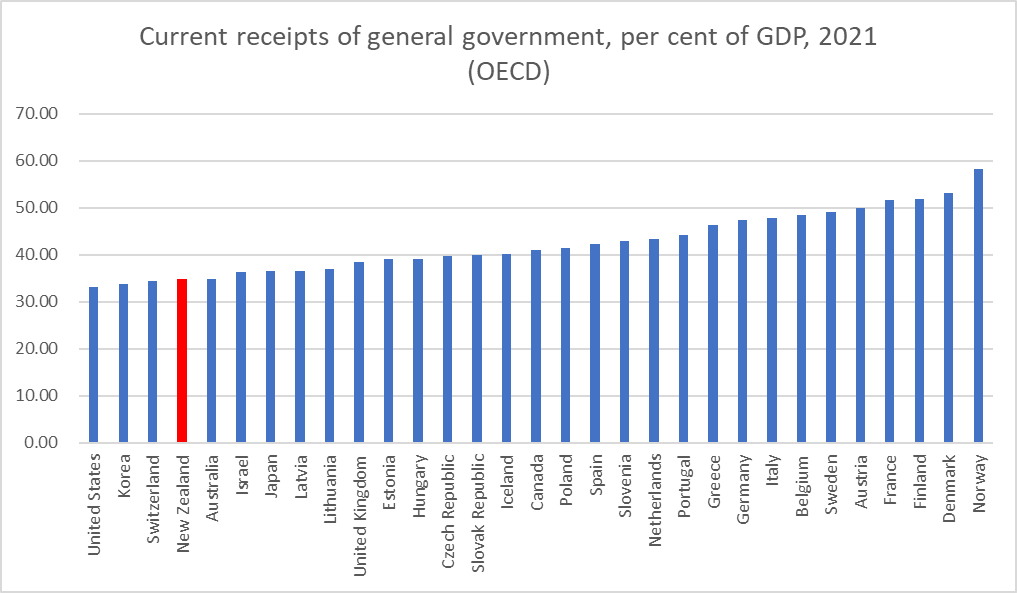
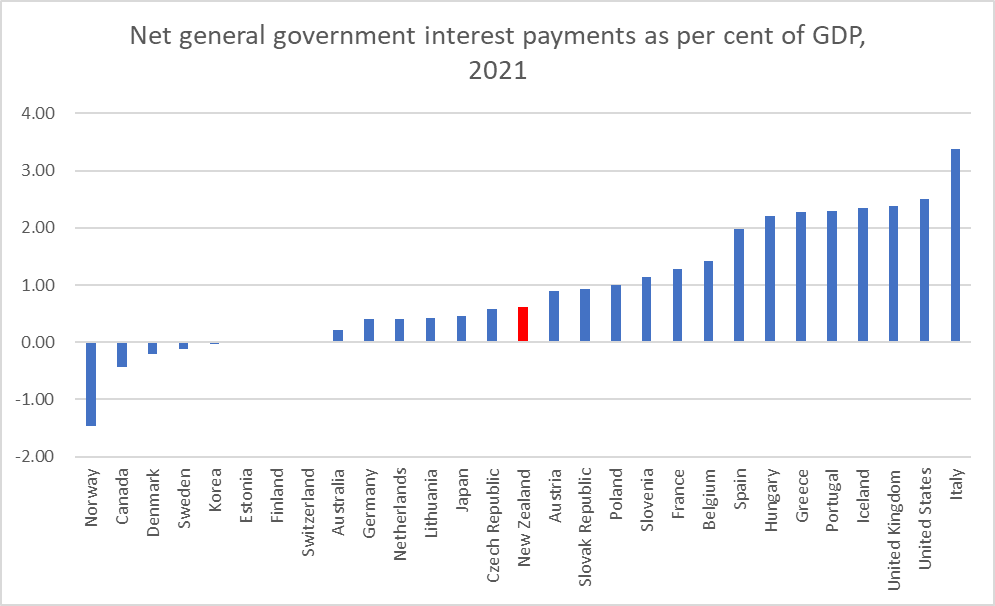
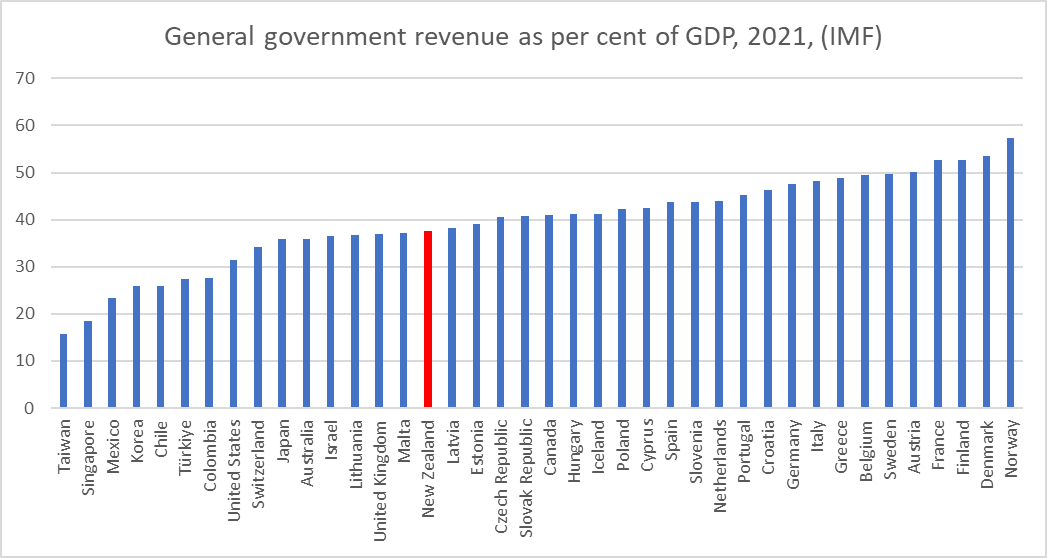
But there is some important stuff that wasn’t in the report, or in the political framing of it. Thus, David Parker made much of the poor put-upon wage and salary earner who pays tax on every dollar of earnings, in contrast to the 300 rich families. It was all such an evidently unfair system we were told.
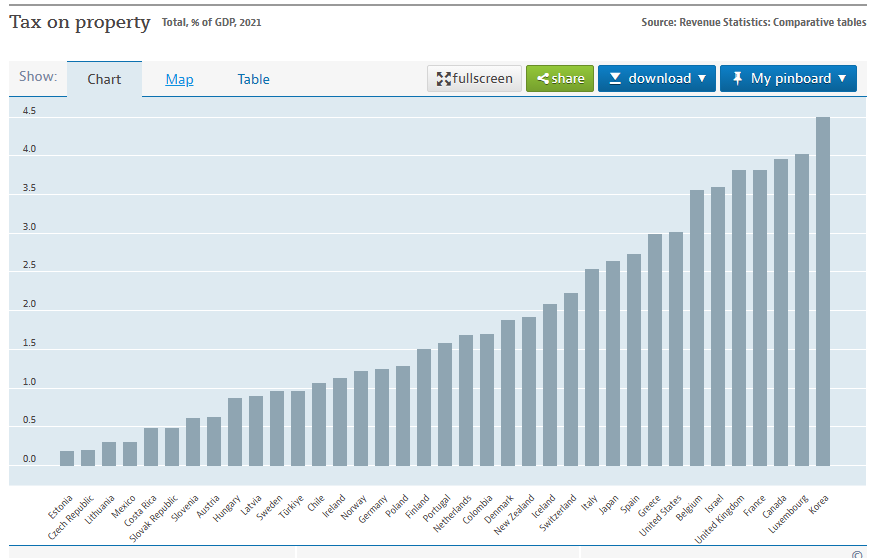
There were some comparative OECD charts in the minister’s presentation. These two weren’t among them
Tax on property – as a share of GDP a bit above the OECD median – is defined here as
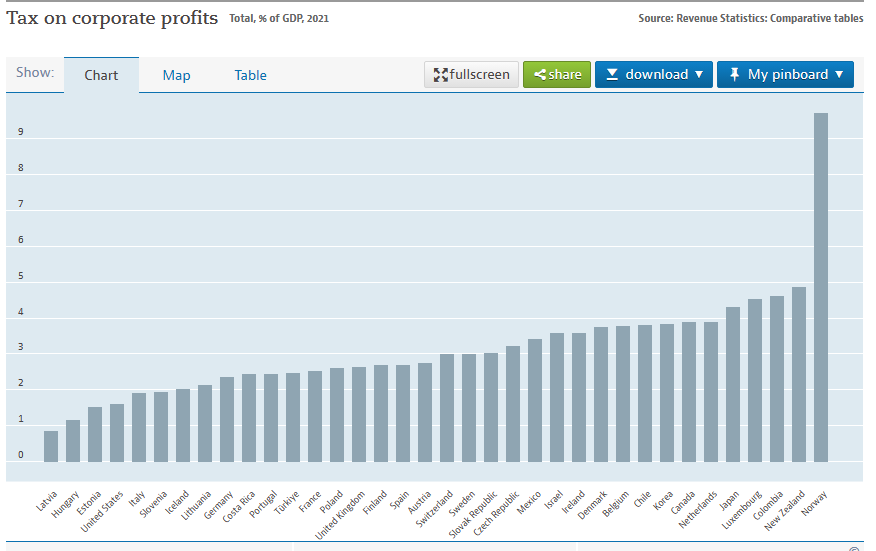
This chart was also missing (NZ second from the right). It includes any tax levied on business capital gains.
And, of course, in the minister’s framing there was no mention of the fact that New Zealand over the decades has had relatively low rates of investment (relative to OECD averages for countries with our sort of population growth) in land development, in building new houses, and in business investment more generally. What one aspires to have more of one generally should not seek to tax more heavily. And IRD even seems to recognise in the report that what one taxes more heavily one will get less of, noting in the Summary
For the Project population, much of their income is derived from business entities that they control. Failing to tax forms of income that are earned predominantly by those who are better off …… is also likely to impose other economic costs through influencing the pattern of investment in the economy.
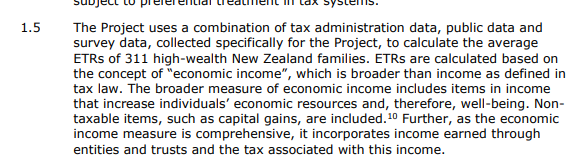
The IRD is keen to assert that what they are doing in this study is measuring “economic income”, in their own words “items…that increase individuals’ economic resources and, therefore, well-being”
In principle that is fine. I have no problem with the notion that unrealised real capital gains add to the economic resources and future purchasing power of the owner (whether or not those gains should be taxed is quite another question). But increases in asset values that simply keep pace with general inflation do not add to future real purchasing power and are in no meaningful economic sense (including the Haig-Simons approach IRD is fond of) economic income. We don’t have an inflation-indexed tax system at present, but the point of this study was not to describe the current system, but to use analytical tools to get a sense of real gains to purchasing power.
Now, most capital gains in the period under study were well in excess of the general CPI inflation rate, and inflation itself was relatively modest (but inflation cumulates, and even 2 per cent per annum inflation is about 22 per cent in total over a decade), so adjusting for inflation – which could relatively easily have been done – might not have changed many of the headline-grabbing numbers very much. But it was just knowingly dishonest of IRD not to have made the adjustment and to have presented as real income what no economist will regard as real income. But it will have suited their political masters (and perhaps reflected their longstanding institutional unease with an indexed tax system). And, as readers will be well aware, inflation will have made a great deal bigger difference to the numbers for 2022 and 2023.
David Parker’s approach to tax is – perhaps in line with prevailing New Zealand orthodoxy in recent decades – that all forms of real economic income should be taxed alike (at his talk yesterday he even seemed attracted to a capital gains tax on unrealised gains, something I’m not aware that any country does on any sort of comprehensive basis). If you believe in that approach, I guess yesterday’s research results will be troubling (or grist to your political mill).
I don’t, and to the extent it matters (if one cares about productivity and wider economic performance over time) generally economic theory tends not to back such an approach either. Not only do I think there is a good case for taxing returns to labour much more heavily than returns on capital (one example of my advocacy is here) but there is also a good case for a consumption-focused approach to tax (tax people on what they spend not on what they produce/earn, ideally through a progressive system). Frame your research in terms of tax as a percentage of “economic income” and you will get one set of answers, but frame it as a percentage of consumption and you will get quite another. If I was looking for a “tax switch” in New Zealand – David Parker implied that he was, rather than looking to increase total revenue – I’d be looking to substantially reduce New Zealand’s ranking on that taxation on corporate income chart above (and yes, I do know about dividend imputation, so this isn’t a statement of detail but of direction – but more foreign investment, and foreign investors are most affected by NZ company tax rates, would generally be a good thing).
For all that, I am not one of those who is adamantly opposed to a capital gains tax in principle. It wouldn’t affect me personally, I don’t mix in the circles of the 300, and I fully accept that there are elements of a “fairness” argument to be had. I’m certainly not someone who would change my vote on the matter. In general, I summarise my CGT position as one of profound ambivalence. One could be put in place, but a well-designed and politically realistic one would not raise much revenue over time, all while adding to the structural procyclicality risks around fiscal policy (sucking in most revenue when revenue is abundant and drying up almost completely when times are tough and other revenue is depleted). And since most of the political angst around capital gains in New Zealand is not about the likes of Bill Gates (or Rod Drury) but about escalating land values, those issues could – and should – be dealt with directly by systematically freeing up land usage and collapsing the artificial scarcity central and local government restrictions have created. As it happens, in this government the minister of land use rules in also the Minister of Revenue, but does one hear David Parker advocating policies that would collapse peripheral urban land prices to the best alternative agricultural use price? No, he (and opposition parties) will run a mile for the very idea) and experts tell us that the legislation he is now piloting through the House may actually worsen the situation. The rigged land market is scandalous, a true moral evil. But governments refuse to fix that.
And then there is the political conundrum. Most real-world CGTs emphasise realised gains, but if you do that then the people you hit are the asset holders most likely to be forced to sell at some point. As Parker himself recognised, the richer you are – and the bigger vehicles you hold your wealth in – the more likely you are to be able to defer a CGT almost indefinitely. In his younger days, Adrian Orr used to regale us with tales of mates of his who were firemen (or the like) with a couple of investment properties. A realisations-based CGT – actually like the extended brightline test – will catch them, but it will bear much less heavily on Parker’s 300 families.
Perhaps that means Parker will be trying to get his Labour colleagues to run with a wealth tax or death or inheritance taxes. They don’t have the particular problems that go with a CGT, but they have others (personally, I have no real problem with a moderate inheritance tax with fairly high thresholds, but I’d be really surprised if such a tax were to raise much money – although perhaps for advocates the revenue would not be the point).
Rather than run through afresh all the issues around good CGTs – loss-offsetting, double-taxation, efficient markets approaches to asset pricing etc – I’m going to end by cutting and pasting from a 2017 post, which I also used when the TWG reported in 2019.
Rather the block quote it, all that follows to the end of this post is direct from that 2017 post:
Going through some old papers to refresh my memory on capital gains tax (CGT) debates, I found reference to a note I’d written back in 2011 headed “A Capital Gains Tax for New Zealand: Ten reasons to be sceptical”. Unfortunately, I couldn’t find the note itself, so you won’t get all 10 reasons today. But here are some of the reasons why I’m sceptical of the sort of real world CGTs that could follow from this year’s election. Mostly, repeated calls for CGTs – whether from political parties, or from bodies like the IMF and OECD – seem to be about some misplaced rhetorical sense of “fairness” or are cover for a failure to confront and deal directly with the real problems in the regulation of the housing and urban land markets.
Anyway, here are some of the points I make:
in a well-functioning efficient market, there are typically no real (ie inflation adjusted) expected capital gains. An individual participant might expect an asset price to rise for some reason, but that participant will be balanced by others expecting it to fall. If it were not so then, typically, the price would already have adjusted. In well-functioning markets, there aren’t free lunches. It also means that, on average, capital losses will be pretty common too, and thus a tax system that treated capital gains and losses symmetrically wouldn’t raise much money on average over time. A CGT is no magic money tree. And there is no strong efficiency argument for taxing windfalls.
if you thought, for some reason, that people were inefficiently reluctant to take risk, there might be some argument for a properly symmetrical CGT. In such a system, the government would take, say, a third of your gains, but would also remit a third of your losses (the overall risks being pooled by the state). The variance of an individual’s private after-tax returns would be reduced, and they might be more willing to take risk. But, in fact, no CGT system I’m aware of is properly symmetrical – there are typically tough restrictions on claiming refunds in respect of capital losses (one might only be able to do so by offsetting them against future gains). There are some reasonable base-protection arguments for these restrictions, but they undermine the case for a CGT itself.
All real world CGTs are based on realised gains (and losses to an extent). That makes it not a pure CGT, but in significant part a turnover tax – if you never trade, you never pay (“never” isn’t literal, but tax deferred for decades discounts to a very small present value). And that creates lock-in problems, where people are very reluctant to sell, even if their circumstances change or if a new potential owner could make much more of the asset, for fear of crystallising a CGT liability. In other words, introducing a CGT introduces a new inefficiency to asset markets, making it less likely that over time assets will be owned by the parties best able to utilise them.
Basing a CGT on realised gains will also, over time, bias the ownership of assets subject to CGT to those most able to avoid realising the gains. A long-lived pension fund, or even a very wealthy family, will typically be better able to count on not having to sell than, say, an individual starting out with one or two rental properties, or some other small business, where changed circumstances (eg a recesssion or a divorce) might compel early liquidation. Large funds are also typically better able to take advantage of loss-offsetting provisions. The democratisation of finance and asset holding it certainly isn’t.
CGTs in many countries exclude “the family home” altogether. In other countries, they provide “rollover relief”, enabling any tax liability to be deferred. Most advocates of a CGT here seem to favour the exclusion of the family home, even though unleveraged owners of family homes already have the most favourable tax treatment in our system. Again, a CGT applied to investment properties but not owner-occupied ones would simply trade one (possible) distortion for another.
In practice, most of the arguments made for a CGT in New Zealand have to do with the housing market. But, on the one hand, all major (and minor?) parties claim that they have the fix for the housing market (various combinations of RMA reform, infrastructure reforms, changes to immigration, restrictions on foreign ownership, state building programmes or whatever). If they are right, there is no reason to expect significant systematic real capital gains in houses. If anything, real house prices should be falling – a long way, for a long time. Of course, prices in some localities might still rise at some point, if unexpected new opportunities appear. But “unexpected” is the operative word. Enthusiasm for a CGT, at least at a political level, seems to involve a concession that the parties don’t believe, or aren’t really serious about their housing reform policies.
Oh, and no one I’m aware of anywhere argues that a realisation-based CGT applied to (a minority of) housing has made any very material difference to the level of house prices, or indeed to cycles in house prices.
In general, capital gains taxes amount to double-taxation. Think of a business or a farm. If the owner makes a success of the business, or product selling prices improve, expected profits will increase. If and when those profits are achieved, they would, in the normal course of affairs, be subject to income tax. The value of the business is the discounted value of the expected future profits. It will rise when the expected profits rise. Tax that gain and you will be taxing twice the same increase in profits – only with a CGT you tax it before it has even happened. Of course, at least in principle, there is a double deduction for losses, but as noted above utilising losses (whether of income, or capital) is a lot more difficult. If you think that New Zealand has had less business investment than might, in some sense, have been desirable, you might want to be cautious about applauding a new tax that would fall heavily on those who took business risks and succeeded.
Perhaps double taxation of expected business profits doesn’t bother you. But trying reasoning by analogy with wages. If the market value of your particular skills has gone up, your wages would be expected to rise. When they do you will pay taxes on those higher wages. But by the logic of a CGT, we should capitalise the value of your expected future labour income and tax your on both that “capital gain” and on the later actual earnings. Fortunately, we abolished slavery long ago, but in principle the two cases aren’t much different: if there is a case for a CGT on the value of a business, it isn’t obvious why one shouldn’t have one on the value of a person’s human capital.
(I should note here, for the purists, that there are other concepts of double-taxation often referred to in tax literature, none of which invalidate the point I’m making here.)
Real world CGTs also tend to complicate fiscal management? Why? Because CGT revenue tends to peak when asset markets and the economy are doing well, and when other government revenue sources are performing well. CGT revenue doesn’t increase a little as the economy improves and asset markets increase, it increases multiplicatively. And then dries up almost completely. Think of a simple example in which real asset prices had been increasing at 1 per cent per annum, and then some shock boost asset prices by 10 per cent. CGT revenue might easily rise by 100 per cent in that year (setting aside issues around the timing of realisations). And then in a period of falling asset prices there will be almost no CGT revenue at all. Strongly pro-cyclical revenue sources create serious fiscal management problems, because in the good times they create a pot of money that invites politicians to (compete to) spend it. If asset booms run for several years, politicians start to treat the revenue gains as permanent, and increase spending accordingly. And if/when asset markets correct – often associated with recession and downturns in other revenue sources- the drying up of CGT revenue increases the pressure on the budget in already tough times. It is easy to talk about ringfencing such revenue (mentally, if not legally) but such devices rarely seem to work.
None of this means that I think there is no case for changes in elements of our tax system as they affect housing. The ability for business borrowers to deduct the full amount of nominal interest, even though a significant portion of that interest is simply compensation for inflation (rather than a real cost), is a systematic bias. It doesn’t really benefit new buyers of investment properties (the benefit is, in principle, already priced into the market) but it is a systematic distortion for which there is no good economic justification Inflation-indexing key elements of our tax system is highly desirable – at least if we can’t prudently lower the medium-term inflation target – and might be a good topic for a tax working group. In the process, it would also ease the tax burden on people reliant on fixed interest earnings (much of which is also just inflation compensation, not a real income).
Of course, at the same time it would be desirable to look again at a couple of systematic distortions that work against owners of investment properties. Houses are normal goods and (physically) depreciate. And yet depreciation is no longer deductible. Perhaps there was a half-defensible case for that when prices were rising seemingly inexorably – but even then most of the increase was in land value, not in value of the structures on the land – but there is no justification if land reform and (eg) new state building is going to fix the housing market. Similarly, when the PIE system was introduced a decade or so ago, it gave systematic tax advantages to entities with 20 or more unrelated investors. Most New Zealand rental properties historically haven’t been held in such entities. There is no good economic justification for this distinction, which in practice both puts residential investment at a relative tax disadvantage as a saving option, and creates a bias towards institutional vehicles for holding such assets. Institutional vehicles have their own fundamental advantages – greater opportunities for diversification and liquidity – but it isn’t obvious why the tax system should be skewing people towards such vehicles rather than self–managed options. As noted above, any CGT will only reinforce that bias. Funds managers, and associated lawyers and accountants, would welcome that. It isn’t obvious why New Zealand savers should do so.
I see that there are more than 10 bullet points in the list above. I’m not sure it covers all the issues I raised in my paper a few years ago, but it is enough to be going on with.
And in all this in a country where we systematically over-tax capital income already. I commend to readers a comment on yesterday’s tax post by Andrew Coleman, of Otago University (and formerly Treasury). As Andrew noted:
“Somehow, New Zealand’s policy advising community decided it would restrict most of its attention to the ways income tax could be perfected rather than question whether income taxes (which are particularly distortionary when applied to capital incomes) should be replaced by other taxes. It is almost as if we have the Stockholm Tax Syndrome – fallen in love with a system that abuses us.”
A broad-based capital gains tax would just reinforce that problem.
Just a few things caught my eye flicking through yesterday’s HYEFU summary tables – if you don’t count points like the fact that The Treasury projects we will have had five successive years of operating deficits (in a period of a high terms of trade and an overheated economy), and that net debt as a per cent of GDP (even excluding NZSF) is still increasing, notwithstanding the big inflation surprise the government has benefited (materially) from.
This chart captures one of the things that surprised me. It shows export volumes and real GDP, actual and Treasury projections. Exports dipped sharply over the Covid period (closed borders and all that), but even by the year to June 2027 Treasury does not expect export volumes to have returned either to the pre-Covid trend, or to the relationship with real GDP growth that had prevailed over the pre-Covid decade.
The Reserve Bank does not forecast as far ahead as the Treasury but has quarterly projections for these two variables out to the end of 2025. Here is a chart of their most recent projections
It is a quite dramatically different story.
The issue is here is not so much who is right – given the vagaries of medium-term macro forecasting there is a fair chance that none of those four lines will end up closely resembling reality – as that the government’s principal macroeconomic advisers (The Treasury) have such a gloomy view on the outward orientation of the New Zealand economy. One of the hallmarks of successful economies, and especially small ones, tends to be a growing number of firms footing it successfully in the world market. Earnings from abroad, after all, underpin over time our ability to consume what the rest of the world has to offer. Quite why The Treasury is that pessimistic isn’t clear from their documents – one could guess at various possibilities in aspects of government economic policy – but it does tend to stand rather at odds with the puffery and empty rhetoric the PM and Minister of Trade are given to.
Then there was this
On Treasury forecasts the CPI in 2025 will have been 13.3 per cent higher than if the Reserve Bank had simply done its core job and delivered inflation on average at 2 per cent per annum (the Reserve Bank’s own projections are very similar). It is a staggering policy failure – especially when you recall that the Governor used to insist that public inflation expectations were securely anchored at around 2 per cent. It is an entirely arbitrary redistribution of wealth that no one voted one, few seem to comment on, and no one seems to be held to account for, even though avoiding such arbitrary redistributions (benefiting the indebted at the expense of depositors and bondholders) was a core element of the Reserve Bank’s job. We don’t – and probably shouldn’t – run price level targets, but let’s not lose sight of what policy failures of this order actually mean to individuals.
And the third line that caught my eye was this
A good question for the National Party might be to ask how much of this 3.5 percentage point increase in tax/GDP they intend to reverse, and how, or would any new National government simply be content to leave little changed what Labour has bequeathed them?
As longer-term context (slightly different measure to get back to the 70s) the only similarly large increases in tax/GDP seem to have been under the 1972-75 and 1984-90 Labour governments.
A couple of weeks ago I wrote a post here, prompted by a paper by the former Bank of England Deputy Governor Sir Paul Tucker. Tucker’s paper was written in the context of the huge losses central banks in many countries, including his own UK, have run up through their large scale asset purchase programmes, especially those undertaken in 2020 and 2021 when bond yields (actual and implied forwards) were already incredibly low. While central banks continue to hold the bonds, the losses are seen every year now as the funding costs on those bond positions (the interest paid on the resulting settlement cash balances) swamp the low earnings yields on the bonds themselves. Bond positions purchased at yields perhaps around 1 per cent are financed with floating rate debt now paying (in New Zealand) 3.5 per cent (a rate generally expected to rise quite a bit further).
Tucker explored the idea that central banks might in future choose not to fully remunerate all settlement cash balances (while still applying the policy rate at the margin), and that if they did not then politicians might in future be reluctant to authorise future LSAPs and associated taxpayer indemnities (this seemed like a bonus to me, but Tucker is a bit more open to the potential of QE generally than I am (for New Zealand). With $60 billion or so of settlement cash injections still in the system (although with other offsets, total settlement cash balances are less than that), there is a lot of money potentially at stake.
My post was pretty sceptical of the idea – it seemed like arbitrary “taxation” by an entity with no mandate and little accountability – and in a Herald article at about the same time I was pleased to see several former colleagues also expressing considerable scepticism. In the wake of my post I had a bit of an email exchange with Tucker and while that didn’t change my mind it did help clarify the importance of reaching a view on whether the LSAP additions to settlement cash balances had resulted in something akin to a windfall boost to bank profits or not. Here is Tucker
Now, reaching a definitive view on a matter like this isn’t easy. Formalised models might even help, although I’m a bit sceptical even they could ever offer anything very definitive, and – in arbitrary taxation at least as much as criminal justice – we might reasonably expect something close to a “beyond reasonable doubt” test to be applied (especially when no one compelled the state to ever do LSAPs at all). You could think of a hypothetical world in which such a windfall might appear to rise – central banks buy the bonds from pension or hedge funds who simply deposit the proceeds with banks and happily (or resignedly) just accept zero interest on the resulting deposits – but it doesn’t seem very plausible. Perhaps there are other hypotheticals, but it still seems a stretch (and we aren’t in the world decades ago where, for example, banks were forbidden from paying interest on transactions balances).
I don’t have the resources or data for the sort of in-depth analysis that might be required if governments and central banks were to be seriously considering the Tucker option. But what do the high-level indicators we do have show? This, inevitably, bleeds into the recent (and annual or semi-annual) ritual in which the political left and the popular media bemoan the profitability of the banking system more generally.
The first increase in the OCR was in October 2021. Until then, settlement balances had been earning 0.25 per cent per annum, so that even if banks had somehow been paying nothing on the counterpart deposits, the amounts involved would have been too small to have shown up in the aggregate data (0.25 per cent per annum on $60 billion is about $150m per annum). But we have aggregate data now up to and including this year’s June quarter.
I’m including some long-term charts here (from the Reserve Bank website data, going as far back as their data go), as background to some comments on bank profitability too.
There is return on assets
return on equity
and the net interest margin (shown on the same chart as the average interest rate earned on interest-earning assets)
It is early days – the much higher OCRs for the September and December quarters may shed more light in some months’ time – but at present there isn’t anything much pointing to windfall earnings, whether directly from the Tucker effect or from the LSAP or other Covid interventions. Returns dipped during the 2020 deep (if brief) downturn, and then seem to have returned to about pre-Covid average levels. If the net interest margin has risen a bit, in the June quarter it was at about the average level for the previous 15 years.
On the other hand, supporters of the Tucker story could point to this chart. It is interesting that interest-bearing liabilities have dropped to a record (over this 30 year period anyway) low but (a) perhaps it is less surprising given that, at least to June, the absolute level of interest rates remained very low (and well below the prolonged period 20 years earlier when the interest-bearing share of total liabilities was also unusually low) and (b) as yet, there is no sign of this reflected in unusually high bank returns (see earlier charts).
Time will tell, but to this point there is no smoking gun, in New Zealand anyway. Tucker does note that (at least in the UK context) windfall returns could be paid away in management bonuses, so that they wouldn’t show up in after-tax profit figures, but (a) that seems more like a UK issues (big bonuses in the City etc) and (b) you would expect to see it showing up in bank disclosures (eg CEO salaries etc) and I’m not aware of any sign it (yet) has.
More generally, what to make of the bank profits story? On a cyclical basis there were reasons one might have expected the last year to have been the best for some time: the economy was extremely overheated, unemployment was extremely low, and although house prices have been falling more recently they only peaked in November last year, having risen to an extraordinary extent over the previous 15 months or so. Banks tend to make lots of money in circumstances like that (and, on the other hand, to do poorly in deep recessions). Perhaps reflecting the abnormal and uncertain state of the Covid world over 2021/22, in fact none of those charts above suggest anything exceptional about bank profitability (at times, really high reported bank profits can themselves be a worrying financial stability indicator – lots of poor quality loans with high upfront fees and/or dodgy accounting can produce very flattering short-term numbers, all while storing up big future losses. Cyclically, the year ahead looks a lot less favourable for banks (as the ANZ CEO noted they are now writing a tiny fraction of the number of new mortgages they were doing at peak) and a recession (with all the attendant reduction in demand for products, reduction in servicing capacity, and outright losses) is generally agreed to be looming.
What about overall average rates of return? When they left aren’t making cyclical complaints, this tends to be where they focus. And of course the return on equity is better than you are going to get on a bank deposit, but it is also a great deal riskier.
One obstacle to analysing the issue in a specifically New Zealand context is that hardly any New Zealand banks are listed on the stock exchange as such, so we don’t have a good read on the value the market puts on them. But the big-4 banks are the dominant players in Australia too, housing lending makes up almost two-thirds of credit in Australia, and Australia has similarly absurd house price to income ratios in its largest cities. Historically, rates of return have also looked quite high
(One might also add that in recent decades the New Zealand and Australian banking systems have been amongst the most stable anywhere).
Then again, the market seems less impressed with the Australian banks than the New Zealand political left are. Price to book value ratios don’t look particularly impressive – for long-established “licence to print money” entities – and of the four big Australian banking groups, in three cases the first time the current share price was reached was well over a decade ago.
We (and Australia) have big banks. When regulation renders house prices absurdly expensive, you need entities that will facilitate very large amounts of debt. Big banks require lots of capital, and on lots of capital lots of money can and should be made. But if the left is so convinced there is money for jam on offer there is a readily accessible market response: buy more shares with their own savings.
Instead, from the party that wants to make us all poorer, force people to live in expensive townhouses, and do all they can to discourage cars and planes (oh, and free speech too), yesterday we got a proposal that there should be an “excess profits tax”. The Green Party’s discussion document is here. I guess it is mostly just political spin to try to keep up the radical left vote, but it really was an astonishingly threadbare document.
For precedent, we are reminded on a couple of occasions that there were excess profits taxes in World Wars One and Two. And since we actually conscripting people – and ordering them into the military or directed service – and restricting all manner of other economic activity probably few people had much problem with that (the idea of “conscripting capital” was (understandably) big on the left in New Zealand. But while the left may like to claim we are now in some “moral equivalent of war”, in fact we are running a market economy in which firms and individuals are free to come and go, invest or not, as they choose. We are also told about windfall taxes on energy companies in Europe at present, but again these are rather more equivalent to an actual wartime situation (very high returns to lower cost renewables producers for example are arising out of the foreign policy choices of governments around the Russian/Ukraine situation).
But nothing in the Greens’ document establishes a serious case for New Zealand now (eg for better or worse we aren’t tied into the global LNG supply chain)
And then there are the basics. This appears early on.
I followed the footnote to be sure I was using the same sources. From the Annual Enterprise Survey
So you can see the $103.3 billion. But you might also note the sharp fall in this measure of profits the previous year (Covid disruption and all that), and the smaller fall the year prior to that. Actual profits before tax on this measure were about 5 per cent high in the 2021 years than in the 2018 years.
And nominal GDP? Well, it was up 17 per cent over roughly the same period (calendar 2021 over calendar 2018).
Then we get charts like this.
I have no idea where any of the lines comes from but note (a) the orange line, which claims to be taken from the AES, has a latest observation LOWER than the one a couple of years earlier, and (b) while the Greens claim that “the graph below demonstrates that profits are already exceeding prepandemic levels; and are several times higher in real terms than in the 1990s” they fail to point out that real GDP is a lot higher than it was in the 1990s too.
How do those ratios look? From the national accounts we have a breakdown between compensation of employees on the one hand and returns to business (including labour income for self-employed operations). Wage and profit shares have ebbed and flowed but nothing about the last few years looks very unusual.
The same data are now available on a quarterly basis, but only since 2016 (and inevitably the more recent observations are subject ot revisions). This time I’ve just shown the two series as cumulative growth rates since 2016
Labour costs and non-labour components of the income measure of GDP have risen over the full period by almost exactly the same percentage (seasonally adjusting through the Covid lockdowns is a real challenge so I wouldn’t pay much attention to those particular quarters).
We are left wondering where all these excess returns the Greens are on about really are. If they mean house prices rising in 2020 and 2021, well of course I can quite understand (and we know they like the idea of a capital gains tax) but……house prices are now falling quite a lot, and excess profits taxes aren’t usually aimed at Mum and Dad (indeed the rest of the document is all about th rapacious capitalists).
One could go on, but I won’t. The Greens seem keener on planning to spend the proceeds of their tax than provide firm analytical underpinnings to it, and of course while feeding the narrative that somehow there is money for jam being left on the table, there seemed to be no mention of countervailing reductions in business taxation if/when there is a deep recession or windfall losses (and in the nature of windfalls, losses are as likely as gains). But why would anyone really be surprised?
The document has this line: “The Green Party considers that record profits during a time of economic hardship for many New Zealanders are immoral and unsustainable”. Except that whether one uses their AES measure, or national accounts measures there isn’t anything very remarkable about profits in recent years – except of course that there is lots of inflation, but even then as that final chart shows returns to labour in total have been growing at about the same rate of returns to providers of other resources.
A conversation about the similarities and differences between taxes and social security contributions – my son is studying economics – prompted me to head off to the OECD website and get the data on total taxes and social security contributions as a share of GDP.
Here is what I found for 2021 (the OECD didn’t have this level of data for its Latin American members, and I omitted Ireland and Luxembourg, as their GDP numbers aren’t a suitable basis for these purposes).
That is the snapshot for the most recent year, 2021, and here is how New Zealand has compared to Australia and to the OECD median (countries in the first chart) for the period back to 1995 when the data are comprehensive.
To be honest, I was a little surprised. I guess time passes and impressions need updating from time to time: the story I had been walking around with (probably formed a decade ago) was that New Zealand tax revenue as a share of GDP fluctuated around the OECD median. It used to but, whether under National or Labour-led governments, it hasn’t done so for some time now. It isn’t that taxes are trending down in New Zealand – as a share of GDP in 2021 they were about the same as in the first couple of years of the Clark government but (a) the contrast with huge surge in tax revenue in the 00s is striking, and b) the OECD median has been edging up.
Of course, Australia is an important comparator, given the number of New Zealanders who look at making – and often do make – the move to Australia, and there is not much consistent sign of a change in the relationship between the two countries’ tax/GDP shares. And the Anglo countries have tended to be lower taxers than continental Europeans, and of the five Anglo countries we were the median taxer in 2021. Whatever one thinks of the US, Australia is hardly some unliveable hellhole (certainly the New Zealanders who move there don’t think so), although neither is it some star productivity growth performer.
Opposition parties seem to be making a fair amount of noise about tax as we begin to head towards next year’s election. And in many respects I sympathise: I find it hard to think of a single one of the tax increases put in place in recent years that I thought there was a good economic case for, and the fiscal drag that results from not indexing income tax thresholds is just bad policy at any time. We tax business too heavily, whether under National or Labour.
But…..you have to identify the things you don’t want governments spending money on, and that is where our main Opposition party seems to struggle.
The picture is, if anything, a little more stark if we shift from taxes and social security contributions to total current revenue. Natural resources owned by the state are part of the picture here (see Norway in this chart vs the first one above)
On this measure, we are even more firmly to the left of the chart.
(Incidentally, there is a line – that I probably thought had merit – that we don’t need quite such high taxes because our public debt is low. But the OECD database had net interest data, and we turned out to have been the median country last year. (Low central government debt, but persistently high relative interest rates I guess)
All this data has been taken from the OECD. There is some IMF data, and for a wider range of advanced countries. I don’t put a great deal of trust in the IMF numbers (too often I find NZ numbers that look odd), but they do capture places like Singapore and Taiwan.
But here is the IMF’s total general government revenue data, for 2021
On this measure and this group of countries we are somewhat further from the left. And if (like me) you aren’t overly interested in underperforming Mexico, Chile, and Colombia, note nonetheless the really low revenue/GDP numbers for Taiwan and Singapore. One can have a highly productive economy (both countries now have materially higher GDP per capita than New Zealand) with a materially low overall share of government revenue and/or taxes.
I focused on taxes in this post because (a) that is where the political debate seems to be, and (b) because in 2021 government spending was much more thrown about by Covid one-offs than tax revenue was. In the longer-run, it is the level of spending that determines how high taxes eventually will need to be. Over the recent decades New Zealand governments have had a good record of returning to balance or surplus whenever shocks push the budget into deficit (which means we are one of a minority of OECD countries like that, and very unlike say the US and UK where deficits have been normalised). But note that – with an overheated economy, and thus cyclically high revenue – we are not projected to be at balance or in surplus this year.
(And to anticipate questions as to what I would cut were I granted a magic wand, here are the first five that come to mind: Kiwisaver subsidies, fees-free first year tertiary education, R&D subsidies, the accommodation supplement (having freed up peripheral land and collapsed house/land prices), and NZS (raise the eligibility age to 68 in the next five years not the next 25). But realistically I do not expect New Zealand wil operate with a lower tax or revenue to GDP share than it has now.)