Just making stuff up: the chair of the RB Board and the blackball on expertise

The government-appointed (and reappointed) chair of the Reserve Bank Board has been in the news today, after the reports earlier this week that in his role as Vice-Chancellor of Waikato University he’d been negotiating policy around a future new medical school at Waikato with National’s health spokesman Shane Reti. I don’t have any particular problem with such talks per se but what caught attention was this spectacularly inappropriate line

Reti seems to be a person of decency and integrity and one can half imagine him wincing when he read those words. Who, he might have asked himself, is the senior person who not only runs a public university but also chairs a major government board, who actually says such things, let alone writes them down.

There is also a (paywalled) Newsroom article this morning [paywall now lifted here] on Quigley, explicitly questioning his ability to keep holding the Reserve Bank job. I don’t think Quigley is a political partisan (National or Labour) – and he has had roles from both National and Labour governments – but he again displays a serious lack of judgement and tone-deafness (of the sort that was on display when he finally got one of his RB Board members to step down from an insurance company directorship, not because having such a role was a terrible look but because the OIA might lead to some scrutiny, or had never raised a concern at the government appointing the chair of Kiwibank’s then owner to the board of the bank regulatory agency). He can’t match the Governor for lowering the standing and reputation of the Bank – but then for the Governor it is a fulltime job – but it is a pretty consistently poor and damaging record.

And then there was the question of the ban put in place in 2019 on appointing people with active or likely future macroeconomic research expertise to the initial round of Monetary Policy Committee vacancies. It is clear that there was such a ban (now removed for the round of vacancies coming up next year) and that the Minister of Finance and the Bank’s Board (chaired by Quigley, with Orr a member who had to be formally consulted as well) had agreed on the ban.

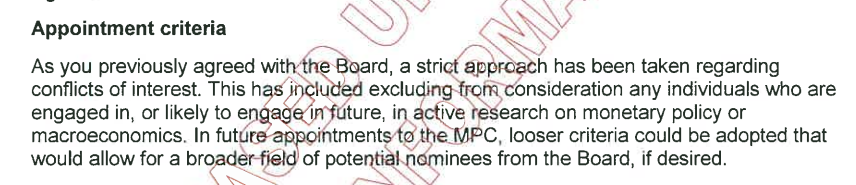
Quigley claims otherwise. That there never was such a ban, that it all a castle built in the air on a paper written to the Minister of Finance (released to me in 2019) by a Treasury manager responsible for governance and appointments. He had had, he claims, no idea until last year where such curious, incorrect, ideas (of the sort people like me and Eric Crampton, and fulltime journalists, notably Jenee Tibshraeny, now of the Herald) had been writing about had come from. This was the extract in question.

Quigley even got Treasury and the Minister to say in public that it had all been a misunderstanding, and that there had never been such a ban.

About a month ago I wrote a long post based around an OIA response from The Treasury in which I had asked for background relevant to that Treasury statement. I outlined what Quigley had told Treasury twice, months apart, earlier this year, and compared it carefully to what had been revealed in (a) past OIAs from the Bank and Minister, (b) things I knew from first hand accounts, and c) comments from the Minister, the Bank, former Reserve Bank Assistant Governor John McDermott, and former ministerial adviser Craig Renney. I pointed out that the ban had been commonly and widely understood, not just among Reserve Bank watchers in New Zealand but in markets overseas (a Treasury manager reported having been challenged on it in Australia), and not in ways that were welcoming – more along the lines of derisive comments that the Reserve Bank of New Zealand was the only central bank in the world where actual research expertise would have been a formal disqualifying factor. As I had noted in one post, not even Trump’s Fed appointment standards had dropped that low. There had been plenty of opportunity for Quigley and the Bank (or the Minister) to have corrected the story at any time over several years, and Orr in particular has not been backward in coming forward when he thinks people aren’t representing him or the Bank in a way he likes. I’d encourage you to read that post as I don’t want to repeat it all here.

At about the same time as the Treasury OIA had been lodged back in June Eric Crampton and I independently lodged (somewhat overlapping) OIAs with the Bank re aspects of the blackball and its removal. Being the Bank, they were very slow to respond but we both finally got responses on Tuesday. There is a couple of hundred pages of material, although bulked out by releasing back to us both the 42 page response the Minister had given me in 2019, which they had probably in turn just got from my website (it was in the mix because last year a senior Bank official sent it to Quigley, who then started on his “no, no, that wasn’t so at all” line.) Both responses are linked to below (Eric’s first – with his permission- then mine which came in two separate big documents).

RBNZ OIA release to Crampton Sept 23 re MPC expertise blackball

RBNZ OIA release to MHR Sept 23 re MPC expertise blackball Part 1

RBNZ OIA release to MHR Sept 23 re MPC expertise blackball Part 2

The documents make interesting, and slightly depressing even incredible (literally almost unbelievable), reading in places.

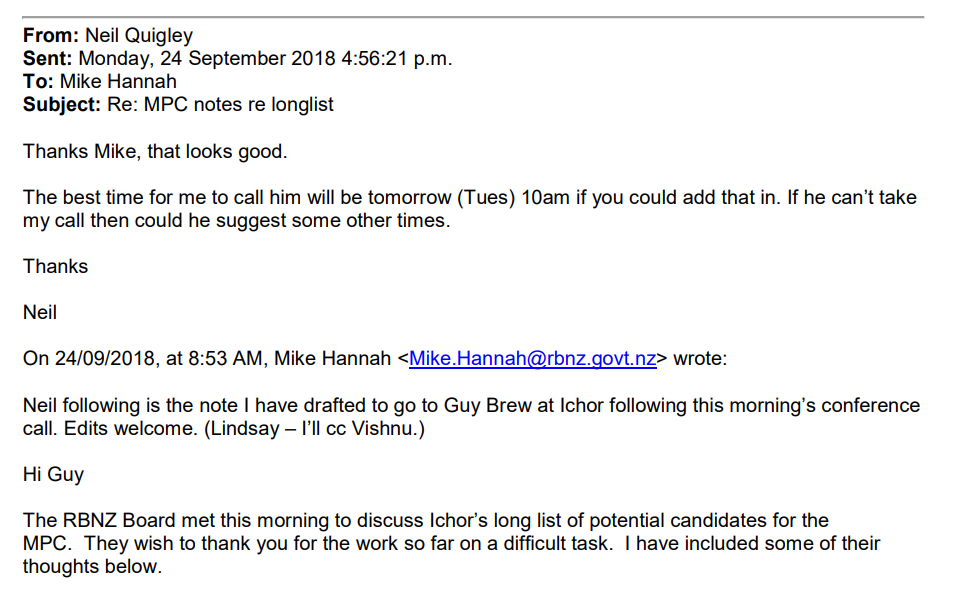
The document set starts on 18 May last year when the Governor (Board member) sends an email to Nick McBride (the Bank’s in-house lawyer) cc’ed to his boss (one of Orr’s DCEs) asking about whole situation re ”criteria and expectations” for external MPC members, noting 

McBride says he doesn’t really know what went on (“as far as I know it was worked out between MoF and the RBNZ Board”) while noting (quite correctly) that there was nothing in the Act or the MPC charter or code of conduct that required or reflected a blackball on expertise. (Among outside critics I think this has been common ground all along. It would have been even more absurd had the law somehow enforced the ridiculous ban.) McBride comes back later that day with the extract (above) from the 2019 Treasury paper, pointing out that it had been released to me and had been what had sparked the coverage. McBride disavowed any knowledge of what had happened beyond that account. Neither he nor Orr seem to be in any doubt that there was such a restriction put in place for the 2019 appointments.

Nor had there been any doubt earlier in 2022, when Tibshraeny had been asking about the blackball in the context of the approaching expiry of the terms of two external MPC members. The Bank knew then, but outsiders did not, that the plan was simply to reappoint the incumbents so inside the Bank it appears the issue hadn’t arisen until Tibshraeny got what was probably a throwaway line from the Minister in a press gaggle, that he wasn’t aware of any change of criteria, and she then sought comment from the Bank. No one in any of the emails seems to have doubted that there was a ban – no one seems to have known much – but they just wanted to put Tibshraeny off (‘best not to throw any chum in the water’) so they agreed also just to line up with the Minister and say “no change”. So relative to what we previously knew, it is probably safe now to say there was actually no new information in those 2022 comments from MoF or the Bank. There is no record of them having consulted either Orr or Quigley at that point.

The final bit in the response to Eric Crampton was this from February 2023, when work was going on on the process and criteria for the next set of MPC expiries/vacancies. McBride and one of Bank’s governance people explicitly draw Quigley’s attention to the 2019 paper (Gael is Gael Webster, the Treasury governance and appointments manager who had signed out the paper). Note that section 9(2)(a) is a withholding ground around personal privacy: we might wonder whose.

It is pretty extraordinary, if this were an honest account, that the Board chair had never once in the previous 3.5 years asked someone why this view – that there was an expertise blackball, which he says he was aware of – was abroad. Extraordinary and not at all plausible, given that until last year the appointment of MPC members and of the Governor was the single most important powers the Board had.

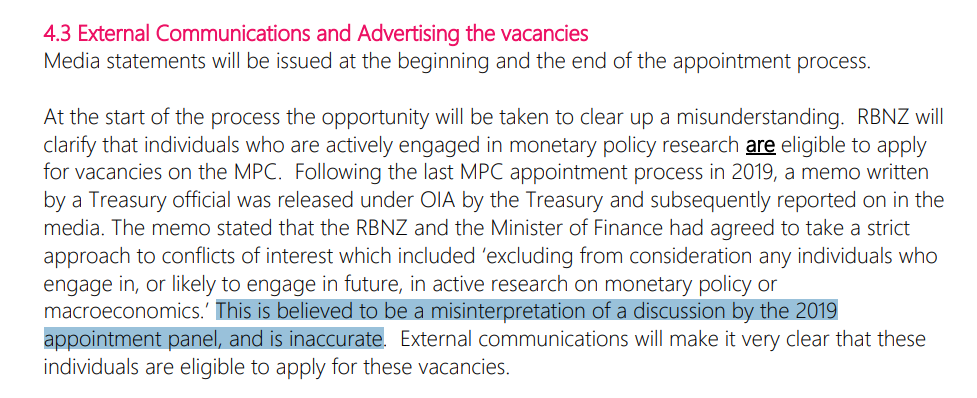
My OIA had covered only material from this year and picks up in mid-February (just prior to that exchange with Quigley) as staff are reviewing processes etc for advertising for MPC vacancies. (Interestingly, the Comms manager suggests this would be a good case for pro-active release of relevant material, not a concept the Bank displays any practical sympathy with ever). The draft document they are commenting on includes among the things to be done

and in comments McBride recognises the ban, commenting that “the board needs to be clear about its attitude to including MP [monetary policy] subject experts on the MPC and this should be resolved at the outset.

The Economics Department is a bit slow with its comments, and didn’t comment until the next draft in early March. Chris Bloor, one of their experienced and respected managers, observed

to which the person leading the process responds

But they really weren’t very sure. In early April a paper went to the Reserve Bank Board on the MPC appointment process and it included this

And that was all that was new in the papers relevant to the issue. Note that there is no suggestion that anyone made any effort to contact Treasury or Gael Webster specifically, they simply went along with a story Quigley had given them years after the event. It seems not to have occurred to anyone (or perhaps it would be lese-majeste in today’s RB to have done so) to ask “but what about all those statements that have been made in defence of the ban previously?”, or “but if so many people had got the wrong end of the stick outside and abroad, why did we never clear up the confusion?”

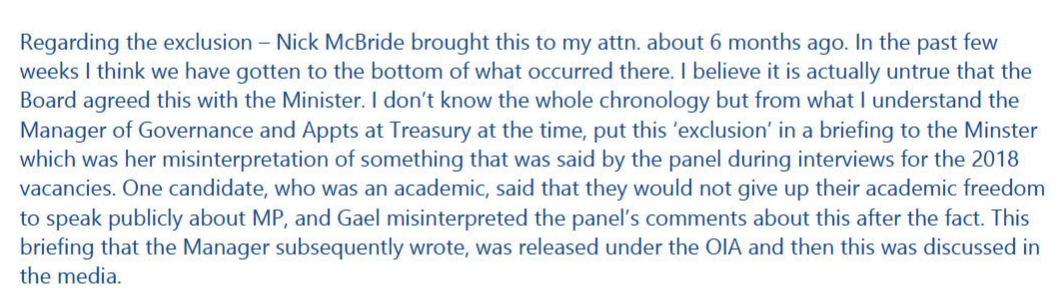
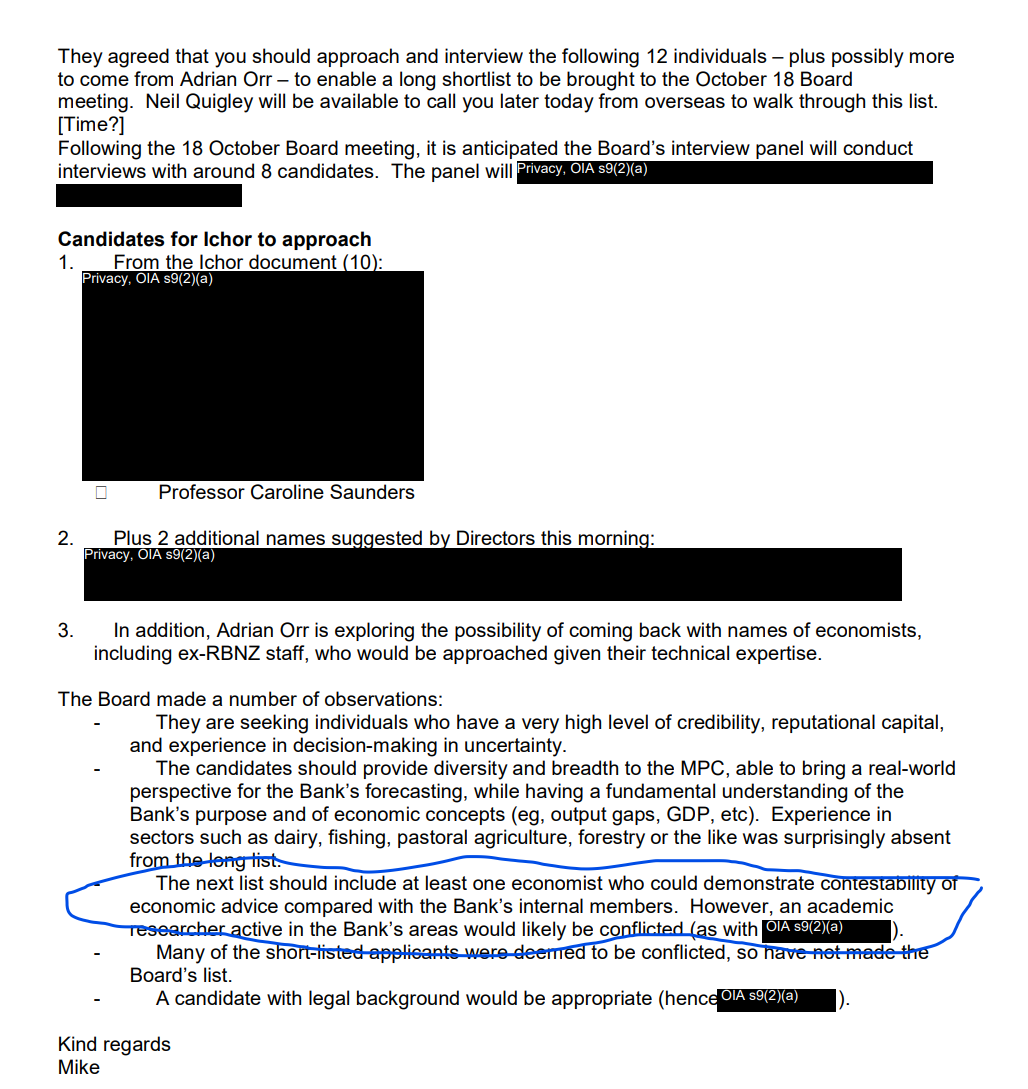
I’m quite prepared to believe that there was an interview with an academic applicant (recall that academics themselves weren’t barred, and (non-macro) Prof Caroline Saunders was appointed), who told them “they would not give up their academic freedom to speak publicly about MP” [as MPC members in many other countries do speak] but on the most charitable interpretation Quigley must have been conflating two quite different events and sets of circumstances.

As I discussed in the earlier post, all those years ago a qualified academic told me that they had contacted the recruitment firm the Board was using and been told that they would not be considered because they did and might do in future macroeconomic research on matters relating to monetary policy, and that this was a criterion choice adopted by the Board. The same academic then saw Quigley at a function and asked him about this apparent ban, including if it was really the Board’s view. As recounted to me, and repeated recently, Quigley’s response was along the lines that they wanted to be very cautious and risk-averse for the first set of appointments and that the criteria might be relaxed in future rounds. That was well before anyone was longlisted, let alone shortlisted or interviewed. My interlocutor couldn’t even get on the page to be asked about how they would operate in practice if appointed. And you will note that that conditional statement about future appointments is very similar to the wording used in that 2019 Treasury memo that Quigley now seeks to disavow, throwing the author under a bus.

And how about some of the evidence I cited in the previous post? Here Quigley raises no objections to the Board Secretary’s account of a Board discussion of individuals and (see highlighted bit) criteria.

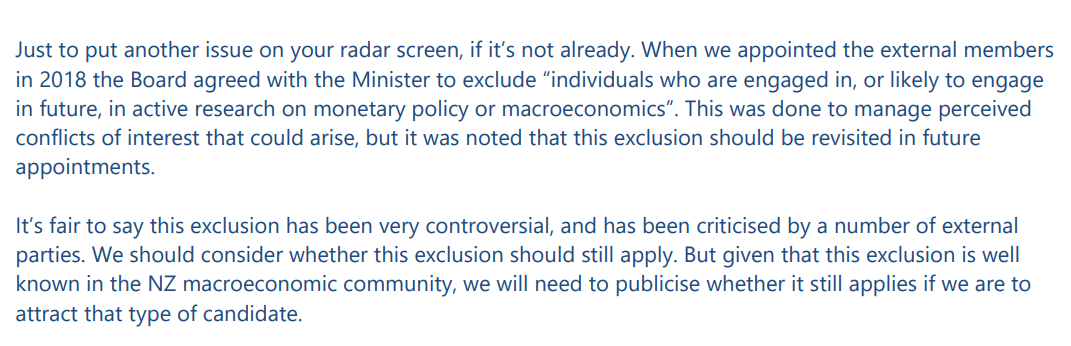
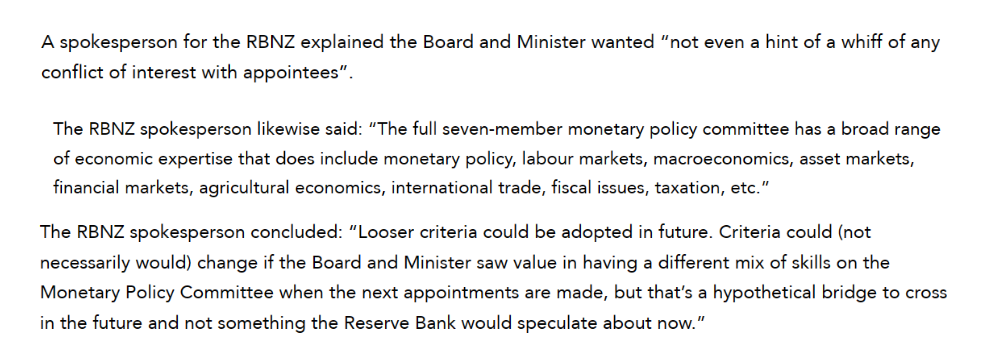
Here was how the Bank’s spokesperson was defending the blackball in 2019. Note the explicit use (their own words) of the line that “looser criteria could be adopted in future”.

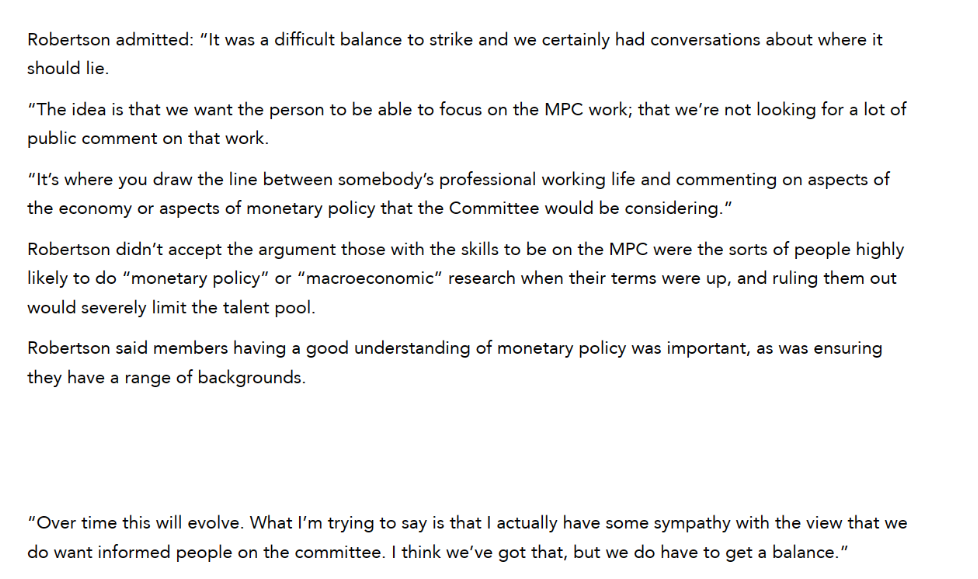
And here was the Minister of Finance’s defence of the blackball in 2019; he also explicitly stated “over time this will evolve”.

There is simply no evidence for the (contemporary) Quigley version of events – the one he got Treasury to embarrass itself by making a statement defending (having asked no questions themselves, but happily tossing a former staff member under the bus).

(Having read the latest OIA releases I went back this morning and read the Bank’s 2019 release to me on matters around the MPC selection and appointment process. On rereading it I noticed that they had not disclosed any communications to or from the recruitment firm (nor identified such material with statutory grounds for withholding). A new OIA has been lodged this morning which may yet shed some new light.)

It is quite clear that there was a blackball on expertise (which has now, formally, been removed) and when Quigley told Bank staff and Treasury (twice) that it was not so, at best he was confused, and at worst deliberately trying to lay a false trail to cover later embarrassment at such a bizarre rule, all while deflecting blame onto an experienced professional who had been working for another government agency. Neither option reflects any credit on Quigley or the Bank whose performance he is supposed to oversee and hold to account. Once again it brings the institution into disrepute (though more so him as an individual and statutory officeholder).

One is always suspicious of what isn’t in these releases. There is relevant material that has been in other releases, including from Treasury, but not released in this set, and there is no record of any discussion (written or oral) between the Governor and his Board chair about any of these issues. That simply doesn’t ring true. But whether true or not, there is quite enough material in what we do know to conclude that, wilfully and deliberately or not, Quigley was simply not telling an accurate story when he has tried to convince staff and Treasury that there never was a blackball. He should be held to account for that. He should not – for this and a variety of other reasons – be the chair of our central bank and banking regulator, from whom we should expect openness. transparency, integrity, accountability….and the humility to acknowledge honestly when mistakes have been made (in this case both the blackball itself and the spin, attempting to rewrite history at the expense of others).

UPDATE: Eric Crampton has a follow-up post in which he bends very very far over backwards to find a charitable explanation. I don’t find it persuasive, and he doesn’t take account of several important items above, but it is worth reading as an alternative take.

NZ in fiscal perspective: cross-country and across time

Yesterday’s post outlined some of the fiscal balance numbers that should get more focus in New Zealand but typically don’t (partly because The Treasury does not usually also make their numbers available in internationally comparable definitions and formats).

That post was partly background to today’s, in which I want to show first how the current New Zealand fiscal numbers – as at this year’s Budget, so near-certain to be less favourable next week at least in headline terms – compare with our own experience in recent decades, and then to put New Zealand’s numbers into international comparisons, both across countries (other advanced countries) and across recent decades. It will cover some ground similar to a post a couple of weeks ago, but whereas that week I was writing a series looking at countries which had their own monetary policies (with an inflation lens in view), and thus the euro-area was a single observation, in this post I’ll be looking at advanced countries (using IMF and OECD data) regardless of what monetary policy arrangements they have. The focus here is entirely fiscal.

I’m also not going to be paying any attention to anyone’s forecasts beyond 2024 (ideally 23/24). Fiscal numbers up to fiscal year 21/22 are hard, those for 22/23 are estimates (from the Budget), and those for 23/24 (also Budget) are based on (now) legislated taxes and appropriations. For anything beyond that one can look at cost pressures, one can look at political party promises, one can look at announced (frequently revisited “fiscal rules”) and so on, and do a different sort of analysis. But bottom-line fiscal forecasts several years ahead have little or no meaning.

The first chart shows the government’s (and, apparently, Treasury’s) preferred indicator: the operating balance (OBEGAL) as a per cent of GDP. As a reminder this is a theory-free and total Crown measure. The data go back only to 93/94.

On this measure we had 15 years of surpluses (under governments of both stripes). Then through some mix of poor Treasury advice and severe recession there were deficits, briefly but greatly exacerbated by the fiscal effects of the Canterbury earthquakes. This measure was back to surplus in 2014/15 and (rising) surpluses continued to be run by governments of both stripes for the following five years. Covid meant a loss of revenue and a choice (widely supported) to provide a lot of fiscal income support. A really big operating deficit in 19/20 understandably followed. Renewed lockdowns in late 2021 had a similar but smaller effect on the 21/22 numbers, but by then the economy was running strongly and inflation was rising sharply, and inflation is at least initially a windfall for the fiscal authorities. For the last two years (free of required Covid spending), the deficits are just under 2 per cent of GDP. The economy was more than fully employed in 22/23 and in the Budget forecasts was expected to be around fully employed on average over 23/24 (small negative output gap, unemployment rate averaging a bit below NAIRU).

As I noted yesterday, Treasury doesn’t publish a long-term time series of cyclically-adjusted balances, but this chart back to 2008/09 shows much the same picture

You might reasonably be a little sceptical about whether the cyclical adjustment effects are quite large enough (but New Zealand automatic stabilisers are not typically regarded as overly powerful), but these are the best estimates Treasury was giving us (and the government). There really isn’t much case for running cyclically-adjusted operating deficits (even OBEGAL deficits). It has the feel of borrowing to pay the grocery bill.

Governments (and Treasury) have chopped and changed the debt definitions they like to focus on. For the current (and better) favoured net debt measure, they have only backdated the series as for as 2004/05. But here is the chart, expressed as a per cent of GDP

Still not very high in absolute terms, but now the highest in at least 20 years (and in practice quite a bit longer than that).

And here is one last chart just using Treasury headline series; this one one which doesn’t get much attention but is measured a bit more like the IMF and OECD series we’ll come to later

It is a less rosy story after 2008, as the return to surplus lasted only two years (16/17 and 17/18) and the forecast deficit for the current year (23/24) is about as large as that in 2010/11 (earthquake year), and almost as large as the two peak Covid years. Treasury don’t do cyclical adjustment on this series but any adjustments would be fairly similarly small as those for the operating balance (above).

Those four charts just use series straight from The Treasury’s website. There are no adjustments, no approximations, no derivations, just reportage. And because they are idiosyncratic New Zealand series we can make comparisons only over time and not across countries.

As I noted in yesterday’s post, primary deficit measures (ie excluding interest) are a common feature in international agency perspectives (and databases) on fiscal stances. Treasury does not publish any such measures for New Zealand. We can, however, make an approximation. They are only approximations as the only long-term time series for finance costs that Treasury provides is core Crown while the OBEGAL operating balance is total Crown concept, and while residual cash is a core Crown measure it is cash-based while the core Crown numbers are accruals. In addition, in principle one should exclude interest receipts as well, but the time series data only breaks out only finance costs. It is less than ideal – Treasury, please start publishing some proper primary balance numbers – but I’m going to here adjust both the operating balance and residual cash for core Crown finance costs and keep my fingers crossed that if the levels aren’t quite right the comparisons over time will be more or less valid.

The primary operating balance is all but in balance this year (at least as at this year’s Budget), albeit a very long way below the primary surpluses we once more or less took for granted.

And if one wanted to tell a more favourable (and analytically valid) story one could note that in the last couple of years more than all the finance costs have just been compensation for inflation (eg 6 per cent inflation in the year to June while all government bond and OCR rates have been below that). If we did an inflation-adjusted operating balance series it really would have been probably around balance in 22/23. But that won’t be so in the current year, at least on current Reserve Bank inflation and OCR forecasts.

But at this point I’ve largely exhausted what can be done with official New Zealand data and have to turn instead to the OECD (mainly) and IMF databases, the two main compilations of (as far as possible) consistently-reported fiscal data and estimates/forecasts. These measures are all for the (national accounts) general government concept (which does not map directly to Treasury data for even central government New Zealand data), encompassing all levels of government. We don’t have provincial/state governments in New Zealand, and local government is small, but for valid cross country comparisons general governnment is the way to go. As to timing, the OECD numbers are from June (so probably incorporate budget numbers), but the IMF Fiscal Monitor numbers are from April (but we have a partial update from the IMF Article IV report released last week)

Neither the IMF nor the OECD report operating balances, whether headline or primary. However, if one digs down in the databases one can construct one’s own (as they provide data on current disbursements, current receipts and net finance costs as shares of GDP). Here is how we’ve compared against the 32 OECD countries (not including the Latin American ones) for which there is complete data.

Prior to Covid there was only year in the 25 in which New Zealand’s primary operating balance was even marginally below the OECD median. Since then, we’ve been running larger deficits and if anything the adverse gap was thought earlier this year still to be widening.

For this year, they had New Zealand’s deficit 7th largest in the OECD, and next year 6th largest. That was months ago.

And here is one of the series that the OECD themselves headline, the primary overall balance (current and capital)

The picture is fairly similar to the (derived) “operating balance” one. Previously the only time we’d been worse than the OECD median was with the Canterbury earthquakes (which put a large liability on the Crown through EQC). We used to better. Now we are worse. (On these forecasts a few months ago, 5th worst this year, second worst next year).

I’ll spare you the cyclically-adjusted version of this chart, just noting that on OECD cyclical adjustment methodology (consistently applied across countries) as at a few months ago the median OECD country was expected to be running a (tiny) surplus next year and New Zealand a substantial (2.5 per cent of GDP) primary deficit. Only Japan was then expected to have a larger cyclically-adjusted primary deficit.

And one last fiscal balance chart. This one shows the national accounts net lending measure for the general government sector

We used to be consistently better. Now (since Covid began and on mid-2023 forecasts even this year and next) we are materially worse. The differences here are not small (a 2 percentage point difference now is roughly $8 billion per annum for New Zealand).

And here is a chart of general government net financial liabilities as a per cent of GDP.

The New Zealand line looks a lot like the (shorter run) of central government Treasury data shown earlier. But it is the international comparison that is interesting. We often here talk about how low New Zealand government debt is, but actually the median OECD country just isn’t that heavily indebted either (although places like the UK, US, Japan, and Italy really are). We are still lower than the median country, but on these projections from some months ago the gap is closing fast. And notice that the median OECD country experienced a one-year blip up for Covid costs (and revenue losses) but now has lower net debt as a share of GDP than in 2019. New Zealand not so much. We have had one of the largest increases in net debt, as a share of GDP, whether one looks at the entire period since 2019 or just the final three years (our need for heavy Covid spending, like that of other countries, largely ended in calendar 2021). It is worth remembering that today’s highly indebted countries were not always so (eg as recently as 2001 the UK had lower net general government financial liabilities as a per cent of GDP than we do now).

Finally we turn to the IMF. They have a smaller set of indicators, but the same headline and cyclically-adjusted primary, overall, and net lending balances, and a net debt measure. To avoid being repetitive, I won’t run all the charts. They don’t provide such a long run of historical data but the broad pictures seem pretty similar to those with the OECD numbers.

However, in their Article IV report on the New Zealand economy last week the IMF provided an updated forecast series for several fiscal variables. Although the numbers were published last week the report was finalised in July, based on a mission here in June. This was the report that suggested that “frontloaded fiscal consolidation” should be the focus, pointing out in the text that the Budget had been quite expansionary (NB: contrary to the assertions of the RB Governor) that they estimated a cyclically-adjusted primary deficit of 4.4 per cent of GDP for fiscal year 23/24).

Here is a comparative chart for the last decade. We used to better. Now we are (quite a bit) worse. On the IMF’s cyclical-adjustment methodology our primary deficit this year will be larger than in any of the heavy Covid expenditure years,

And for a straight cross-country comparison (using the IMF’s Article IV estimate for the New Zealand 23/24 fiscal year and the average of their calendar 23 and calendar 24 estimates for the other countries.

Looking at the change since 2019, New Zealand has had the worst deterioration in its cyclically-adjusted primary balance as a per cent of GDP of any of these countries. The deterioration in the net lending indicator looks to have been very similar.

And one final chart. The IMF has a different measure of net debt again (and there is a slightly different group of countries than the OECD) but the picture for the last decade is broadly what we’ve already seen from the OECD data.

Here I have shown the IMF’s 24/25 number, not because it is sure to happen (next year’s Budget will be a thing) but because this is the most recent set of official agency numbers, and presumably part of the backdrop to that “frontloaded consolidation” call that both parties seem determined to ignore prior to the election. For this group of advanced economies the median country’s net debt to GDP has increased hardly at all since 2019. Back then the median was far above New Zealand. All it would take is another year or two of New Zealand governments continuing as ours have done in the last few years and we’d have net debt above the advanced country median (whether you like at this IMF version or the OECD one above). I hope there wouldn’t be many takers for that option, in our underperforming low productivity growth economy.

Every single of one of these charts is based on data either up to date to Budget time, or in the IMF’s case perhaps a month later. It is clear that the revenue picture to be revealed in the PREFU will be worse. (Labour’s changes last week to forward operating allowances will limit the damage to forward deficit estimates both those and the departmental baseline adjustments should be treated at this point as little more than electoral vapourware. Lines on graphs do not amount to concrete decisions to cut this or that and keep it cut. And cyclically-adjusted deficits do not fix themselves.)

Thinking about fiscal policy

The numbers The Treasury will release in its PREFU next week will make it fairly easy to follow some bits of New Zealand fiscal policy over time, less so others, but do almost nothing to facilitate international comparisons, and discourage New Zealand users and analysts from looking at fiscal policy in the way most other economic analysts and the international agencies do. It is fairly transparent, but in an insular way.

New Zealand’s government accounting framework often wins plaudits. As a matter of accounting, no doubt the plaudits are largely fair (although I’m not an accountant, and have previously suggested that some accountants rather overrate the contribution of the New Zealand model). It just isn’t a framework used widely for economic analysis or as a good basis for holding governments to account for the conduct of fiscal policy.

The focus here tends to be on the operating balance (excluding gains and losses). Last year, for example, the current government articulated its primary fiscal goal as being to (eventually) deliver and maintain an average (OBEGAL) operating surplus of between 0 and 2 per cent of GDP. It is a fairly theory-free measure

attractive mainly for being relatively more controllable year to year than a simple operating balance would be. But it is the first of the handful of “Fiscal strategy indicators” in the tables Treasury publishes. It was the measure that was forecast to turn positive (surplus) in 2025/26 in this year’s Budget (before they realised they’d forgotten to allow for the near-certain loss of lots of tobacco excise revenue), but in 2024/25 in last year’s Budget (and perhaps in 2026/27 in next week’s PREFU). It is the measure that was still in material deficit in 2022/23 and 2023/24 even at Budget time, before the deterioration in the tax revenue this (calendar) year became apparent.

But an operating balance measure (OBEGAL or total) isn’t widely used for fiscal analysis purposes elsewhere. In fact, if you turn to the two main compilations of comparable cross-country fiscal data – the IMF Fiscal Monitor and OECD Outlook – you won’t find any operating balance data at all (although you can put together such numbers yourself from components in the OECD database).

There are a couple of good reasons why that isn’t the focus.

Operating balances sound good and commercial, somewhat akin to a profit and loss account for a business. Capital expenditure typically doesn’t appear in a profit and loss account, and nor should it (as with New Zealand government accounts depreciation appears in a profit and loss account, and in the government’s operating balance). But when a business does capital expenditure it does so with the goal of generating future income (or maybe reducing future costs) but that is rarely the case with government capital investment spending. New Zealand’s total Crown OBEGAL does take account of the Crown’s ownership interests in various profitable businesses (which is not the case with the standard general government concepts used in the national accounts and in most cross-country fiscal analysis, where commercial business interests are excluded by construction) but most total Crown capex is just another form of spending. It might – like operational spending – be done for good reasons, it might have expected benefits down the track, but any such benefits are rarely fiscal in nature. And today’s capex is tomorrow’s depreciation (with no new matching revenue). In principle, the worse the project the larger and sooner the economic depreciation.

The second reason is the role of interest (financing costs). It is very common in overseas and international agency fiscal analysis to focus on primary balances, which exclude financing costs. These series are prominent in IMF and OECD tables. In New Zealand the Treasury publishes no primary balance measures at all and never seems to discuss the concept (one can construct some yourself, although probably only as reasonable approximations)

There are two good reasons for a primary balance focus. The first is that interest payments mostly reflect past fiscal choices rather than today’s (if your country ran up a high debt a decade ago, you are most probably still servicing that debt now). It is a real fiscal burden now (and thus primary balances aren’t the only relevant metric) but what matters more for the future debt trajectory is what choices are being made now re non-interest spending, and revenue. Broadly speaking, if you are running a primary surplus debt (to GDP) is likely to be heading in broadly the right direction, and if you are running a material primary deficit, then debt probably isn’t going to be heading in the right direction (it depends on your respective interest rates and GDP growth rates).

The other reason for a primary balance focus hasn’t been very relevant in advanced countries for several decades but is now: inflation. When inflation is low nominal interest rates tend to be low. When inflation is high nominal interest rates tend to be high. If interest rates are 2 per cent and inflation 2 per cent, the substantive economic implications for government finances are no different than if inflation is 5 per cent and interest rates are 5 per cent (real rates are the same). But nominal interest is what is recorded in the government accounts (and in those New Zealand government operating deficit numbers I mentioned earlier). It makes a difference: at present government bond rates and the OCR (much of the Crown’s debt is currently those RB settlement account balances) have increased a lot, but are actually both still below the rate of inflation. In economic substance terms, the operating deficit numbers in the Budget (and those to be published next week) are materially overstated.

(Inflation adjustment issues are pretty pervasive – company accounts and individual debt burdens, not just the government’s – are just another reason why we shouldn’t be tolerating a central bank doing such a poor job on core inflation that we have start thinking again about how inflation distorts both behaviour and accounts.)

Now it is true that The Treasury doesn’t just publish (total Crown) operating balance (OBEGAL) numbers. Second on that table of Fiscal Strategy Indicators is a measure called “Core Crown residual cash”. Unlike the OBEGAL it is (a) measured on a cash basis (not accruals), b) is a core Crown measure (not total Crown), and c) it treats all cash (capex and opex) alike. It is, in other words, much more akin to the series that show up in those international databases (but note that neither core Crown nor total Crown is the same as “central government” for national accounts purposes, let alone “general government” – which is vital for cross-country comparisons with countries where state/provincial and local governments make up a much bigger share of overall government activity)

When I went to work for a while at The Treasury I vividly recall one of their more astute analysts encouraging me to focus on this measure. Few in New Zealand seem do (and I only inconsistently across time). Neither political party seems to. And in case you were wondering, in this year’s Budget – recall, before the fall off in tax revenue – the core Crown residual cash deficits were expected to be 5.7 per cent of GDP in 22/23 and 6.5 per cent in 23/24.

The ups and downs of the economic cycle affect fiscal balances. Expenditure is affected to a small extent (eg unemployment benefits) but the main impact is on the revenue side (tax receipts). Consistent with that it is common to look at, and the international agencies, publish estimates of cyclically-adjusted deficits (total and primary).

The New Zealand Treasury does typically publish estimates of the cyclically-adjusted operating balance, but not of even any other measures, and notably not of any primary balance measure. One could do one’s own rough and ready adjustments to the alternative series, but how much better if Treasury were doing the adjustments themselves, using disclosed the contestable methodologies. There is also no long-term consistent time series (eg published with the annual long-term fiscal data on The Treasury website). There is no one right answer to how much allowance should be made for cyclical factors in doing cyclically-adjusted numbers – it is the same contests around the output gap and the NAIRU as monetary policy makers repeatedly face (and estimates are likely to be revised, perhaps quite a bit, over the years) – but in big booms and deep recessions it is important to try (normally we would not want deep fiscal cuts if we could be reasonably confident a deficit was mostly a reflection of a deep cyclical downturn).

Until relatively recently, The Treasury used to publish (but buried very deep in an Additional Information document) the operating balance on a terms of trade adjusted basis (a higher/lower terms of trade – variable and largely outside New Zealand control – can flatter/punish fiscal outcomes independent of government fiscal policy choices. Here is an example, from the 2017 PREFU, of how much difference Treasury thought the rising terms of trade had made in improving fiscal outcomes over the previous decade.

As the terms of trade trended upwards fairly consistent over 15 years, the adjustment perhaps became somewhat moot. In the last few years, on the other hand, the terms of trade have been falling back.

Much of this post so far has been about how we might better analyse New Zealand numbers in isolation, but international comparisons also matter. Why? Because there are no single right and wrong answers about the appropriate deficits or surpluses or debt levels, but we can often make better sense of our own data if we can compare and contrast with developments in other advanced economies. But comparing and contrasting needs to involve data compiled as consistently as possible across countries (as, say, with cross-country comparisons of GDP growth and productivity, and where comparisons of inflation are often complicated by the absence of such consistently compiled measures). For those purposes, the fiscal databases and forecasts done by the IMF and the OECD are the standard. In those databases we can find raw and cyclically-adjusted primary and overall fiscal balances, gross and net debt measures, and measures of net lending (savings less investment), all on a general government basis.

Both the IMF and the OECD produce numbers for New Zealand, including forecasts for the coming years. These are typically done starting Treasury’s fiscal numbers and adjusting for (a) different views on the state of the economy, and b) the methodological differences between the New Zealand measures and these internationally conventional ones. At times – eg the IMF Article IV report last week – they will provide some updated estimates, but generally the IMF and OECD numbers are published only twice a year.

But in the Treasury numbers accompanying the EFUs there is no attempt made to present their updated numbers in an internationally comparable format (not even just as an appendix), whether flow or stock measures. On the face of it, doing so should be a relatively mechanical exercise that would require a one-off investment to set up but almost no marginal resource cost beyond that (especially when the non central government components of general government are small and slow moving in New Zealand). And yet they choose not to do it, and as a result serious international comparisons are harder than they need to be. There will be some new IMF WEO estimates for New Zealand in October, but they are likely to emerge just a couple of days before the end of our election and won’t be able to inform discussion/debate of the fiscal situation. But Treasury could have produced their numbers in IMF and OECD formats.

This has been something of a background post with little data and just one chart. Tomorrow I will do a post looking at some of these better measures (NZ specific and internationally comparable) across time and across countries (OECD and IMF advanced economies) to put some light on how things stand right now, and have evolved in recent years. PREFU will then give us some more – apparently gloomier (although how much of that will be judged cyclical?) – data next week.

Making the PREFU more useful

Anyone with even a vague interest in matters fiscal (or those with little real interest but some responsibility) is now awaiting next Tuesday’s pre-election fiscal update (PREFU).

PREFU is a good to have, and much better than nothing, but could be made quite a bit more useful and relevant for what must be presumed to be its ultimate purpose, informing the pre-election debate around matters fiscal. The current law governing PREFU is a single (full page) clause in the Public Finance Act.

For a start, it should probably be moved a week or two earlier. The law requires as follows

The Minister must, not earlier than 30 working days, nor later than 20 working days, before the day appointed as polling day in relation to any general election of members of the House of Representatives, arrange to be published a pre-election economic and fiscal update prepared by the Treasury.

which would be fine if we thought of polling day as 14 October. 12 September (next Tuesday) is more a month before that. But since that law was passed, advance voting has, for good or ill (I think mostly ill), come to make up a very large share of votes cast, and advance voting opens less than 3 weeks after the PREFU will be brought down. Changing the law to require the PREFU to be published 20-25 working days before polling opens would seem consistent with the spirit of the original legislation now that voting arrangements/patterns have changed so markedly.

Obviously there are trade-offs. There are significant lags involved in bringing the Treasury EFUs together, but the point of the exercise is to inform voters and enable scrutiny, debate, and challenge, including around political parties’ programmes in response to the PREFU numbers (this is mainly an issue for Opposition parties, as the governing party not only has the advance information from Treasury but can ensure some of its policy stance is included in the PREFU numbers themselves, when communicated to Treasury as government policy (eg stance of future operating allowances)). Note that the PREFU is not, and cannot realistically be counted on as, the “opening of the books” for an incoming government, because in unsettled times numbers can move about quite a bit even in the period between PREFU numbers being finalised and a new government taking office (this was an issue in 2008 for example).

PREFUs look a lot like the Budget and Half-Yearly economic and fiscal updates (BEFUs and HYEFUs) – here is the link to 2020’s and here is 2017’s (one prepared in more settled times) That is encouraged by law, since the things Treasury has to cover in each of these documents is the same. In respect of the economic forecasts, that is probably fine: after all, forecasts of the overall economy are just that: forecasts. A myriad of private choices, here and abroad, and the cyclical stabilisation activities of central banks, will influence outcomes, but mostly those outcomes are beyond the government’s (or Treasury’s) control. The economic outlook is a backdrop for fiscal numbers and, perhaps, fiscal policy.

I’m sure there will be some gotcha-type focus next week on some of the macro numbers. Will, or won’t, Q2 be shown as having experienced positive GDP growth. Given (a) the long lag on Treasury’s numbers, and b) that the actual official SNZ estimate is out the following week, much of that might be good fun but largely pointless. Same probably goes for their view on near-term inflation (if you could ask the Treasury forecasters next Tuesday their best guess of Q3 inflation it would almost certainly be different by then to what will be in the document they publish that day). That’s inevitable.

The real focus is, or should be, on the fiscal situation, which one or other party will be directly responsible for in a few weeks’ time (and one party is of course responsible now).

The operative bit is 26U(2) above. Hence, the government’s fiscal announcements last Monday, trimming future operating allowances etc, in ways quantifiable enough to be included by Treasury in the fiscal forecasts we will see next week. The Minister of Finance could, if s/he were sufficiently cynical, set the future operating allowances to zero and Treasury would have to include that “government policy” in its PREFU fiscal forecasts. The Secretary to the Treasury does not have any leeway to forecast how that policy might actually play out over several years. It is her legal responsibility simply to ensure that the forecasts accurately reflect the policy the Minister has communicated to her.

In the normal EFUs there is somewhat more restraint on Ministers of Finance. You could communicate to The Treasury low operating allowance numbers for this EFU but….you will still be minister in a year or two’s time and will be accountable for the eventual numbers. It isn’t perhaps much of a restraint – forward fiscal paths often have a “line on a graph” quality to them (with no specifics as to how these numbers will be delivered) – but it is something. In a pre-election EFU, no one is accountable for anything really (well, the Secretary is, but for faithfully representing government policy in the tables).

In the 2020 PREFU there was a bit of sensitivity analysis published – we were in the midst of pretty extreme Covid uncertainty at the time – but more normally there appears to be little or none (check again 2017’s and you will find none re the fiscal position itself, only (buried deep in supporting documents) on the cyclical adjustment estimates).

My focus here is not so much on the uncertainties of this year’s tax take. They are no doubt real, but economic cycles ebb and flow. Fiscal analysis really should focus mostly on cyclically-adjusted concepts and numbers.

But what we don’t get from Treasury in the PREFU documents – or anywhere else (other perhaps than in the periodic long-term fiscal report, which isn’t focused on the next 2-4 years) – is any sense of the state or implications of the cost pressures that will be difficult for any party in government to avoid. Political parties can and should debate what programmes should be provided and what not. Treasury can’t offer any particular insight on those debates. But it can, and should, be offering some sense of the spending implications of projected population growth, projected inflation, projected private sector real wage growth, and so on. If the past is any guide, next week’s PREFU will show us none of that. The revenue implications will be taken into account but, except where the law requires indexation (for example), not the expenditure implications. Unless conscious and deliberate other choices are made, those sources of pressure will increase government spending over time. But Ministers of Finance are simply free to give the Secretary to the Treasury a path for future operating allowances which need not bear any relationship to, or be based on any analysis of, largely inescapable cost pressures.

This might be seen primarily as a dig at the current government. It isn’t. In 2017 there was a huge political and analyst debate about alleged Labour “fiscal hole”. Many of the claims proved to be overblown but the “largely inescapable cost pressures” point was very real. At the time, and at the prompting of several former senior Treasury officials, I wrote a post on exactly that issue. By that time we had both the PREFU (reflecting incumbent government’s plans and operating allowances) and the then Opposition’s own fiscal plans (at present we have numbers from neither side). This text and chart was from that post

and after I’d worked through various detailed numbers around forecast influences that would boost costs

Neither side told us how they envisaged reducing government spending as a share of GDP. In a mechanical sense (PREFU and Labour’s parallel) they added up, but in substance they didn’t. Some related points were also in this post.

I expect that in next week’s PREFU there will be an operating surplus shown at some point in the relevant horizon (perhaps a year later than was suggested in the Budget). Quite probably – given that National seems to have no interest in an aggressive fiscal consolidation – that will suit both parties, but in both cases it will avoid the hard discussions around the choices that will bring about such surpluses. Countries don’t get from cyclically-adjusted deficits to surpluses by magic – or by simply drawing a line on a graph. Both sides are already guilty of “line on graphism” with what are no more than assumptions about savings that might be made without addressing programmes or choices that would make such savings sustainable.

It isn’t that medium-term fiscal projections are always useless. Sometimes legislation will already have been passed that will come into effect only gradually, and we want to be able to see the implications of those legislated commitments. But that really isn’t much of an issue at present. And absent such slowly unfolding adjustments it really means that almost no attention should be paid to any fiscal deficit numbers in PREFU beyond the current financial year: this year’s Budget has been passed and what is authorised isn’t vapourware. But what parties tell us vaguely they might do in future (and both are guilty) isn’t really worth much at all.

I ended that 2017 post with this suggestion

I stand by that call. I’m quite confident there has been a lot of very low quality spending in recent years, but I also suspect that the things governments need to spend money on are benefiting temporarily from the big surprise inflation. I’ve made the point here that teachers were more or less forced to accept a real wage cut, and a big cut relative to private sector wage developments. Recruitment and retention challenges are, shall we say, not unknown in the sector, and if we care at all about a high quality education sector then over time (and whatever else needs sorting out) we will need to pay accordingly. The senior doctors dispute seems to have similar characteristics. But how large and pervasive are these effects across the board? Treasury is best-placed to know, and to tell us. If the amounts are material then whatever savings can be made from genuine bloat might not reduce deficits at all but just end up having to be spent to be able to maintain or secure high quality core services. Treasury is obliged to publish a lot, but it could publish more and more useful standardised information along these lines.

Policy costings: a case study

I’ve written a few posts here over the years about the idea – which apparently Labour, National, and the Greens are now keen on – of a state established and funded policy costings unit. The most recent two were a month ago, here and here. I’m a longstanding sceptic of the case for such a unit, seeing it is just a way to get more state funding for political parties, and not dealing with any of the common arguments made for such units.

It is election season now and some of the arguments have, in effect, been put to the test. This week National released its tax and spending plan, producing numbers suggesting that what they planned to spend was fully funded by other cuts and new taxes. I wrote here about the macro issues and implications of/around the plan, largely taking as given the specific numbers the party supplied.

I’m not close enough to any of the line by line numbers to know whether each of them is solidly costed. Their economic consultants say they have been, and (assuming there were no silly mistakes made by accident) National does have a pretty strong incentive to ensure the numbers are each reasonably robust. So, for now, I’ll assume they are (with a few possible caveats about the foreign buyers tax, see below).

[and, later, on that tax]

…As for the revenue estimates ($750 million a year), they seem quite high, and the tax rate seems high by most international standards (Singapore is a lot higher). Only time will tell how many people not living here so want a New Zealand house they will pay a 15 per cent tax to do so.

Individual costings really weren’t and, as macroeconomic commentator, still aren’t my focus. In the grand scheme of things, the overall package involves adjustments of less than 1 per cent of GDP per annum, most costings don’t seem to have been contested, and in an age of MMP even a big party’s plans are likely to be implemented a bit differently than the pre-election promises. The foreign property buyers tax itself is expected to raise revenue equal to 0.2 per cent of annual GDP (and the gambling tax about 0.05 per cent of annual GDP).

But both as a potential voter and as someone interested in institutional proposals, notably that for policy costings offices, the subsequent debate has been interesting. I don’t really understand the issues around the online gambling costings (and the amounts involved are much smaller) so I’m going to focus on the foreign buyer tax. On that score there seem to be two quite separable concerns raised:

  • first, how consistent is the proposed tax with various tax and trade treaties New Zealand has signed? and
  • second, even if the tax were able to be put into effect as National tells us it envisages it (excluding buyers from Australia and Singapore, as with the current outright ban), just how much revenue would the tax be likely to raise year in year out?

Of course, the more there are issues under the first leg, the more questions could legitimately be raised about the revenue estimates.

Based on what they have told us, in the lead up to the announcement National did what one might have expected from a party seeking to win the right to lead the government after the election.  It hired a firm of advisers (Castalia) and asked them to review the draft numbers.   From what National has said (and I recall one media outlet being shown Castalia’s comments), National went with numbers that were generally at the conservative and cautious end of the spectrum.   Castalia apparently also cast a fresh eye over the numbers in light of the government’s fiscal announcements last Monday (although this is unlikely to have meant much since how much baseline spending can be saved – by either party –  isn’t really something a consultant can tell you, since it is mostly about the resolve of the politicians’ themselves once in office). 

In addition to having consultants review modelling numbers, the National document told us they’d sought legal advice

National has sought legal advice on whether the replacement of the foreign buyer ban with a foreign buyer tax is consistent with New Zealand’s existing free trade agreements – that advice confirms such a replacement would be consistent with those agreements. However, this policy assumes Australian and Singaporean citizens will not be affected by the tax as they are not currently affected by the foreign buyer ban.

and a Newshub article yesterday reported that National had sought both legal and tax advice on these issues.

Image

So far and mostly so good.  We don’t just have National’s word for the numbers, but an established firm –  yes, paid for by National, but with an ongoing reputation to guard – is reported as telling us they thought the numbers overall had been cautious and conservative.

But then the questions arose. First, around the legality of imposing such a tax on various countries.  Some of the points were from Labour Party spokespeople (eg this press statement).   They are the political opposition so we might have no more particular reason to take their claims on trust than to take National’s on trust, but they do make some specific points, which to a lay voter seem like questions deserving an answer.  In fact, there might be both legal questions and questions about whether the proposed tax is within the spirit of agreements that New Zealand governments have voluntarily entered into (and which National is not on record as having opposed, or is now proposing to withdraw from).   (Non-specialists among us might also wonder why if absolute bans –  the ultimate in discrimination – mostly are legally okay (we now have one), a tax which would be less onerous would not.)   As National notes, some other jurisdictions have such taxes, but the issues here isn’t one of merits, but what specific New Zealand agreements do and don’t allow (and noting that New South Wales appears to have recently withdrawn its version of such a tax because of federal tax treaty issues).

And then questions arose around the modelling (ie even if the law could be done as National had suggested whether it would raise $750 million or so year in year out).   Various economists and property analysts (people without apparent strong party loyalties that might make their perspectives suspect) raised doubts.  On the property experts side this article from today’s Post seems representative.

tax doubts

There are, of course, some enthusiastic real estate agents.  I read an article reporting one agent saying he’d had US billionaire clients on the phone within hours.  I don’t doubt there would be interest: the question is how much, and how much beyond the first wave (a quick Google suggests there only 2700 billionaires in the world).

Without seeing National’s modelling, it isn’t really possible to reach a confident view on their numbers.  But what makes me cautious is that I’ve seen no one –  neutral expert or even National surrogate arguing that the numbers are really on the cautious side and a more realistic assessment might be higher again.  It seems hard to find revenue estimates for other countries’ foreign buyer taxes –  often they are designed to deter purchases rather than to raise revenue – although I found a reference yesterday suggesting that a similar tax in Toronto (a metropolitan area with more people than New Zealand) was raising only about $200m per annum.

So wouldn’t this have been a clear case for a policy costings office?   I don’t think so.

National has used its (scarce) resources to pay for analysis and advice and has told as much as it seems to want to tell us.  Debate and scrutiny has ensued.   As a geeky analyst and undecided potential voter I’d really like them to release their modelling and any Castalia comments on it, and either the advice or a fairly full summary of the advice from the “legal and tax experts”.   It would be good even if they had some known National-sympathising experts who they could wheel out to make the case for (a) the legal problems not being what some suggest they might be, and b) the robustness of the numbers  (I don’t really expect Willis or their Revenue spokesperson to spending lots of time in public debate in the middle of a campaign).

But here’s the thing. It is their choice what to release (or not), and our choice as voters to draw our own conclusions.    Elections are most unlikely to turn on a specific like this, which is ultimately fairly small in the scheme of things (eg against the backdrop of some of the largest primary fiscal deficits of any advanced country at present, 0.2 per cent of revenue isn’t nothing but it is almost lost in the rounding – and is less than the non-specific proposed bureaucracy savings).  For some people and at the margin, it may shake confidence.    Go back to that quote from my post earlier in the week:   my starting point was to think that National had strong incentives to make sure that their numbers were robust, so as a starting point I took them as given.  Now that questions (apparently serious questions) having been raised, they have chosen not to release anything more or to address the specific concerns.    It is a legitimate choice (they are free to make it), but I (and the handful of interested analysts and potential voters) can draw my own conclusions. For me, I’m less confident now that the numbers add up, and also less confident than I might have hoped in their commitment towards being an open and transparent party in government.  It reinforces my wider doubts about their overall fiscal stance.

And that seems to be the political market working.  Parties will make choices about what they think a sufficient number of voters care about, or even about what sufficiently vocal commentators might shape public thinking over.  It is very unlikely that details of this tax score highly on either count.   Is that a bad thing?   I don’t really think so.    Voters are making judgements about values, about competence, about desires (or lack of them) for change.   And frankly, if fiscal issues were to become an issue, such concerns should probably centre on things individually more important than details of this tax.   The merits of unprincipled tax policies (this foreign buyers’ tax, Labour’s proposed GST exemptions, or the distortionary new depreciation provisions both parties have individually proposed to foist on the business sector) for example should probably count for more.  Or the sheer size of deficits  – without precedent in New Zealand now for many decades on the eve of an election.  But in the end, voters and parties will make their own choices, and nothing this week suggests to me that we’d have been better with some state-funded tax and trade lawyers and economist adding to the mix.  Precise numbers almost certainly do, and in my view probably should, matter less than what we learn about parties and their spokespeople in how they handle issues like this.