In mid-April, The Treasury released some economic scenarios for how things might play out as the country and economy work through – and perhaps beyond – Covid-19. I wrote about that document here. The focus of those scenarios was on peak levels of (for example) unemployment, and on the multi-year path back to full employment. It was a quite limited exercise – although valuable for what it was – in that all the variation across the scenarios was about the degree of government (a) restrictions, and (b) stimulus.
A day or two later, the Reserve Bank appeared before the Epidemic Response Committee and they gave the Committee some numbers for the estimated GDP losses at each level in the government’s (then) schema of alert levels – this was before the current “Level 3” rules were adopted, let alone the new (“Level 2”) ones to be announced today. The comparative losses across the various levels at that point were as follows
| Loss of GDP (%) while restrictions in place | ||
| Treasury | Reserve Bank | |
| Level 4 | 40% | 35% |
| Level 3 | 25% | 20-25% |
| Level 2 | 10-15% | 10% |
| Level 1 | 5-10% | 5% |
In a post a day or two later, focused on the loss of GDP during the “Level 4” period, I suggested that the Reserve Bank in particular was probably understating the severity of the loss. I noted that senior officials in some European countries had been talking of a 35 per cent loss during the period of peak restrictions, and yet our own restrictions then were regarded as among the most stringent anywhere in the advanced world. As a cross-check on my thinking I went through the 50+ sub-sectors of GDP that SNZ publishes data for and made some back-of-the-envelope estimates for each, which ended up in aggregate consistent with my view that even The Treasury might be a little light (although the uncertainties are huge). Checking my spreadsheet, I see that the final number I came to them was a 42 per cent loss relative to normal, which I’d be happy to call “40-45 per cent”.
Yesterday, the Reserve Bank released a staff working paper with some more detailed estimates. This will be background material for the MPC’s deliberations in advance of the Monetary Policy Statement next week. They appear to have revised some of their estimates since that select committee appearance in mid-April. The centrepiece of the publication is probably this table.

At least for the stage we are now in and those ahead of us (one hopes no more “Level 4”, but who knows), these estimates are lower – less heavy losses- than those the Assistant Governor gave Parliament (see earlier table). Of course, there are huge margins of uncertainty that render all point estimates things to be used advisedly, but when the same institution publishes point estimates a few weeks apart, the differences may still be worth paying some attention to.
On the other hand, there are things that confound the comparison. For example, the actual “Level 3” rules we currently live under are more constraining than the “Level 3” the government initially published in late March (or which we lived under for two days in late March). But that then makes the contrast between the “Level 3” estimates given to Parliament a few weeks ago, and those they are coming up with now, a bit puzzling. Despite what still seem like relatively tight restrictions, the Bank thinks half the fall in GDP in “Level 4” is recovered in “Level 3”.
Another important aspect is that the Bank appears to be trying to be clearer about what the current numbers actually represent. This is their description
This paper estimates the direct costs to economic activity while the measures are in place. Any ongoing impacts to GDP, or to wellbeing are beyond the scope of this analysis.
We estimate the impacts on GDP of the following measures:
• Lock down of all non-essential activity (alert level 4)
• Restrictions on trading activity (alert level 3)
• Border restrictions
• Domestic travel restrictions
• Mass gatherings and public venues
Now even this isn’t quite right, since as they note in passing later much of the fall in GDP would have happened anyway, with no New Zealand government restrictions at all: tourism was falling away sharply, as was domestic air travel, physical distancing was becoming increasingly prevalent and so on.
And as the restrictions are eased back, what is lawful is not necessarily what will occur.
In “Level 4” however, things are a bit clearer. Things were – often rather loosely – described as “essential” (those Cookie Time biscuits, cigarettes, Arobake cakes etc), and what could lawfully be done was (largely) the binding constraint. So for Level 4 what could be done and what were done were probably quite tightly aligned: if there were to be a GDP figure for that month or so, the Bank presumably thinks it would have been 37 per cent lower than normal.
But that won’t be the case as the restrictions are wound back. As one – probably extreme – example much as the Bank thinks a lot more of the economy can operate now, no one in my (high income) household has spent an additional cent on any New Zealand business that we weren’t patronising in “Level 4”. It seems that what the Bank is actually describing for Levels 3, 2 and 1 is something much closer to the lawful capacity of the economy (including the reduced productivity of many operations that are allowed to open in some form or other, or work from home) than to the actual likely GDP effect. Thus, they appear to be saying that 81 per cent of the normal level of the economy could be produced in “Level 3”, not taking a view on the extent of demand. Actual GDP may be – I suspect probably is – much weaker than that.
Of course, as one runs up the levels, things get murkier again. At “Level 1” it appears that everyone in the economy could work, and perhaps only international airline operations would be (in effect) regulatorily restricted; it is just that a key chunk of demand just won’t be there (Rotorua and Queenstown hotels/motels will be quite free to open – as they are now I think – but there might be rather few takers). And since this is a stylised exercise, that does not include the effects of fiscal or monetary policy responses (feeble as the latter has been so far), they can’t be thought of a forecast that, say, if we are at Level 1 in three months’ time, GDP will then only be 3.8 per cent less than normal. The Bank’s exercise also makes no attempt to allow for confidence factors, no attempt to allow for the derived loss of activity elsewhere in the economy from a shock to a particular sector, no attempt to factor in a severe world economic downturn (in a wider world when Covid is still far more present), and so on.
These are not, repeat not, criticisms of what the Bank has published. What they have published in a useful exercise, all the more so for the detail they have provided, but it is important to recognise what it is and what it is not. Especially beyond “level 4”, it can’t be thought of as a GDP forecast at all.
They have a summary chart of the sectoral effects in “Level 4”.
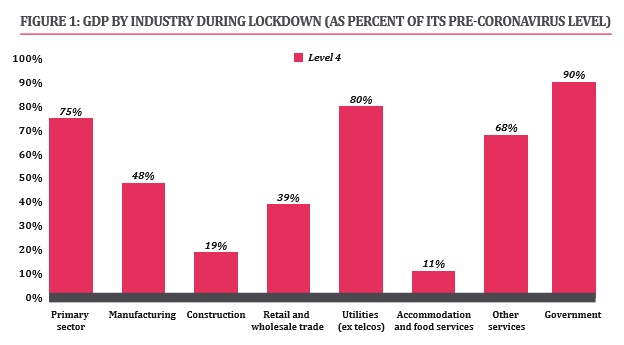
There is also a more detailed table at the 19 sector level, with their estimates for both “Level 4” and “Level 3”. I went through the detailed spreadsheet I did on 18 April and compared my numbers with theirs for “Level 4”. For some sectors, my estimates of losses were a bit smaller than the Bank’s (notably primary) but for others mine were larger. I really struggle to see, for example, how the “Government” sector (Public Administration and Safety) will have been operating at 90 per cent of normal during “Level 4”, or how “Health care and social assistance” will have been operating at 90 per cent, when all elective surgery was cancelled and GPs reported a significant drop in business. “Education and training” operating at 90 per cent also seems ambitious – especially as I get emails from my children’s schools telling me they are having to cut back their NCEA credits offered this year (suggesting effective productivity is well less than 90 per cent).
For what it is worth, I’m still comfortable with my 40-45 per cent. I’d say “time will tell” but it won’t. For a start, we don’t have much good monthly official data in New Zealand, and Statistics New Zealand seems to have been quite badly prepared for a serious pandemic and is going to really struggle to produce even decent quarterly estimates (especially those productivity losses, even if people have been getting paid).
I don’t have detailed “Level 3” estimates of capacity to compare with those the Bank has put out. But I’d just reinforce my point: what they seem to be describing is something more akin to capacity than to actual, and the actual level of GDP now may well still be more like 30 per cent below normal even if the Bank is right in saying that in principle it could trade up to 80 per cent of normal. Few of the scattered aggregate indicators we have suggest anything like that sort of actual rebound – and my anecdote of the day was wandering past a local cafe this morning offering coffee and food (presumably within the rules) with, at the time, precisely no customers whatever.
What time will tell is what the Reservev Bank and the MPC have come up with in their publications next week. The Governor has talked in terms of a scenarios focus, and that makes a fair amount of sense, but I hope we will get much detail than (say) the Treasury scenarios document offered, and some richness in thinking about how private sector behaviour might respond, how the severe global downturn will affect us, and so on. Precise numbers will only take us so far – especially as the Bank may have to choose whether to forecast reality or what SNZ might first publish – but they should be a framework for something more specific than we have now, and something to compare (one hopes) with whatever The Treasury comes out with in the Budget the following day.
(The Bank’s paper would, however, have been better without awkward injections of commentary about their estimates of the effects on the “Maori economy” – something never defined. There was, for example, no commentary on the Presbyterian economy, the Asian economy, the left-handers’ economy and so on – not even the “European New Zealanders” economy. There is, it seems, no stopping the energetic political signalling, and associated abuse of once-scarce public money, by the Governor.)

Reblogged this on Utopia, you are standing in it!.
LikeLike
Unfortunately our government is not a NZ government but considers itself as the Colonial British Crown. Note the awkward references to The Crown with any dealings with Maori. The only Crown is not in NZ but in Britain.
LikeLike
Nice commentary Michael.
I especially like how you have split things between what might be the productive capacity of the economy and what may actually happen. It’s a useful distinction. Also, I think it’s pretty clear that ‘L3’ is very different to the ‘L3+KFC’ we currently have.
FWIW the 5 large banks are forecasting a drop in activity of about 6.5% this year and only about 2.8% growth next year, so the negative output gap that comes out of that is pretty significant. Not sure how the RBNZ will estimate potential as the loss of tourism will impact both actual and potential GDP growth.
I am sure the RBNZ will talk a lot about how stimulatory monetary policy is. But if we look at policy settings through the lens of an output gap/MCI framework, policy is going to remain tight.
I do hope the RBNZ genuinely pursues negative rates. For NZ, negative rates will work. we have a sizeable negative basic balance of payments, which is funded largely by debt-creating capital inflows. If we move into NIRP, a classic Dornbusch overshooting model would suggest the need for a significantly weaker NZD – to offset the negative rate differential – and that will drive easier monetary conditions.
LikeLike
I locked in 18 months at 3.09% for $500k then banks started offering below 3%. Clearly the expectation is lower interest rates without the RBNZ doing anything. At this stage the RBNZ should just focus on encouraging banks to lend and take the opportunity of the lowering of LVR for 12 months. So far only Kiwibank has offered lower LVR lending.
LikeLike
Correction: lower equity restrictions on LVR lending.
LikeLike
Weekly Payroll Jobs and Wages in Australia, Week ending 4 April 2020
https://www.abs.gov.au/AUSSTATS/abs@.nsf/mediareleasesbyReleaseDate/400084FDCC1353C9CA2585500026370F
Weekly Payroll Jobs and Wages in Australia, Week ending 18 April 2020
The Weekly Payroll Jobs and Wages in Australia estimates also showed that between 14 March and 18 April (the five weeks after Australia recorded its 100th confirmed COVID-19 case) total employee jobs decreased by 7.5%, while total wages paid by employers decreased by 8.2%
https://www.abs.gov.au/ausstats/abs%40.nsf/mediareleasesbyCatalogue/C9E9F14708FC0AE7CA25855E0018F325?OpenDocument
Based on Single Touch Payroll data from the Australian Taxation Office ATO
The Australian Bureau of Statistics (ABS) today (21 April 2020) released new statistics on jobs and wages based on Single Touch Payroll data from the Australian Taxation Office. The estimates in Weekly Payroll Jobs and Wages in Australia provide additional information on the economic impact of COVID-19 and complement monthly Labour Force statistics
Australian Bureau of Statistics Provides Weekly Updates on Jobs and Wages
Nothing since
Meanwhile in New Zealand
You must file an employment information form every time you pay your employees, weekly or fortnightly. If you have multiple paydays, you must file an employment information form for each payday
https://www.ird.govt.nz/employing-staff/payday-filing
Data Release = zero
LikeLike