I noticed last evening that the Bank of England had released its Monetary Policy Report with some rough and ready GDP estimates/forecasts. They reckon UK GDP probably fell by about 3 per cent in the March quarter (which would be a smaller fall than in quite a few other big European countries) and then by about a further 25 per cent in the June quarter. In previous comments both the Bank of England and the Office for Budget Responsibility had estimated that during the lockdown itself GDP would be perhaps 35 per cent less than normal.
The Bank of England described their numbers as rough and ready. I pulled out an old envelope and sketched out on the back of it some week by week stylised “rough and ready”) numbers for New Zealand. In part I was curious to see what it would take to produce a similar June quarter fall in New Zealand, and to benchmark that against some of the numbers in my post yesterday. Bear in mind that even though our restrictions have been eased somewhat, on the widely-used Government Response Stringency Index our restrictions have been tighter than those in the UK and remain so today, although it is possible that over the next few weeks our easings will go further than those in the UK.
We don’t have a good read on the March quarter, and given the difficulties SNZ has reported with some of its collections late in the quarter there may well be quite a bit of uncertainty for a long time, perhaps always. I’ve assumed that the economy was running as normal during January (growing slightly) so that the notional level of GDP at the end of January would represent normal. I then allowed for a 1 per cent drop from there to about 10 March, another then a 0.5 per cent the following week, and a 1 per cent drop the week after that (recall that tourism was dropping away sharply and distancing and uncertainty were mounting locally). The last six days of March were at the so-called “Level 4”. Treasury assumes GDP was 40 per cent smaller than usual during that period (as discussed yesterday, the Reserve Bank guess is a bit smaller, mine a bit larger). Apply that for the final six days and one ends up with GDP down by 2.7 per cent for the quarter. Realistically, I suspect the truth could be anything perhaps two percentage points either side of that (although my bias is probably something on the weaker side).
What about the June quarter? Here are two scenarios

Assume – with Treasury – that GDP was 40 per cent below normal in the “Level 4” period (one day short of four weeks of April). Then I’ve assumed a lift to operating at 70 per cent of normal in “Level 3” (consistent with comments in yesterday’s post) and that that period only lasts two weeks. Then I assume we move up to 80 per cent of normal in “Level 2”. You’ll recall that the Reserve Bank numbers looked more optimistic than that, but as I noted yesterday their estimates seem to be closer to the legal practical capacity of the economy, not the level of actual utilisation of that capacity. I remain pretty comfortable with an 80 per cent – and perhaps the more so after reading about and listening to reactions to the practical constraints that “Level 2” regime would pose.
But perhaps I’m too pessimistic, so my alternative scenario has the economy adding another full percentage of normal each week for the rest of the quarter so that by the last week of June – still “Level 2” by assumption – the economy is at 86 per cent of normal. In previous posts I have suggested that while the border remains largely closed then direct and indirect effects (uncertainty, weak world etc) – and lack of much monetary policy support – could easily see the economy running 10-15 per cent below normal.
On my central scenario, GDP in the June quarter is 25.7 per cent lower than in the March quarter. But even on the less pessimistic scenario – since the further recovery comes late in the quarter – June quarter GDP is still 24 per cent lower than in the March quarter.
Those losses are quite a lot larger than I gather the bank economists are forecasting. On the other hand they are pretty similar to “around 25%” fall Treasury had in its Scenario 1 (which, in terms of restrictiveness, seems closest to what we are likely to see). Since the fall also happens to be fairly similar to those Bank of England numbers – and we’ve had until now tighter restrictions (especially on economic activity) than them – they have the feel of being in the right ballpark to me. You could add five percentage points to each of my less-pessimistic scenario numbers (so starting “only” 35 per cent below normal in Level 4, as the Reserve Bank thinks), and you still get a June quarter fall of about 19 per cent.
(Of course, if things go more or less to plan, all of these scenarios would have significant positive growth rates for September.)
For anyone tempted by still more positive views, I found the indicator shown here – suggesting China may still be running 20 per cent below normal even now – salutary.
The other reason I went to the effort was that the Reserve Bank yesterday released the results of the latest Survey of Expectations. Normally no one pays much attention to most of the questions (inflation expectations aside – and I’ll come back to them), but this time there is so much uncertainty and so little hard data that it was always going to be interesting to see what this group of semi-experts (a large number of economists are on the panel) thought on average. The survey forms were completed in the week ending 24 April.
Three months earlier, respondents on average expected GDP growth in each of the next two years to be around 2.2 per cent. Now they expect (on average) a fall of 4.9 per cent in the year to March 2021 and a rise of 3.2 per cent the following year. Note that the survey asks about growth from the March quarter of 2020 to the March quarter of 2021; they are – in the jargon – point to point estimates, not annual averages.
That fall to March 2021 might not sound too bad. But bear in mind that almost everyone probably expects the worst quarter to be the current quarter and much of those losses will have been reversed over the following few quarters. Unfortunately, the survey no longer asks about expectations for the most recent quarter, but (see above) most likely GDP had already fallen in the March quarter.
If I take my estimates for the March and June quarters, and then apply the March year expectations from the Bank’s survey, one could see a path for real GDP a bit like this (blue line).

That still leaves real GDP in the March 2022 4.5 per cent below the level it was in December last year. Respondents aren’t asked about potential GDP, but if it grew by even 1 per cent per annum over the next two years (some mix of a bit of population growth and a bit of productivity growth) it would still leave GDP 6.6 per cent below potential. If so, then even in two years’ time these respondents views might be consistent with a negative output gap then which was still quite a bit larger than the Reserve Bank estimates the output gap to have been at the worst in 2009.
This is all very stylised and little more than illustrative, but there is nothing at all encouraging about those GDP growth expectations. Consistent with that, respondents expect the unemployment rate to still be above 7 per cent in March 2022 (rather more pessimistic than the Treasury’s extra-stimulus scenarios, although more optimistic than my response to the survey.)
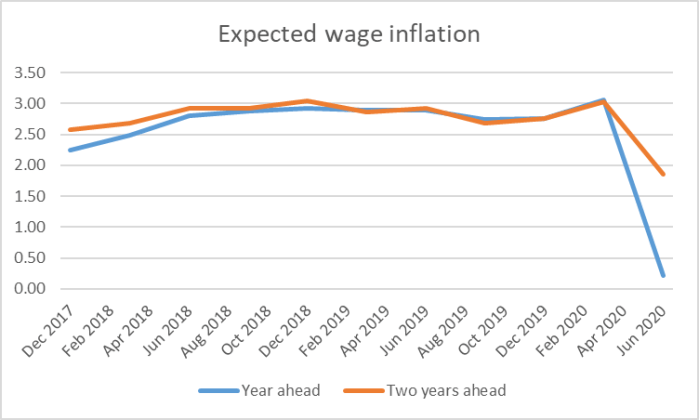
What else was in the survey? There was the record low wage inflation expectations (the survey has been running since 1987), although I suppose even in the first year the expectations are still just positive.
For the coming year, house price inflation expectations also went negative (but those questions haven’t been asked for long, so it is hard to benchmark the answers).
Then there were the questions about monetary conditions. Respondents are asked to indicate how tight or loose they think “monetary conditions” are on (as I recall) a seven point scale. “Monetary conditions” is in the eye of the beholder – not specifically defined – but although interest rates are part of the story, they’ve never been the whole story. That is particularly clear this time.
Respondents are asked about three dates: right now, at the end of the next quarter (September in this case) and in a year or so’s time (March 2021). On both the first two questions the mean responses were that “monetary conditions” are tighter now than respondents thought they were in late January (previous survey) or in October 2019 (after the MPC’s unexpected 50 basis point cut). Since nominal interest rates across the board are lower and the exchange rate is also a bit lower than in January, I presume respondents have in mind some mix of share prices and credit conditions. I don’t want to make too much of the responses, but they should be a bit sobering for the MPC as they prepare their Monetary Policy Statement – after all, management keep telling us how much they’ve done to ease conditions.
And then, of course, there are inflation expectations. The Reserve Bank used to put considerable emphasis on the two year-ahead expectation (the one year ahead one is thrown around by tax changes, sudden oil price changes etc). Sometimes it has looked as though it was quite influenced by recent inflation outcomes. That clearly isn’t so this time.

Thirty years of inflation targeting, 12 years in which the target was lower than it is now, and never have these medium-term inflation expectations been lower than they are now (1.24 per cent). The median response is a bit higher than the mean, but both about 70 basis points lower than they were in January. You’ll recall that the OCR has been cut by 75 basis points since then. In real terms, the OCR has barely changed, in the face of the biggest economic slump in a very long time.
You might perhaps look at that chart and take some very slight consolation from the fact that expectations are still above the bottom of the 1-3 per cent target range. Even on its own, that shouldn’t be reassuring given (a) the self-imposed limits on the OCR, and (b) that the Remit requires MPC to focus on the 2 per cent midpoint.
But it may also be worth remembering that for the last decade, as medium-term expectations have clung close to 2 per cent, the Bank’s preferred measure of actual core inflation has consistently undershot.

Also a little concerning to the MPC should be the expectations of inflation five years hence. It is a relatively new question and until now responses have clung very close to 2 per cent. This time, the average response is 1.8 per cent – for a period five years hence.
And, of course, there are the breakeven inflation rates from the government bond market. For some reason, the Reserve Bank seems to disdain these indicators and hardly ever refers to them, but not only have the implied expectations fallen this year, they’ve edged a bit lower again since those Reserve Bank Survey of Expectations forms were completed.

It isn’t just New Zealand – less liquid markets and all that. The fall in the implied expectations in the United States has been very similar to that in New Zealand.
This stuff really should be worrying the MPC.
(It should be worrying the bank economists too, but for some reason they all seem to think no further effective monetary policy easing is required – except perhaps for the Bank to buy some more bonds, which might hold bond yields low, but will have little more useful impact on the New Zealand macro/inflation outlook than what has been announced already. In fact, since the notion that MPC would materially increase the bond purchase programme has been around for weeks, any benefits there might – or that respondents might think there might be – should already largely be incorporated in these gloomy expectations above.)
The MPC hasn’t been doing its job at all well (as well as being exceedingly non-transparent and noon-accountable). Next Wednesday is an opportunity to redeem themselves. If they won’t – as they won’t – the Minister of Finance should insist, if he is at all serious about fast return to something like full employment.

Expectations, perceptions etc. – real impacts yet still mysterious; helps explain the stock market I guess but not sure what happens to the NZX 50 if that second half bounce lacks air.
LikeLike
I have not touched the share market since 1987 crash except for $100k invested in Kiwisaver in the last 7 years.. I am wholly invested in residential property with substantial OD facility. Recently I drew down on my OD facility and shifted $200k into a bank savings account. I intend to have another $200k invested directly in the NZX which I have already bought $20k. Still have another $180k to invest directly in the NZX.
LikeLike
Or $380k if I shift my cash savings into the NZX. Also considering the ASX as it is more liquid. I was trying to buy Scott Technologies at market price. No one sold to me.
LikeLike
Reblogged this on Utopia, you are standing in it! and commented:
Whatever else can be said, all economic charts in the future will be useless because they will be dominated by the Covid spikes
LikeLike
So far NZ has a 89% recovery rate of infection. A level 2+ alert with borders locked down and a ban on mass gatherings was all that was required. There was no Covid level Emergency. There was only a Covid scaremongering propaganda by Jacinda Ardern which a scared Opposition National party bought into.
LikeLike
I understand estimates of GDP for this quarter; if 20% are not working then production will be down about 20% – some variation caused by different ways of working; decreasing with time spent washing hands etc and productivity increase if we have fewer meetings and chatty coffee breaks.
It is extrapolating forwards that leaves me confused. When my British grandparents survived the drop in GDP niney years ago there was little inessential expenditure so it cut into essential expenditure such as food. Just look at the photos of the Jarrow hunger marchers – their hunger showing on their thin faces. Now assuming a permanent reduction in tourism, tertiary education, use of public transport, conventions, airlines and airports, sporting events, and such like and estimate a reduction of a hypothetical 20%. Assuming our govt continues to redistributes wealth via benefits then a 20% cut is simply a modest reduction in our inessential expenditure. We will cut out the foreign holidays and my family may sell our fourth car. Seems like no big deal. On the other hand can slices of production be sliced out of the national GDP? What if it is like a giant card house; remove a few cards and we collapse into anarchy.
Are there foreign examples to learn from – a developed country unwittingly dependant on a resource that suddenly fails? Iceland with its banks? Tunisia after attacks on tourists? Argentina after a default?
Fortunately whatever does happen with a drastic reduction of GDP we will see it first in other countries and our govt will have the same advantage it had with Covid-19 of learning from others.
I cannot remember where I heard it but managing a declining business reveals who are the best managers (my family was a British Railways family). Should the treasury get advice from the man who managed RBS after its troubles.
LikeLike
I usually consider Jacinda Ardern and Grant Robertson poor financial managers due to their think big failures like Kiwibuild and rail transport through low density suburbs but I must say they moved very quickly when it comes down to giving away $10.5 billion to 1.7 million people to prevent the potential fallout from falling into anarchy. They do understand how to be popular completely blindsided the National Party opposition into accepting a Emergency lockdown level 4 when clearly there was no evidence of an emergency to set aside parliament. 4 weeks of Solo grandstanding with the National party playing nice and in a prime position to kick out the Greens and NZFirst. Winston Peters was also completely sidelined. Bye bye NZFirst.
LikeLike
You’ve probably seen that some of Covid advice papers have been released.
I haven’t been through them all, but the COVID-19-Moving-to-Alert-Level-3-and-Level-4 minute and paper of 23rd march seems particularly relevant. I note:
– it references Australia’s environment and decisions as pertinent and applicable to NZ. But subsequently does not address how the papers recommendations compare (and exceed) the Australia response.
– it provides rationale for moving to Level 3 (as the Aussies did). It then asserts that moving to L4 is inevitable, but provides no justification or rationale why this should be true
– it seems that the L4 decision was essentially pre-determined by officials and not rationally justified. In conjunction with Ian Harrison’s modelling, I would speculate that the advice of UoO was not subject to any rational scrutiny, ie the health “experts” advice was trusted at face value
– it mentions Italy and Iran as scenarios to avoid, and Singapore and Taiwan as ones to emulate. There seems to be no consideration of why NZ is unlikely to follow the trajectory of these exemplars eg due to differing population densities, less pollution etc. Therefore there is no consideration of alternate/third paths forward
– finally as with most countries without federal government systems, the response assumes a one-size-fits-all strategy across the country. That certainly simplifies planning and communication, but it also guarantees an excessive response in regions of lesser risk
I for one am looking forward to some post-hoc analysis of the response (and hopefully more nuanced than “we got the good results we did purely from our L4 actions”)
LikeLike
Yes, I’m dipping into the releases at present.
On Newshub Nation this morning James Shaw was asked about the advice and actions. HIs answer was entirely the one you hoped we would not get. Then again, he isn’t even formally part of Cabinet. The questions need to be put to the PM.
Of the papers I’ve read, they confirm how complacent both Health and Treasury seemed to be until well into March.
LikeLike
James Shaw still gets paid $370k as a cabinet minister outside cabinet. Paid to keep quiet and back Labour. Legal corruption at the highest levels.
LikeLike