It was tempting to devote the whole of this morning’s post to the two latest utterances from the Governor of the Reserve Bank (perhaps together with the column in the Herald by the Governor’s chief journalistic channeller). Particularly egregious was Orr’s sunny upbeat piece in the Sunday Star-Times yesterday. Perhaps I still will write such a post – it is frightening that such powerful senior officials are capable of such pap, and yet face very little accountability – but for now perhaps I’ll just copy the heading of the email someone sent me yesterday about the SST column.
What!!??
But in this post I wanted to look at a couple of papers that came out a week or so ago trying to look at some of the economic effects of past pandemics. One of these appeared even to have been cited or referred by the Prime Minister in her press conference yesterday. For those comments I’m relying on the report this morning in the Politik newsletter. On several points it appears that there was quite a lot of spin in her remarks, but I suspect that on the narrow economic point she will simply have been relying on something she’s been told, whether from The Treasury or her own department.
Of the spin, two things in particular caught my eye. The first was the continued boasting about the government’s initial economic package (size/timing), when a large chunk of that package had little or nothing to do with the coronavirus, or the economic effects thereof, and those parts instead just represented a permanent worsening in the underlying fiscal position at a time when the rapidly deteriorating economy was in any case about to cut rather severely into the revenue base. Little of the package was really cognisant of what was just about to break over them (recall that this package was a mere three weeks ago). For all the advertising urging us to “Unite”, when politicians continue to play politics they can’t expect to go unscrutinised or citizens simply to fall in behind them.
The other point that I wanted to comment on briefly was the Prime Minister’s use of work by Rodney Jones’s firm to justify the lockdown. I heard her on RNZ this morning say that the government had had work suggesting that we might soon be at 4000 cases and that since we had only 1039 it showed the lockdown had worked. But that is the same sort of all-or-nothing reasoning I criticised in my post on Friday. As I understand it, that work essentially applied estimated aggregate reproduction rates as they were up to when the numbers the PM referred to were calculated. Such an approach would also have generated predictions of 4000 cases in New South Wales by early April (up from about 400), and yet New South Wales was only at around 2200 cases by then. But all that was before really widespread voluntary behavioural change had cut in. And New South Wales is still not in the equivalent of the Prime Minister’s level 4, and in significant respects is not as restrictive as New Zealand. I don’t doubt the government’s lockdown has made a difference to the path of the virus in New Zealand, but it is highly misleading to imply that the move to Level 4 has made anything like all the difference in those numbers the PM was referring to. For now, growth in case numbers in Australia also seems to be levelling off, and the total confirmed cases in the two countries are now much the same in per capita terms (Australia previously having had consistently higher numbers). Ideally – and it might not be possible – in thinking about the merits of retaining the current highly restrictive approach a truly marginal analysis (of both costs and benefits) would be desirable.
But it was the economics I wanted to focus on. According to Politik, mostly direct quotes from the PM
“A strategy that sacrifices people in favour of supposedly a better economic outcome is a false dichotomy and has been shown to produce the worst of both worlds loss of life and prolonged economic pain. “
Ardern quoted “research available” on the Spanish flu which underlined her point. That research is presumably a paper published last week by three New York Federal Reserve researchers [actually two Fed researchers and one from MIT] which showed that areas that were more severely affected by the 1918 Flu Pandemic saw a sharp and persistent decline in real economic activity.
“We find that cities that implemented early and extensive non-pharmaceutical interventions suffered no adverse economic effects over the medium term,” they said.
“On the contrary, cities that intervened earlier and more aggressively experienced a relative increase in real economic activity after the pandemic subsided.”
There is a link to the full paper here. For geeks, it is a fascinating exercise, and must be a testimony to the resources available to US researchers, that they managed to pull together so much data – even if often a bit fragmentary – and make sense of it in such a short space of time.
The centrepiece, including in shorter write-ups of the paper, is this chart.
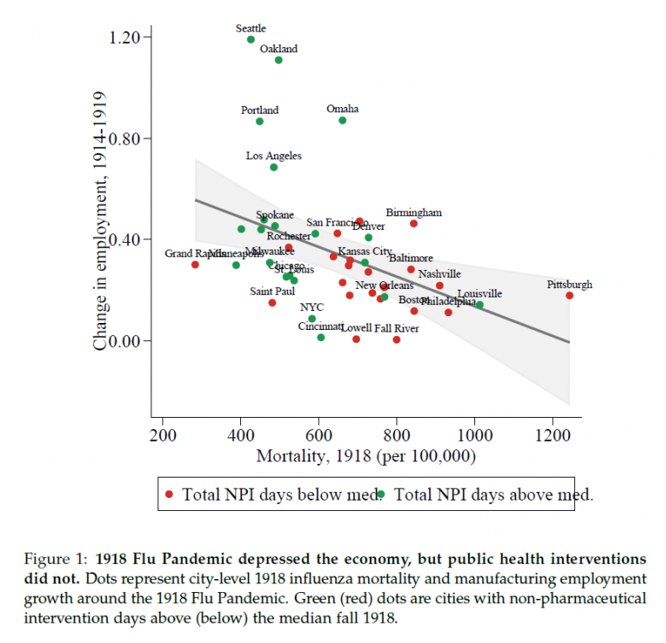
For the cities for which they could data, it shows on the x axis the influenza death rate in 1918 and on the y-axis growth in manufacturing employment over the period 1914-1919, The red dots are the cities which use non-pharmaceutical interventions (eg shutdowns on public places) more and the green dots are the cities that used such interventions relatively less. In the chart you can see two things:
- first, cities with a lower flu death rate had higher growth in manufacturing employment (differences statistically significant and economically material), and
- second, cities that use NPIs more intensively and earlier had, on average, low flu death rates.
And on this chart appears to rest the communications line applied to today used by many, including by our Prime Minister.
As I said, I thought it was a pretty impressive exercise to pull all this data together and make sense of it. The authors report a number of checks and controls they used suggesting that the relationship they report, for one country in 1918, was something real.
On the other hand, it is only fair to point out that when they look at some other economic variables – bank assets, bank loan losses, and motor vehicles registration – the results, attempting to relate city-level mortality to later economic outcomes are mostly not statistically significant. And I haven’t seen this line in the paper much referred to either
Several studies explore the long-run implications of the 1918 Flu. Brainerd and Siegler (2003) find that states with higher 1918 influenza mortality experience stronger per capita income growth in the long-run, from 1919 to 1929.
So count me a little sceptical as to just how generalisable the specific result in the chart above was for 1918, let alone now. For 1918, there was huge variability across countries in mortality rates, and although the data on death rates is not particularly robust, I’m not aware of papers suggesting that differences in mortality rates across countries were an important explanatory factor in relative economic performance over the following decade or two. Perhaps I’ve missed something, but if the literature existed I imagine these researchers would have cited it.
But there are some more important caveats around the ability to apply this study re 1918 to the current situation and use it to justify a claim – of the sort the PM seemed to be making – that a pretty severe lockdown is a net positive in terms of economic outcomes.
Among those caveats:
- note that all those cities in the chart above had really quite substantial death rates from the flu, (as distinct from, say, the current situation in New Zealand or even Australia),
- the deaths in the 1918 pandemic were unusually heavily concentrated among men in the 20-40 age group (prime working age, and at a time when female labour force participation was lower). In other words, a higher death rate directly reduced manufacturing labour supply (and presumably output). By contrast, in all the countries we’ve seen much data of so far, for this virus deaths are very heavily concentrated among those out of the labour force,
- and perhaps most importantly, none of the NPIs cited in the paper the PM referred to were anything like as stringent as what is being applied in New Zealand at present. The paper lists many examples of the approaches adopted in different cities, but the restrictions imposed seem to have been mostly limited to things like schools, large public gathering and parades, places of entertainment, and in some cases staggering working hours to allow greater physical distancing on public transport. In some places, shopping hours were limited. But I could not see a single example cited – either here, or in the various other 1918 books/papers I’ve read – of the sort of restrictions New Zealand has, which simply forcibly close almost all shops, and most workplaces (to the extent work can’t be done from home).
I am not, repeat not, here taking a view on whether the New Zealand approach is the correct one (it is similar to those in some other countries), simply noting that whereas in 1918 disruptions to production were mostly about absences due to sickness, and the restrictions were around the margins for most firms, on this occasion – including in New Zealand – the restrictions go much more consciously and deliberately to the heart of the production process. Not only are the short-term GDP/income losses almost inevitably deeper, but given the shock to households and the additional failures of many firms, there is little or no reason to think that the specific 1918 result in this Fed/MIT paper would be of general applicability to lockdowns like those in New Zealand. It might turn out to be so, but nothing in the paper really gives us any specific reason for confidence – and it should not be cited to that end by our Prime Minister. That is all particularly so because – as the Prime Minister herself noted on RNZ this morning – even if we manage to largely stamp out each new outbreak, the disruptions, restrictions and uncertainties are likely to be with us for some considerable time.
(In addition, it is worth noting that nothing in the paper offers any insight on, say, whether the Australian approach at present is likely to produce better/less-bad economic results, over say a 1-2 year horizon, than the New Zealand approach. Again, I am not taking a view on the answer to that issue, but it is where (say) Treasury officials and ministers should be concentrating some of their analytical resource right now.)
The Prime Minister doesn’t appear to have been referencing the other paper I wanted to write about. It is a short piece by several of my favourite economic history/crisis authors trying to look at some of the longer-run economic consequences of pandemics, back to and including the Black Death.
Here is the key bit of the abstract
Significant macroeconomic after-effects of the pandemics persist for about 40 years, with real rates of return substantially depressed. In contrast, we find that wars have no such effect, indeed the opposite. This is consistent with the destruction of capital that happens in wars, but not in pandemics. Using more sparse data, we find real wages somewhat elevated following pandemics.
They look at twelve “major pandemics”

It is a pretty heroic effort to make what they can of the very limited data. But it is worth bearing in mind that dreadful as these events must have been for those directly affected, only two stand out as likely to have been large enough to have had the substantial macroeconomic effects that the fragmentary data might support: the Black Death (which killed probably a third of the population) and the Spanish flu (bad as it was still on a much much smaller scale).
And I’m not sure the experience of the Black Death is likely to be very enlightening at all. As is, I think, fairly well understood, in an economy where land and labour were the two main factors of production, and in an early economy where most adults worked because they had to to live (no widespread concept of retirement), if you take out a third of the available labour, returns to the remaining labour (wages, for the moderate proportion of the population who were wage labourers, rather than tilling their own – or rented – land) were likely to rise, and returns per unit of land were likely to fall. And that that is exactly what happened in the standard reading of the evidence, which the authors of this paper share, noting a doubling of real wages and a sharp fall in rates of return on land, effects that persisted for decades.
The authors produce results suggesting that a pandemic has the effect of lowering the natural rate of interest by up to 2 percentage points, effects unfolding over to a maximum effect 20 years out. They contrast this to the effects of major wars

I guess my first caveat is that none of the results are statistically significant over the first 10 years (beyond that not only do connections inevitably become more tenuous, but even the more recent events often overlap). And while authors try to distinguish a pandemic from a war by arguing the destruction of physical capital stock in wars, my impression- perhaps wrongly – is that that destruction is far from universal. Take, as an example, the war in the West in World War One. I guess there was a great deal of physical destruction in north-eastern France and parts of Belgium, but almost none in the UK, much of France, Germany, let alone Canada, Australia, New Zealand and the United States. World War Two, of course, was different, and yet our most destructive modern war was also followed by a sustained period of pretty low real interest rates (by most standards other than the last few years).
More specifically, if we try to think about the current situation, the strategies being adopted by all or almost all advanced countries at present are based on the assumption that the total death toll can be kept very low (relative to anything like per capita death rates in 1918 for example). If that proves to have worked, we will – mercifully – have lost few people (and those mostly not in the labour force) and yet taken on huge amounts of new debt, especially public but also private. Next to none of the capital stock will have been scrapped/destroyed either, and the capital stock is not now fixed natural resources, but reproducible/scalable machines, ideas etc, and who knows what dynamic the political/economic policy process will yet loose upon us.
None of this is to criticise the paper. I’m glad the authors put it together for us to read. But however much light is shed on some past events (and collections thereof) I’m a little sceptical that we can garner much insight on how some of those key economic variables will be affected by this coronavirus and the policies being adopted to fight it, and to counter some of the worst of the individual and firm level economic losses. In fairness, the authors’ own final words are “this time may be different” (although even then it isn’t clear whether this is economists’ irony – it is a standard dismissive response to people trying to explain why this time will be different – or a real uncertainty: quite probably the authors aren’t quite sure either).

Estimating the growth rate of a geometric process is extremely difficult and even tiny assumptions about starting conditions can lead to massive differences that cumulate rapidly through time.
I’m surprised Rodney thought they had the skills and knowledge to do this – I’m guessing they don’t – and even more surprised the PM chose to use their figures instead of figures from academics in one of our University medical schools (or even the Math department).
LikeLiked by 1 person
Rodney has had an epidemologist on his staff working on this stuff, using std techniques from the epidemic literatures.
But agree re your point about who the PM chooses to cite on points like this. She does tends towards opportunism.
LikeLiked by 1 person
Nice reference to Òscar Jordà, who also co-authored a great paper on bank capital
Click to access w23287.pdf
LikeLike
The second thing I noticed about the dot graph was the y axis – from 1914 to 1919. Guess what happened within that period? The war. In 1917 over 2 million working age men signed up to the USEF. 320,000 casualties: 53,402 battle deaths, 63,114 noncombat deaths and 204,000 wounded. The Spanish flu killed about 25,000 of this force – perhaps included in the non-combat deaths. In 1919 the US labour force was around 42 million, so the return of the USEF and its 2 million+ would have had only a small impact, the number of casualties being around 0.75% of the labour force. But is the war itself a confounding variable that the authors comment on?
LikeLike
They do also run the basic equation for manufacturing employment as a per cent of the population (so not just absolutes). There is probably no particular reason to suppose that the war affected these individual cities differently, in a systematic way, related to their NPIs, but…..the war, and the rather limited high frequency data, is a big issue in getting to the bottom of how the flu, and NPIs, affected economic performance, in the midst of the waves and later.
My impression is that they did the best they could with what they had in the time available. It is users trying to translate results into something relevant now who need to be particularly cautious
LikeLike
Somewhere this weekend I read the aim of our level 4 lockdown is not just to ‘flatten the curve’ or to delay most cases until we have more supplies or even a cure but to eradicate Covid-19 from NZ. An irradication other developed countries cannot hope to achieve. This does make our heavy handedy shutdown more understandable. If with luck we achieve it we will stop comparing ourselves with Australia and European countries and start comparing our border controls, testing, etc with Tonga.
LikeLike
The language is often a bit hazy but as I understand it ‘eliminate’ here means something like “stamp out each and every outbreak as and when it arises”. The big problem of course is that hardly any of us would have any immunity, so the strategy still appears to rely on either a vaccine or a virus mutating into something less dangerous.
LikeLike
That is my interpretation. NZ with virtually no immunity and also with near enough zero cases – so back to religious services and sports games and public transport and no masks. It would require universally available testing and effective quarantine and it would last until a cheap vaccine is available worldwide. So interactions with Australia and the rest of the world would almost stop but we could fly in and out of a few select Pacific Island nations.
Not a high probability since either a vaccine could appear earlier than expected or we simply fail to stamp it out. But makes for an interesting possibility – NZ back to living normally but with minimal international flights, no foreign students, no new work visas, plenty of local sport but no international sport, Shortland St back on air but most international films and TV abandoned, teenagers kissing and hugging, New Zealanders becoming care workers, fruit pickers, Uber drivers, etc and generally regaining respect for real work. Leaving NZ the envy of the mask wearing world.
GGS is right we could take our pick of the best Chinese students and their wealthiest tourists but it would take some effort to persuade the average New Zealander to trust China’s medical statistics. Isn’t Germany planning a certifcate that proves you have had and recovered from Covid-19 and are therefore safe? Judging by current stats that would rule out most of the developed world since there are only one million proven cases out of a world population of eight billion.
We might know if elimination as well as control was one of the reasons for our current lockdown when the govt provides its carrot and stick plan(s) for leaving level 4. Will there be two plans – one with the elderly effectively under eternal house arrest (as per level 3 & 4) and one where we can return to dancing?
LikeLike
Do note that even in that relatively rosy scenario there would be a hugely high level if unemployment, very little business investment, and (I suspect) a rapidly fading public willingness to tolerate huge fiscal deficits.
(It might, of course, still be close to the best we could do, altho sorting out the RB and getting int rates a long way down would further limit the damage.)
LikeLike
Thinking more about it, our methodology is hardline Chinese. The base assumption could be we would be the first in line to open up for Chinese students and china tourists which means we need to be able to match the timimng of China’s reopening by being able to guarantee the safety of the Chinese. Perhaps that is the thinking behind this exceptionally hardline approach. It does mean we would be more tied to China economically.
LikeLike
I’m reading The New Class War – Saving Democracy From The managerial Elite, by Michael Lind.
As for China being first. Given housing and tourism experience, I don’t think New Zealanders are too happy about that. Asia NZ Foundation reported that 41% think immigration from Asia will have a positive impact. Those with most knowledge (for example speak an Asian language) are likely to be most positive. People are getting notices about “restructuring”. Who will be employed first?
LikeLike
Oh yes. She would be that cynical.
LikeLike
Hi Michael. Mario here. do you have time to talk.
LikeLike
I would be loathe examining per capita growth rates in cities during that time. Three recession during that time makes it problematic at best I would have thought.
A bit harsh on your PM.
She would be taking advice form her bureaucrats.
LikeLike
The bureaucrats, unfortunately, are almost equally worrying: there has been a sustained degrading of public service capability over the last decade or two that means there are no few significant figures of substance in the major ministries (let alone the RB).
(As i noted, her comments on the Fed paper will almost certainly have reflected either something she got from officials, or a snippet she happened to see. I certainly would not expect her to be reading the paper herself.)
LikeLike
At least hers was a better snippet than the ones President Trump has proposed.
LikeLike
What is equally striking is a complete disappearance of the local government figures. Do they have no role to play at all?
LikeLike
Reblogged this on The Inquiring Mind and commented:
Another interesting post from Michael Reddell and again with some good comments in the thread. I would draw readers specific attention to comments in the post and the thread regarding the model developed by Rodney Jones, which was used by government in it’s claims on Friday.
LikeLike
Pertinent comment seen on interest.co.nz today
“The coronavirus emergency is probably temporary. The bailout looks like forever”
LikeLiked by 1 person
True of wars too I guess. If not forever, then for a couple of decades anyway,
LikeLike
Lets see what Global Diary Trade auction brings us…….
LikeLike
An economics lesson from the past. Worked for a major public company. We had a team of talented finance professionals. Six of us joined together and entered a team in the “Business Game” run by IBM. Contestants ran a virtual company. Up against 12 other contestants run over 12 weeks. Entrants were given a base business case and submitted a weekly decision. Increase/decrease marketing, production, capital expenditure etc. We beavered away diligently for the 12 weeks. At the conclusion the results were published in the NZ Herald. Shock-and-awe. We cam last. We ran out of cash. We learnt a serious lesson from that.
Don’t see much of the “Business Game” being promoted these days. Although it is still around. Now it is digital, online and immediate
That is what the NZ Government is doing by providing $50 billion cash
LikeLike
Where do I find the ‘rodney’ paper
LikeLike
[…] Michael Reddell notes, albeit as a passing comment, this regarding Adrian Orr’s Sunday Star Times article […]
LikeLike