One very slight side-benefit to the savage collapse in economic activity that began a little over a month ago is that we now know, with a great degree of certainty, when the last business cycle ended. In the quarterly series that we mostly rely on in New Zealand the peak will have been the December quarter of 2019.
The nice thing about knowing when the cycle ended is that we can then look at the full cycle and see how things went over that full period, encompassing the previous recession and recovery and more recent years of relative normality. And we can compare the most recent business cycles with the previous couple. In time, we will be able to do some useful comparisons with other countries and see how our business cycle compared with those of other advanced countries, but it will take a while for all the relevant data to turn up in OECD databases, so this post is almost all about New Zealand.
If we use as the basis for dating business cycles the period from peak to peak in real GDP – which seems reasonable for New Zealand, absent a business cycle dating committee – the last cycle ran from 2007q4, the previous peak just prior to the domestic recession and global crisis, to 2019q4. That is a fairly long growth phase for New Zealand. It was interrupted by a “double-dip recession” in the second half of 2010, but people tend to discount such dips for these purposes because GDP had not yet got back to pre-recession levels before that modest setback took place.
What of earlier periods? The official quarterly New Zealand GDP series only go back to 1987, and official quarterly population series only starts at the beginning of 1991. So here I am going to focus on comparisons only with the cycle that ran from 1990q4 to 1997q3, and the cycle from 1997q3 to 2007 q4 – so all peak-to-peak comparisons.
(It is worth noting here that there will be revisions to the data for several years to come, probably most substantially after the annual national accounts for the year to March 2020 are produced at the end of the year – coronavirus permitting. But there is no obvious reason at this point to suppose the GDP numbers are biased one way or the other.)
Here is average annual growth in real per capita income for the three full business cycles.

Allowing for terms of trade effects improves the picture for both the 97 to 07 cycle and the most recent one, but doesn’t do much to close the gap between the two: the latest cycle just wasn’t that good.
What about productivity? You’ll recall that my preferred labour productivity measure is real GDP per hour worked, in this case using both measures of GDP (production and expenditure) and both measures of hours (HLFS and QES). Here is the same chart for that series.

As it happens the average rate of productivity growth for the last five years was even lower than for the full cycle. And this in an economy starting (a) so far behind the OECD leaders, and (b) therefore less affected by any slowdown in productivity growth at thre frontiers.
What about foreign trade? Our ministers and officials like to talk up our commitment to open trade and all the special trade deals they like negotiating.
But here are exports and imports as a per cent of GDP.

Highly successful economies tend to be ones that, for their size, export and import a lot. We don’t. (It isn’t a great starting point for a time when quite a bit of trade is going to be disrupted by the coronavirus, perhaps for several years to come.)
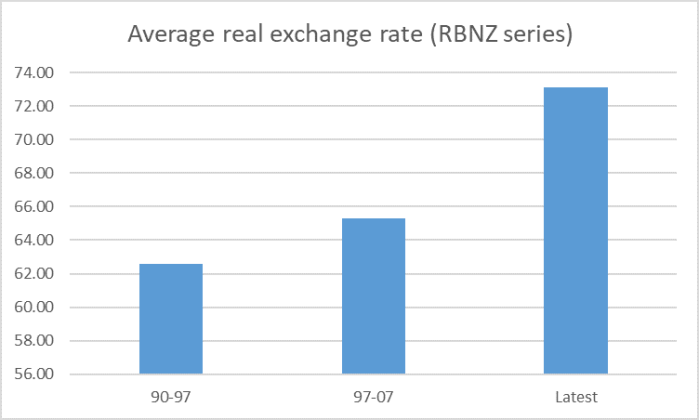
The poor overseas trade performance may have something to do with whatever mix of factors delivered us such a high real exchange rate.
I couldn’t help myself and did take a quick look at how other OECD countries had done on the headline growth numbers, in per capita terms. Here are the top ten OECD countries
Avg ann % growth in real GDP per capita: 2007q7-2019q4
Poland 3.4
Lithuania 2.8
Korea 2.4
Hungary 2.1
Slovak Republic 1.9
Latvia 1.7
Estonia 1.6
Israel 1.5
Chile 1.4
Czech Republic 1.3
Every one of those countries started the business cycle well behind the productivity leaders, and gained ground relative to those countries over the 12 years.
On this particular metric – real GDP per capita – we didn’t do too badly, in that we more or less matched the performance of one of the leaders (the US), which had been at the epicentre of the crisis at the time of the last recession. There isn’t cross-country comparative data for productivity growth for the full period yet, but – using annual data – for the eleven years to 2018, our productivity growth lagged behind most of the OECD leaders, including the United States. For us, the gaps to the leaders – opening out for 60 years or more now – have just kept widening further.
Sadly, whether in the latest speech from the Minister of Finance or what little we’ve seen from the Opposition, there is nothing to suggest any major party contesting this year’s election is going to offer an alternative that might make a real difference for the better. Amid the coronavirus implosion I’m guessing productivity failures won’t even get much attention this election. But they should, and any serious recovery plan should go hand in hand with a strategy that has some credible chance of finally beginning to reverse decades of failure. Turning inwards and looking more heavily to the state is most unlikely to be such an answer.
