Earlier this week the OECD put out a useful little note Evaluating the initial impact of COVID-19 containment measures on economic activity.
It is less than five pages long, including a couple of charts, and isn’t even attempting to offer definitive answers. And what it offers isn’t an assessment of the impact of the differing containment measures being adopted in each country, but of the likely impact of the initial economic structure of each country’s economy to a set of common assumptions about the extent of containment and associated changes in economic activity. Thus when, as local media have reported, this chart shows that New Zealand is one of the most adversely affected economies
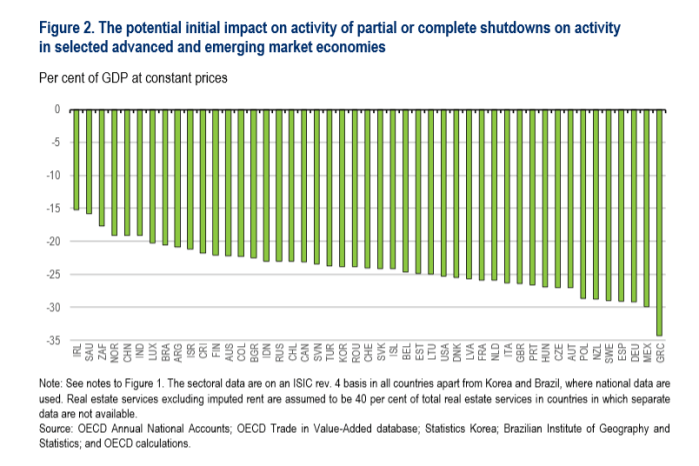
it isn’t telling you anything about the impact or intensity of New Zealand policies, but simply about the pre-existing structure, given the (common across countries) assumptions OECD staff make about which sectors are most hit as containment measures take hold. We don’t have many high-tech online services firms and, on the other hand, we have a lot of construction and a lot of production accounted for by tourism. (If you are wondering about Ireland – far left – remember that GDP in Ireland is massively inflated by some of the corporate tax distortions, and the loss of national income will be much larger than is shown here). I was interested in the number of central European countries close to us on the chart, which appears to reflect the importance of the motor vehicle manufacturing and supply chains in those economies (and Germany), and of course car sales – and production – have collapsed.
It is also important to remember that these are direct effects only. That might not much affect the cross-country comparisons but will affect the absolute magnitudes of the likely falls in activity. On the numbers in the chart, the direct effects alone crunch GDP by about 25 per cent for the median country shown. Indirect effects, including confidence effects, credit availability effects, uncertainty effects, income effects and so on will probably amplify these numbers greatly. I struggle to see how a fairly extensive lockdown will not reduce GDP while it is in place by up to perhaps 60 per cent (I noticed the comments yesterday by the chair of ANZ Bank in New Zealand, John Key, who was using numbers of that sort of order of magnitude). Measurement is going to be a huge challenge – and it may be several years down the track until, say, SNZ can offer us fairly definitive estimates (especially in the absence of quarterly income – profits – data) – but reality (even if not accurately measured) is more important than whatever the published headline numbers. Even in most industries deemed “essential” activity levels are going to be very significantly reduced (not many new mortgages being written for example, production capacity in meat works reportedly half what it was in norma times, and so on).
The OECD’s second chart – using the expenditure approach to GDP – is consistent with these sorts of really large numbers. It focuses on consumer spending (rather than total GDP), and they show estimates for only a few countries.
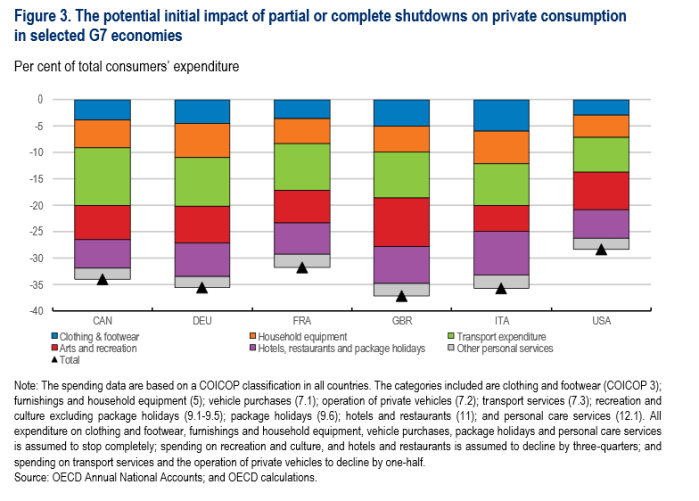
Read the footnotes, and if anything these look as though they could be underestimates, at least in a New Zealand context (eg pretty sure car use here has dropped by more than half, and hotel/restaurant spending by more than three quarters (since all restaurants are closed and hotels must have little more than a few residual stranded tourists).
Of course, imports will be lower, which offers some offset. But so are exports, most notably our tourism and business travel exports. And, in any properly measured sense, a fair bit of public consumption spending is going to be affected too – teachers might be getting fully paid, but no one supposes school online is going to be anything like the extent/quality of the normal product.
And then there is investment. Last year, almost 24 per cent of GDP was accounted for by investment spending (gross fixed capital formation). 60 per cent of that in turn was construction (residential and other). None of that is happening this week. Very little of any other investment spending will be occurring either, whether because it is simply illegal for firms (or bits of government) to operate or because of the extreme uncertainty of the environment, sharp reductions in forecast demand, or whatever.
It is difficult to get anything like a fully comparable estimates of the extent of the “containment measures” various countries have taken, partly because there are so many dimensions to most countries’ restrictions (and in places like the US, restrictions are at a state or county level), and because whatever the headline how the rules are applied in practice also matters (who knew, for example, the Arobake’s luxury baked goods counted as “essential”?). But relative to at least the other Anglo countries – with whom we often compare ourselves – New Zealand’s partial lockdown seems to be more extensive. If so, the immediate economic costs here are likely to be greater, especially as – first chart – if the OECD rough and ready analysis is right then our production structure meant that for any given set of restrictions we were more exposed than the other Anglo countries.
That isn’t a commentary (at all) on the merits of the extent of the New Zealand lockdown. It also isn’t a commentary on whether a tougher approach now will, or won’t, reduce the overall economic costs across time (there are a couple of papers around on that latter issue which I will try to write about next week). It is simply to make the point that many of the estimates that are around for the extent of the fall in New Zealand’s GDP – including the sorts of numbers the Ministe of Finance alluded to at the select committee on Thursday – still seem on the light side. We don’t have monthly GDP data (they have such estimates in Canada and the UK) but if we did then for the period of the current partial lockdown I’d have thought you would have to struggle to produce estimates of a fall as small as 50 per cent.
