The Treasury this morning released a report to the Minister of Finance offering several scenarios for how the economy might develop over the next few years. Before getting into the substance, there are a few points worth noting:
- these are not forecasts, but are best seen as conditional projections (mostly on unchanged macro policy – fiscal and monetary – and then various different assumptions about the extent of the (a) the policy restrictions, and (b) the state of the world economy,
- note that “unchanged fiscal policy” here includes the fact that the current wage subsidy scheme expires in June (in fact, much of what will be paid has already been paid, since it is a lump-sum scheme from government to firms),
- two of the scenarios allow for some fairly significant additional government spending,
- none of the scenarios seems to explore different assumptions about the how the private sector responds (all the variation arises from government anti-virus measures only),
- none of the scenarios really seems to explore the economic implications of a mitigation strategy
- with one exception, the scenarios all seem to have real GDP back to around the previous path (HYEFU 2019 forecasts) by the year to June 2024.
These are the five basic scenarios, all with unchanged macro policy.
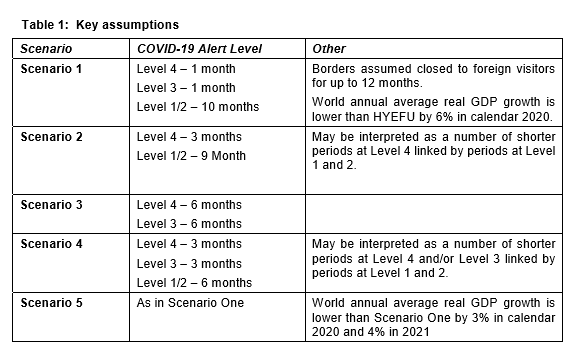
I noted in my post this morning that it was relatively easy to get to forecasts of a 20-25 per cent fall in GDP in the June quarter even on assumptions that the restrictions are wound back relatively promptly after next week, and that I was surprised how (relatively) modest many of the falls forecasts by bank economists had been. I was, therefore, pleased to find that on The Treasury’s scenario 1 they project that GDP would fall by 25 per cent in the June quarter. They are perhaps a bit less pessimistic than I am on how much smaller the economy is under the current Level 4 – they assume 40 per cent while my stab in the dark is 50 per cent – but relative to many of those other private sector forecasters I was encouraged to see where they had got to. In this scenario, Treasury projects that GDP would be back to 90 per cent of normal by the September quarter. That seems excessively optimistic (when overseas tourism alone accounts for 5.5 per cent of GDP). On their telling, alert level 1 – borders still closed, world economy still pretty deeply depressed – only results in a loss of New Zealand GDP, relative to normal, of “5-10%”. Perhaps.
I reckon The Treasury is generally understating the scale of the world economic losses. But Scenario 5 deals with that in part – scenario 1 locally, but with a deeper and more protracted world economic downturn. The 9 percentage point hit to GDP growth in calendar 2020 and 4 percentage point hit in calendar 2021 seems more in the ballpark of what Treasury expects to see for New Zealand (across the range of scenarios). In scenario 5, however and somewhat remarkably, the unemployment is only 10.5 per cent by the June quarter of next year despite no material further policy support/stimulus. That would be a surprise.
Unsurprisingly, the very worst economic outcomes are under Scenario 3 – six months of “Level 4” and six more months of “Level 3”. On that scenario, the unemployment rate is 22 per cent a year from now, with GDP having fallen another 23.5 per cent in the full year to June 2021 relative to the June year 2020.
As I said earlier, Treasury does not explore differences in assumptions about how the private sector respond. And at this stage they don’t seem to provide any information on how quickly they’ve assumed foreign travel (inward and outward) would revive. The document is what it is, but I hope they will before long offer some more detail as to how they are thinking about such issues/risks.
The paper is written up in a way designed to make the government and the Reserve Bank pretty happy. As I’ve said, the five basic scenarios assume no further macro policy support. That is without precedent in a post-war New Zealand recession, when monetary policy would usually be eased very very substantially, and the additional stimulus that easing provides is part of what gets the economy back towards full employment as fast as possible. In these scenarios the exchange rate does not fall far at all . And the Treasury makes no mention of the Reserve Bank’s refusal to cut the OCR further or deal with the physical cash related constraint on just how far they could usefully cut right now. And they have bought into the idea that the Bank’s announced large scale asset purchases are easing monetary conditions relative to what is implied normally by an OCR level of 0.25 per cent. That is, at best, a heroic assumption, and even much of the Bank’s own commentary has talked in terms of the announced asset purchases limiting a tightening in overall monetary conditions.
Frankly, with no additional macro policy support at all the base scenarios, which assume a return to full employment by the year to June 2024, seem optimistic to say the least. There is, for example, no mention of how many years it took to get back to full employment after the much-milder 2008/09 recession, even with the support of big cuts in interest rates and the demand impetus from the Christchurch repair and rebuild process.
Still on monetary policy, Treasury publish the inflation forecasts consistent with their scenarios and with unchanged monetary policy. In none of those scenarios does inflation get back up to even 1.5 per cent until the year to June 2024 (whereas Treasury had been forecasting inflation at around 2 per cent from here on out). In all the base scenarios inflation drops below 1 per cent – in some cases goes negative – in each of the next two years. There is, then, the small matter of real interest rates – which will be rising, since Treasury assumes no change in nominal rates. That represents another downside risk to the economic outlook.
As I noted, all those base scenarios assume current announced policy only. That includes the expiration of the wage subsidy scheme in June. I don’t suppose anyone really expected that the government would simply let the scheme run off, with nothing to replace it, in June. If they were to do so, it is likely that the measured unemployment rate would go much higher.
So The Treasury offers us two more stylised scenarios. Under scenario 1 (the optimistic one about how quickly alert level restrictions are eased) they toss in another $20 billion of fiscal support aimed at households and businesses. This variant boosts GDP by 2 per cent over the next year but – somewhat remarkably – lowers the unemployment rate by 3 percentage points. This is the somewhat heroic scenario in which the unemployment rate peaks at only just over 8 per cent and is back at 5.5 per cent by the middle of next year.
Under scenario 2 (see above) we have two more months at Level 4 restrictions and only then drop back to levels 1/2. In a variant, The Treasury throws in another $40 billion of idscal spending. Despite the much-worse backdrop, this package is assumed to raise GDP by 4 per cent but only lowers the unrmployment by 3.5 per cent. Again, the unemployment rate is only 6 per cent by June next year – all thanks to the power of fiscal policy. After the last recession, supported by monetary policy and the rebuild, it took five years to get the unemployment rate down by a full two percentage points.
As a final observation, as far as I can tell there is no allowance in any of the scenarios for future fiscal policy tightening, even in those with much much more fiscal stimulus frontloaded. Given the likely level of public debt that will emerge from all this, it seems unlikely that by 2024 there would be no pressure for a tighter fiscal policy to start lowering again the ratio of public debt to (normal) GDP. After all, bad as this crisis has been, all the arguments – about vulnerability to future shocks – used to support low levels of debt in the last 25 years will be just as valid then as they ever were. And if fiscal policy is tightening, and monetary policy – here and probably abroad – is assumed to be doing little, it is even harder to see how we get back to full employment relatively quickly.
It is much better to have the scenarios than not to have them. The important differentiation they attempt to illustrate is between different levels of government restrictions on economic and social activity. But the basic level of shock underlying them all still looks as though it is a bit optimistic – less perhaps about the June quarter (though see above) but about things like the pervasive level of economic uncertainty that seems likely to persist (and be reflected, for example, in a willingness to invest and to lend). Perhaps one way of seeing that is to do the thought experiment of what if domestic interest rates were assumed to fall by another 500-600 points (and some associated fall in the exchange rate). Then the speed with which economic conditions get back towards normal in these scenarios might have seemed more plausible – consistent with past serious recessions. As it is, it looks a bit as though they have – consciously or not – assumed away some of the severity of the problem, in turning keeping the spotlight off the Reserve Bank and off their Minister who has the power to compel the Bank to act. Monetary policy is supposed to be the primary stabilisation tool. Failure to use it – going off gold – greatly exacerbated the Great Depression; failure to use it now (getting wholesale interest rates materially negative) risks greatly exacerbating this slump.
