Earlier in the week I saw somewhere some charts drawn from the OECD’s Social Expenditure database, so I went to have a look. In this database, and an associated report, the OECD attempts to gather reasonably consistent cross-country estimates of (what they describe as) social expenditure. In this case, the numbers exclude spending on education (other than early childhood spending).
This is the first chart,
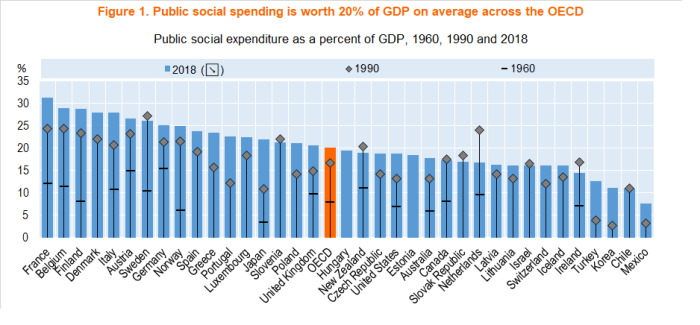
This is direct government spending on such things (health, unemployment and disability benefits, active labour market policies, age pensions and the like). There probably isn’t much very surprising in the 2018 ranking themselves, although a few things caught my eye:
- in among the European countries with above-median spending Japan now appears. Not that long ago Japan had relatively low rates of government spending (share of GDP) but now it is higher than all the English-speaking countries,
- among those English-speaking countries the Irish numbers are very misleadingly low because of the way features of the corporate tax regime have led measured GDP in Ireland to far outstrip the “true” level of economic activity occurring in Ireland, let alone the income accruing to Irish residents.
- New Zealand was very close to being the median country in 2018.
- and, whether or not one approves of such high levels of social spending (and I’m pretty uneasy) it should not be overlooked that among the nine largest spenders (share of GDP), seven are in the top-tier OECD group for average labour productivity (exceptions being Finland and Italy). I’m not offering any thoughts about causation (and other very high productivity countries – US, Ireland, and the Netherlands – below the median), but it remains a data point one has to take seriously.
And, of course, the other thing that is striking is how much social spending as a share of GDP has increased. Perhaps 20 per cent of OECD countries have such spending a bit lower or much the same as in 1990 (New Zealand is one of them – in 1990 the NZS eligibility age was still 60 and the unemployment rate was rising rapidly in the midst of our disinflation and restructuring), but in most countries there has been an increase even since 1990. For the countries for which 1960 data were available, the increases have been very large in every single country – although Japan (still pretty poor in 1960) stands out.
Interesting as these charts of direct public outlays are, they can be only part of the picture. If the government compels you to save, or compels you to buy medical insurance, or offers tax treatments that incentivise such private spending, the differences between public and private spending can quickly get rather blurry. Switzerland, for example, has a low share of public social spending but requires everyone to take out medical insurance. That might, or might not, be a better system, but it means that low-ish direct public spending numbers don’t always tell a simple small-government (or self-reliant) story. This isn’t a big issue for New Zealand, but here is the OECD’s attempt to reflect some of these different institutional arrangements and produce some bottom line estimates of net social expenditures (apologies that it is a little hard to read – you can click here for a more legible version). The orange dots are the ones to focus on.

On this measure, the Netherlands and the US move a long way to the left (on the chart), only just behind France. Switzerland (and Australia) also move a long way to the left. Of the English-speaking countries, only Ireland now ranks below New Zealand, and that is just because of the tax-system distortion to the GDP numbers (done as a share of net national income, Ireland would spend more on social expenditure than New Zealand).
There are all sorts of quibbles possible about these numbers, including how safe it is to simply add them up (to what extent are the components really apples and oranges?), but it is probably salutary to note that there is now a stronger alignment between income/productivity levels and net social expenditure as a share of GDP than was evident in the first chart. Countries towards the right of the chart are (almost entirely) the poorer and less productive OECD countries, and countries to the left of the chart tend to be the richer/more productive OECD countries (the outliers being Greece and Portugal). Whether or not one approves of high rates of social spending, it is at least consistent with the story that much higher productivity gives countries, and individuals, options (practical and political) that poorer and less productive countries don’t have. That might be something for our political officeholders – increasingly indifferent to New Zealand’s productivity failure – to reflect on.
And don’t think you can put the cart before the horse – in general, raising social expenditure won’t do anything much to raise (and may even lower) medium-term average economywide productivity.

Unfortunately we have a communist government intent on Robin Hood wealth distribution policies. Steal and plunder from those that have and give it away to those that are too lazy to take the risks to run their own businesses. Even the traditional communist countries, China and Russia have moved away from such command and control wealth distribution policies.
LikeLike
So the $27 trillion US TARP loans to insolvent banks and the (comparatively) paltry $800 billion US fiscal stimulus post GFC was a paragon of free-market operational practice? Didn’t the Government just post a $5b fiscal surplus by taxing more than spending? I’m not saying they intended to do that but the fact that this was their policy makes them slightly less conservative than the previous government and the Greens slightly less conservative again by wanting a fiscal surplus but by 2022. The government and foreign sectors running fiscal surpluses against the private domestic sector assures a recession if the private domestic sector can’t or changes its desire to fund the fiscal deficit by borrowing.
LikeLike
Given that the $5.5 billion fiscal surplus was reported in October 2018 for the reporting period 1/4/2017 to 31/03/2018 and the Labour government just rolling off all the hard work put in by the previous government over the last 9 years, it is rather lame to try and attribute the surplus to a Labour/NZfirst government who has been busy planning to spend up big.
The big ticket spending have yet to be registered on the books for Shane Jones $3 billion vote buying in the regions that he is freely dishing out and mulching trees instead of planting the $400 million paid for trees. Also the timing of some of the planned spending – including big capital spends in health, education and transport have yet to register on the books.
LikeLike
A fiscal surplus from stealing the wealth off the hard work put in by business owners is not being conservative. It is still a Robin Hood theft by communists, that are now in charge of our government.
LikeLike
Not at all sure where US Tarp loans to fund insolvent banks relate to NZ communist ideals by Comrade Jacinda Ardern and Comrade Grant Robertson? The US has always been about intervention, regime change etc to further US interests. Not too sure where you got the idea that Americans are about a free market. It is about free market access for US companies but restricted access by everyone else, ie Make American businesses great always.
LikeLike
getgreatstuff. So which is it, a) the fiscal surplus was an outcome of the brilliant economic management of the previous government and if so b) it was therefore a result of that same government ‘Robin Hood’ taxing the hard work of business owners? If ‘a’ is correct, then it must be a result of ‘b’ and therefore the previous government are just as communist as this one if not more so.
LikeLike
Good fiscal management of $5.5 billion reported by Comrade Grant Robertson was for the period 1/4/2017 to 31/03/2018. Labour/NZFirst came into power in September 2017 and started appointing 152 working groups before going off on holidays and returning back to parliament in February 2018 to do any work.
So clearly that fiscal surplus must be associated with the previous government that worked hard over 9 years to get to that surplus. Just because it was reported by Comrade Grant Robertson later in October 2018 does not make it the work of the Communists now in charge of the Labour government.
LikeLike
We had communism under national too.
LikeLike
Some level of social welfare is always needed as the price of maintaining peace. But the current communists in charge, Comrade Jacinda Ardern and Comrade Grant Robertson is taking theft of individuals wealth to a shocking new level.
LikeLike
Some level of social welfare is needed because otherwise we would be barbarians. I found tax a bigger imposition when I lived in the UK under conservative govts than I do in NZ.
LikeLike
Very interesting post. I am sympathetic to the line of causation drawn here, that more productivity gives nations more options for social spending, but forcing myself to think of the counterfactual another possibility exists. The nations with higher public sector social spending (would infrastructure spending be counted?) satisfy the savings desires of the private domestic sector, who can’t get their nationally denominated tax credits from anywhere else. This leaves a surplus to be invested in productive social outcomes (part of which are economic) which sees them move to the right of your chart. Japan’s private domestic sector savings desires post 1990 property crash drove the public sector spending that you allude to, ie. the public sector running fiscal surpluses or not large enough fiscal deficits would have led to a recession as they withdraw too many yen tax credits from the private sector to satisfy both savings desires and investment for productivity.
LikeLike
What about countries like Singapore that have a rather significant company superannuation contribution of 15% that eliminates the need for the Singapore government to contribute towards social welfare spending on poverty stricken retirees?
This is a fairly high productivity nation but that productivity is derived from Singapore being a major regional financial hub where trillions of dollars are transacted through Singapore by all the major corporate banks around the world with computer servers that require a few dealers to transact billions of dollars and the associated transaction revenue derived.
LikeLike
Good points. To sum up – fix our productivity and you’ll have more cash for addressing well-being.
Not to mention, if you fix productivity there’s a higher chance everyone will be better off than now, social spending remaining constant.
LikeLiked by 1 person
Correct
LikeLike
In the meantime whilst trying to theorize and fix our productivity let’s lend a practical helping hand to others less fortunate. I have signed this petition to allow this family to stay in NZ.
Thousands of people have signed a petition to allow a Ukrainian family denied residency permission to stay in New Zealand.Nataliya Shchetkova and her husband Alex Derecha arrived here six years ago with three children on a long-term business visa to develop a large restaurant. They also had twins while in New Zealand.They invested in the La Vista, a popular restaurant in Auckland’s St Heliers, and now employ 17 full-time staff – up from nine when they bought it.
But Immigration NZ says the business does not add enough benefit to New Zealand by creating sustained and on-going employment over and above the existing level of employment.
https://www.parliament.nz/en/pb/petitions/document/PET_83798/petition-of-don-campbell-allow-the-shchetkovas-owners?signed=true
LikeLike
I feel a sense of unease with these statistics. Unfortunately, I am not informed enough to get into the details of how these productivity figures are tabulated. But your observation that those with high social spending/taxation have higher productivity does not mesh with economic theories and expectations.
Using the BS detector test, this seems absurd. Do those countries count public sector ‘production’ towards their GDP, thus inflating their measures.
Countries like Sweden have higher GDP per capita/productivity than NZ. But when you compare per capita income after taxes, NZ does relatively well and countries like Sweden do poorly. Nordic countries on the face of it, do not have superior health and education services outcomes than NZ. The US has higher per capita GDP, but high health costs (paid after taxes) are counted towards per capita income but there are no real outcome benefits relative other western countries. They spend 20% of their GDP on health compared to 8-12% for other Western Countries. Should US GDP per capita be adjusted down by approximately 10% to account for the waste? Is it analogous to natural disasters adding to nominal GDP but a hit to national wealth- An artifact of our measures?
Countries with relatively high after-tax income are high income, low tax countries, like Singapore. Visiting there, I would say they have relatively high standards of living and disposable income. I cannot say the same about European countries. I have the sense that GDP per capita is skewed favorably to EU countries but it is not translatable to everyday experiences.
LikeLike
You cant correlate macro-economics with micro-economics. It will do your head in
LikeLike
Of course you can correlate a thing with anything. Michael has even managed to correlate immigration with the NZD exchange rate without any correlation studies.
LikeLike
Increasing productivity provides the capacity for government to increase social spending
conversely
Decreasing productivity reduces the governments capacity to increase social spending
Isn’t that what Bill English did for 9 years for the purpose of finally achieving a surplus in his final year
“That might be something for our political officeholders to reflect on.”
Doubt it somehow
LikeLike
Correction
Reduced productivity must reduce the amount government can spend on social spending – surely
LikeLike
To be fair Bill English had to deal with a RBNZ engineered recession, a GFC, a Christchurch Earthquake and a Kaikoura Earthquake, and an over achiever Chris Finlayson who kept settling Waitangi Tribunal claims to the tens of billions each year.
LikeLike
Comparing US and NZ the difference is private provision. I which case while there may be high average productivity, if there are also a large chunk of poorly paying jobs those people just won’t benefit? Which is what Sir Paul Callaghan urged re industry’s like wine and tourism. In our case tourism props up the property-construction/banking/finance [” “] sector?
LikeLike
Certainly Air BnB is taking up residential space. However I find the students domestic and international having a more significant impact on property rental vacancy factor .
LikeLike
A University the size of the University of Auckland has seating capacity for 40,000 students and that’s just one institution.
LikeLike