A commenter on yesterday’s Brexit post raised the question of how Europe (EU, euro area or whatever) had done overall relative to the rest of the advanced world. The question sparked my interest, not just about the last 20 years or so (since the euro was created, and the comparison in yesterday’s post) but about somewhat longer spans of history.
At around the turn of the 20th century no one would have doubted that Europe dominated the world geopolitically, and it no longer does that. That geopolitical rise was built on technology and associated economics, but just because the geopolitical moment has passed doesn’t necessarily mean the economic one has.
But who to compare Europe with? Relative to the situation 100 years ago, some east Asian countries (in particular) have caught up considerably. In most respects that is to be welcomed, and doesn’t tell one anything particularly enlightening about the performance of western Europe. And some (most?) of the European countries that aren’t in the EU are nonetheless in agreements with the EU that mean that in many respects the policy regimes are similar.
And so here I’ve focused on a comparison with the European “offshoots”, notably the Anglo-shaped ones (the United States, Australia, Canada, and New Zealand), but with some reference also to Argentina, Chile and Uruguay. Prior to World War One, Europe may have been the geopolitical centre of the world, but individuals in the typical offshoot countries enjoyed a better material standard of living than their peers in western Europe.
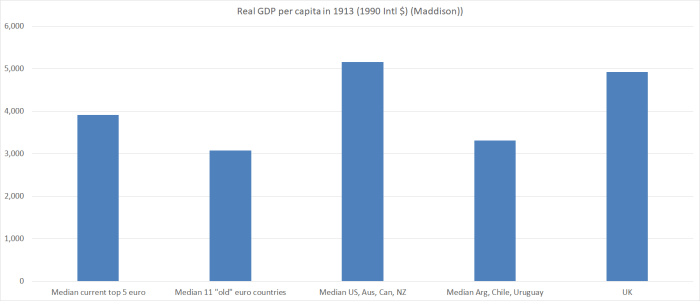
The first two columns are the group of 11 western European “established” euro area member countries in yesterday’s post, and a subset of those that I’ve got interested recently (France, Germany, Belgium, Netherlands, and Denmark) which today have much the same level of average labour productivity as the United States.
In 1913, the Anglo countries were top of this particular economic heap, and the western European countries weren’t much different than average living standards in Argentina, Chile and Uruguay. In 1929 and again in 1955 (allowing some time for recovery from the war) the picture still wasn’t so different. The five top European countries were doing better and the UK a bit worse, but average GDP per capita in the 11 European countries group was only about 10 per cent higher than those in the Uruguay, Argentina or Chile group.
And here is the same chart for 2017, using Conference Board data.
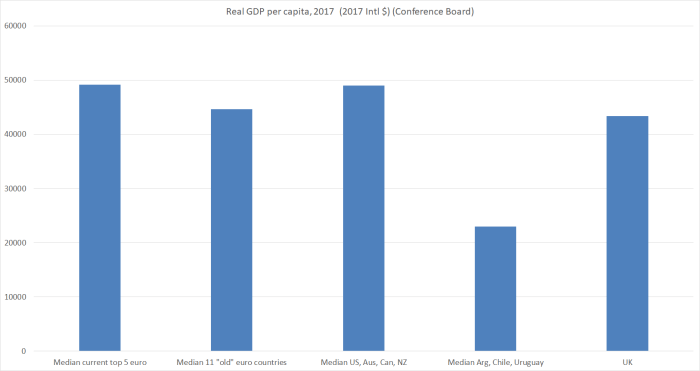
It doesn’t take too much study to see where the (relative) decline has been centred: the European offshoots and the UK. The picture is most vivid for the southern cone countries in Latin America, but isn’t less real for the Anglo countries. It isn’t that, as a group, they’ve been surpassed by continental western Europe, but that western Europe has caught up. (Since this isn’t a New Zealand-centred post, we will quickly pass over the way those countries now outstrip New Zealand.)
But what about some time series charts for more recent periods? In this chart I’ve shown the same two European groupings relative to the median for the Anglo offshoot countries (US, Australia, Canada, and NZ) using OECD data which start in 1970.
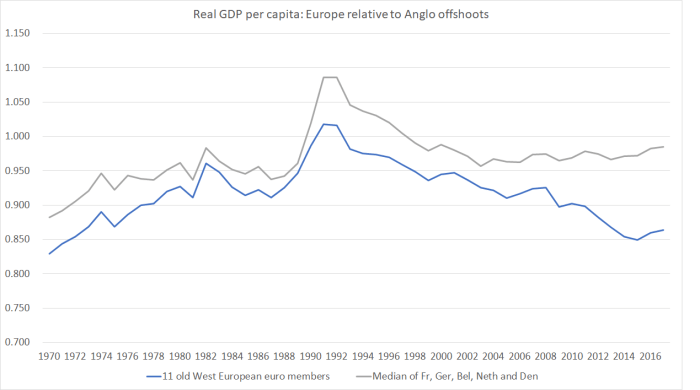
(I don’t quite know what was going on around 1990, although I guess it is probably about the recession in many of the Anglo countries).
Over the full period since 1970, Europe has gained ground relative to the Anglo offshoots, on both groupings. But there is, of course, a big divergence in the two series in the last decade or so. For the top-5 north European countries, performance has remained pretty strong. The median of those five countries now has average per capita incomes almost equal to those of median Anglo offshoot country (and, as it happens, the Europeans work fewer hours per capita to achieve that outcome). But for the wider group, things have gone badly into reverse – the influence of the poorly performing tail (Greece and Italy in particular, but also Spain and Portugal).
What about a similar chart for productivity? The OECD doesn’t have labour productivity data for the whole period for Austria and Greece, so in this chart those two countries drop out of the comparison.
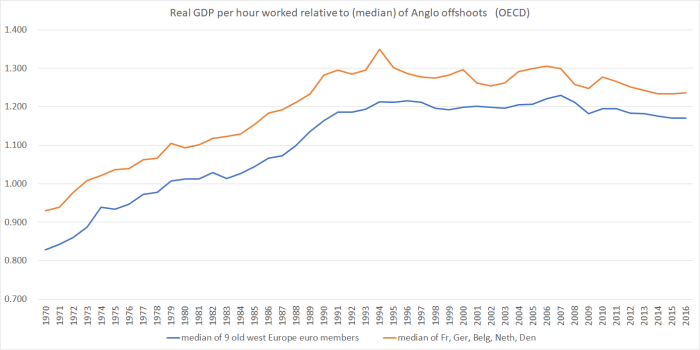
It is a somewhat different picture. The cylical effects large drop away, but (not unrelatedly) so does the marked difference between the two groups of euro-area countries over the last decade. On this measure, Europe’s labour productivty growth has fallen behind that of the Anglo offshoots grouping over the last decade (although not in the first few years of the euro). But perhaps the bigger story remains just how much average productivity in Europe has improved relative to that in the Anglo offshoots world over the whole period since 1970. It is a huge relative gain for (western) Europe.
And what of a simple comparison between the leading group of European industrial countries and the US? After all, if Europe has its laggard, the Anglo world has New Zealand (and Canada). Here’s that chart.
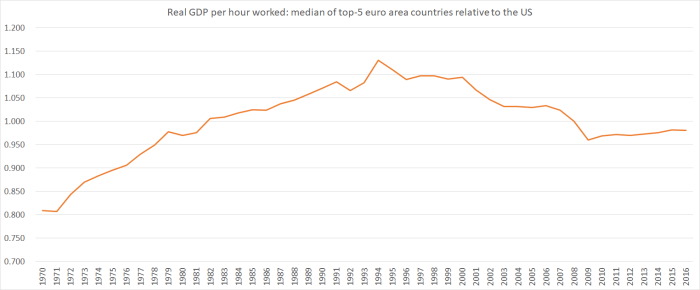
It is interestingly different. Relative to the US, these leading European countries did poorly last decade. But the underperformance hasn’t continued into this decade, despite the euro-area crises, even if little of the ground has been made up again. But again, taking the longer view, surely the bigger story is one of the improvement in Europe’s relative performance since 1970.
And of course, amid all of this there has been no mention of the rest of Europe, the bits that spent decades in the Soviet orbit, and weren’t beacons of prosperity prior to that. Many of those countries have been making progress in catching up with the Western European leaders even as, over longer runs of time, western Europe has been catching up with the (former) Anglo leaders.
And as one final chart here is snapshot of Conference Board estimates of the levels of labour productivity last year.
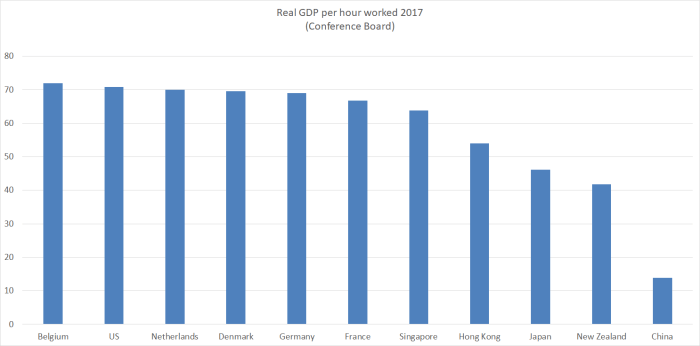
Five of the top six are European, even if Singapore is almost at the heels of the European leaders. (Ireland, Luxembourg, and Norway have higher numbers again, each with their own idiosyncrasies.) Below Singapore, I’ve just put in a few countries out of interest – China as much because on my walk this morning I listened to a podcast interview with a former European politician convinced that by 2038 China will dominate the world, and that this will mostly be a good thing.
Europe has had its good and its (very) bad times in the last 100 years or so, but when one looks at the data as a whole it is hard not to think that in economic terms Europe’s performance (and especially that of the northern European top tier) relative to the rest of the advanced world has increasingly been as good as it has been at any time since the New World was really opened up to trade and settlement. By contrast, over the last 100 years or so, of the New World countries only the US has more or less managed to hold its own matching or exceeding the leading group (per capita income and productivity) of European countries.
For New Zealand, Uruguay, Chile and Argentina – and even Australia – (the Antarctic Rim countries) it all seems to have proved just too hard.
