Here is a summary chart of the real GDP outcomes for the June quarter (expenditure and production), the hours outcomes (QES and HLFS), and the implied change in labour productivity (real GDP per hour worked), taking the average change in hours worked from the average growth in real GDP.
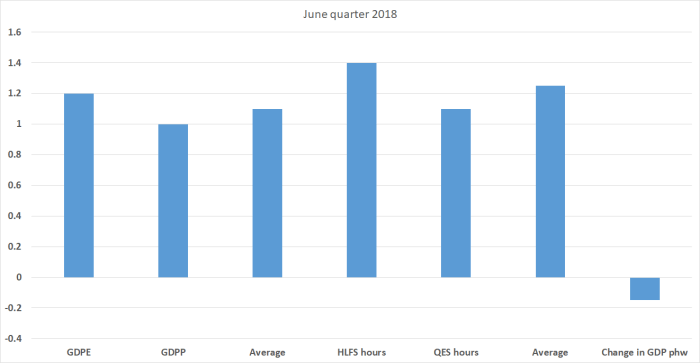
There was quite a bit more activity all round, but it took a larger percentage increase in labour inputs (hours) to get the published percentage increase in output (GDP). In other words, labour productivity fell: not just the growth rate, but the level.
Here is the same chart for the previous quarter.

It was worse: less GDP growth, but also an even larger fall in GDP per hour worked. Productivity growth for the first half of the year was -0.65 per cent. That isn’t an annualised number, but an absolute change; a significant fall.
Perhaps you think this just shows how dreadful the new government is. Here is the same chart showing the cumulative growth rates for the last six months of last year (in blue) and the first half of this year (in orange).

To me, the similarities are (much) more striking than the differences. Importantly, the level of labour productivity fell in both halves.
Looked at from a productivity perspective – and that really is where one should focus, especially when the unemployment rate is not too far from the NAIRU – it is a pretty dreadful performance. Of course, simply looking at two six month periods on their own doesn’t tell one much, but nothing in these data is inconsistent with the poor productivity record for some years now.
And neither the last government nor this one appears to have any serious ideas for, or any serious interest in, fixing this failure.

Just been reading this: https://www.interest.co.nz/business/95935/stats-nz-says-gdp-surged-1-june-quarter-against-expectations-08-rise-biggest-increase#comment-1037755
with its headline: “”Stats NZ says June quarter GDP surged 1% against expectations of 0.8% rise; biggest increase in 2 years; size of the rise means OCR cuts may now be off the table””
So am I right in understanding it as ‘ we have produced more but had to work longer to do so ‘. And according to your figures the underlying productivity per hour has actually declined despite all the wonders of cheap modern phones, GPS, wi-fi, etc. And your figure of -0.65% is just for six months; most data is reported per annum so we ought to be reading the headline as “NZ Productivity drops be 1.3%”.
LikeLike
in the US they annualise. Here it would be fairer just to say productivity dropped 0.65% in the half year and 1.0% in the last 12 mths.
and of course it isn’t that we aren’t getting the technology, but that the economy is so skewed (overvalued real exch rate, high real interest rates (globally), limited opportunities, and lots more people) that it all washes out as falls in productivity. One shouldn’t make too much of any sinlge year – there are years’ where even NZ shows reasonable growth – but it is all consistent with long-term underperformance, and esp (in productivity terms) over the last few years.
People will, of course, say that productivity growth is weak abroad, and that is true – but we start so far behind there is no reason why developments at the frontier need constrain us from catching up.
LikeLike
So if I understand your data correctly if that -0.65% had been +60.00% we would be back where we belong.
LikeLike
pretty much (I think i actually use a two-thirds increase to get back to the frontier countries level, but you’ve got the gist)
LikeLike
Wow – dreaming of my superannuation bouncing from $308.03 up to $513.93 per week. Or my daughter with an annual pay rise of about $46,000; she would still manage to spend it but her student debt would disappear just like that and she could think about buying not renting. Another daughter would be able to contemplate having a second child. Money really can make a difference to the quality of your life.
You are right; it is surprising our politicians can only find other matters to discuss.
LikeLike
Please provide the meaning of the letters GDPE, GDPP, QES and HLFS what are these short for??
Thanks,
Jock Did you get our Greenhouse Gas paper??
Jock Allison,
LikeLike
Gross Domestic Product (expenditure and production methods – two different ways of calculating what should be the same thing), and the Quarterly Employment Survey and Household Labour Force Survey measures of hours worked. All variables shown are percentage changes.
I don’t think I got the paper you mentioned.
LikeLike
If that is the paper referred to in https://www.ruralnewsgroup.co.nz/dairy-news/dairy-general-news/water-blamed-as-big-planet-warmer then it will be an interesting read. As an interested layman it seems as if you are proposing a radical interpretation that disagrees with the massive concensus of climate scientists. Or to rephrase ‘I have my doubts’. However this is similar to the eviction of state house tenants which was based on a bad interpretation of science. Do we have a forum where your paper can be discussed rationally rather than tarred with the ‘climate change denier’ brush and ignored?
PS. On TV yesterday they said state tenants had been evicted on the basis of meth contamination equivalent to the average banknote. We should be grateful the govt has at last admitted its mistake (nb nobody sacked!) instead of confiscating our banknotes.
LikeLike
Given NZ population growth, a 1pp increase in GDP in Q2 is not that big of a deal as we need around 0.8pp to keep pace with the RBNZ measure of potential. So after four quarters of around 0.5pp we have a bounce. It really doesn’t change anything for the Bank. As they’ve been saying, they are focussed on Q3. If that doesn’t sustain then they have a problem…
LikeLike
Real GDP per capita grew 0.8% in the year to June 2018 – why does no one mention that? That is almost worthy of a rate cut rather than a rate rise?
LikeLike
From the graph over 1.2% more hours worked. To get back to top of OECD GDP per capita has to increase by about 65.00% and there are two ways of doing it: work more hours and increase productivity. There must be limits to how many more hours we can work. NZ is already doing well by having more retired people working than most developed countries and many of our low wage immigrants work massive hours to achieve the annual salary required for permanent residency.
LikeLike
As Michael often alludes to – there appears to be no proper cost benefit analysis done of policies. We are drowning in endless regulation and well intentioned but silly requirements and regulations.
Just one example is do we really need to put scaffolding all around a house to reroof it? How many injuries does that really prevent? Do we have a problem previously with people falling off roofs? I could go on and on and on with such examples.
LikeLiked by 1 person
They didn’t put scaffolding all round my single storey house less than a year ago. However when we went to a half day orchid show and asked ‘how much is a cup of tea?’ we were told that they could not sell it because they hadn’t got the hygiene certificate issued by the council and that they had been warned not to sell to the public. The cost of certification being way more than any funds they would raise. As usual actual health and safety was not affected beause thay gave us the cup of tea.
The picture of a classroom in yesterday’s Herald that had been destroyed because no teacher was permitted to man-handle a pupil makes you wonder if common sense has died in NZ. Maybe it will take a destructive child in Jacinda’s living room for our govt to prioritise prudent judgement over rigid regulation.
LikeLike
Hi Michael, I’ve just discovered your blog, great work and impressive credentials. I have a question regarding monetary policy and inflation. One of the goals of central banks is to keep consumer price inflation around 2%, therefore when we have deflation of prices due to technological advances and productivity gains (as we should), this is countered by other goods that inflate and monetary policy ensuring that on average prices are inflating at 2%That means the deflation due to all the good things (rather than from reduced demand) is balanced out and in fact reversed once averaged over the whole ‘basket of goods’. So let’s say wages also inflate at 2% that means that over time the ‘basket of goods’ will never become cheaper, your purchasing power will remain static over a generation. For example if we had a massive technology breakthrough (like the internet) that reduced the price of a lot of products, this would be seen as deflationary and countered so that we still had 2% inflation and therefore what you could buy would remain the same. I know I’m missing something, what is it? Thanks in advance.
LikeLike
Thanks Rob
I think what you are missing is in the “let’s say wages also inflate at 2%”. Over the long haul they won’t; rather wages will tend to increase at something like the rate of general inflation plus the rate of increase in productivity. In other words, if there is a massive positive technology/productivity shock and the RB acted to maintain CPI inflation near 2% then we’d expect to see wage inflation running much higher than 2% (employers would have lots of opportunities they were wanting to use labour for, and the competitive process would bid up the wages).
These are, of course, tendencies and long-term relationships, not a relationship that holds every year or even every five years (sometimes the labour share of GDP rises for prolonged periods and at other times it shrinks for prolonged periods) but given a shock of the sort you describe then, all else equal, that is the effect one tends to see.
As I’ve illustrated here previously, on at least one measure wage inflation in NZ in recent years has run well ahead of what could be justified by a simple inflation+ productivity model. (fourth chart in this post https://croakingcassandra.com/2018/07/24/consumption-investment-and-wages-inflation-in-new-zealand/)
LikeLike
When NZ household debt($179 billion) almost equal NZ household savings($174 billion), raising interest rates or dropping interest rates in Monetary Policy have no impact on overall consumption as one group benefits and the other group loses. Therefore interest rates need to be raised to an extreme level in order to damage the overall economy with the intentional loss of jobs in order for any effective impact on consumption. In other words, previous recessions in NZ were engineered by the RBNZ especially so in the 2002 to 2007 raising interest rates until the economy crashed in 2008 to 2009.
LikeLike