Yesterday’s post was prompted by looking at the export and import data in last week’s GDP release. Today’s is prompted by looking at the investment data.
The latest quarterly data wasn’t that interesting in itself – business investment fell a bit, but from quarter to quarter there is quite a bit of noise, and not much can be read into a single quarter’s data.
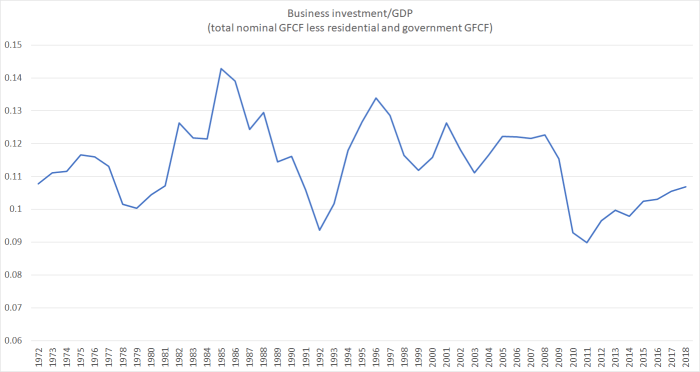
But here is a longer view on a proxy for business investment spending as a share of GDP (total gross fixed capital formation less residential investment less government investment spending), using the annual data back to the year to March 1972. The latest quarterly observation is almost exactly the same level as the final (annual) observation on the chart.

Years into the recovery, after several years of very rapid population growth, business investment as a share of GDP has crept back up to levels that are only higher than seen in past recessions. And by international (OECD) standards, business investment as a share of GDP has been low in New Zealand for decades. It is consistent with the story numerous analysts have highlighted over the years: one of the proximate symptoms of our long-term economic underperformance is that firms haven’t found it worthwhile to invest more heavily here. The last few years look as if they simply reinforce that story.
(And that isn’t, of course, because we have too many houses for our people. If anything, we have too few, so when people – like the Minister of Finance – talk of shifting investment from housing to other things, while not changing anything about population growth, it is meaningless or worse.)
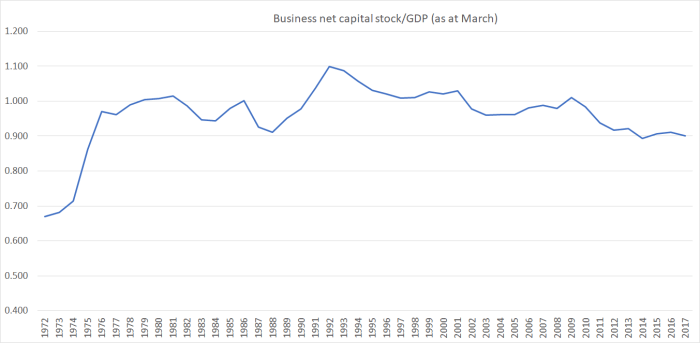
That first chart, which I’ve shown previously, is the flow – each year’s new investment as a share of total GDP that year. But this chart uses the stock figures: SNZ’s net capital stock (total less residential less government) relative to GDP. That takes account of depreciation, and also of the changing growth rate of the population.

The business capital stock (as estimated by SNZ) hasn’t been growing relative to GDP for over 40 years. Over most of the last decade that ratio has been shrinking (and although these data are available only to March 2017, it seems unlikely anything in the last 18 months will materially alter the picture). Businesses – as a whole – simply haven’t found it attractive to invest and grow here.
The government is very keen on promoting R&D spending, rushing to put in place new and bigger subsidies without much evidence of having thought much about why it might not be attractive to profit-maximising firms to spend more here.
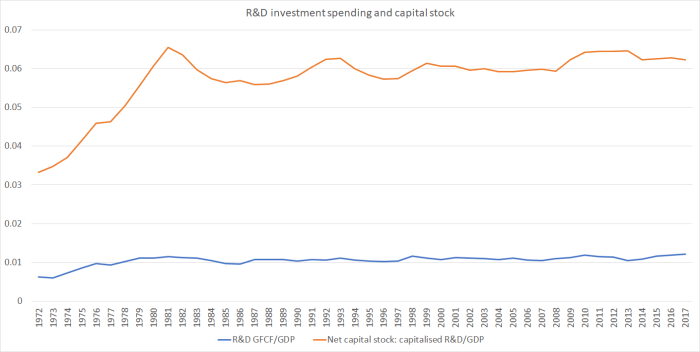
R&D is included in both the annual new investment spending shown in the first chart above and in the net capital stock data shown in the second chart. SNZ don’t provide a breakdown between government and private components, but for what it is worth I found this chart interesting.

If anything, R&D spending seems to have been holding up quite a bit better than overall business investment and the business capital stock. Which tends to reinforce my doubts about why more taxpayer money should be thrown at this type of spending. Overall R&D spending might be quite low by advanced country standards, but so is business investment more generally, and so is foreign trade. My hypothesis is that all three things are related, and that there is no obvious reason (and no analysis the government has advanced) suggesting that the root cause of the problem is insufficient subsidies for R&D spending.
On a completely different note, tomorrow I’ll take a lot at the latest from the Reserve Bank: Adrian Orr and the tree gods.