Consumption, investment and wages (inflation) in New Zealand

After writing yesterday’s post, I noticed another somewhat-confused article on the “low wage” question.  The author of that piece seemed to want to look at after-tax wages, without then looking at the services those taxes might deliver.   Taxes are (much) higher in France or Denmark, but so is the range of government services.

One way of looking at the material standard of living question is to look at per capita consumption, again converted using PPP exchange rates.   Just looking at private consumption –  the things you and I purchase directly –  will also skew comparisons.    Take two hypothetical countries with the same real GDP per capita.  One has much lower taxes than the other, but health and education in that country are totally private responsibilities,  whereas in the higher tax country many of those services are delivered by the government, largely free to the user at the point of use.    Private consumption in the low-tax country will be much higher than in the high-tax country, but the overall actual consumption of goods and services may not be much different  (depending on incentive effects etc, a topic for another day).

For cross-country comparisons, the way to handle these differences is to use estimate of actual individual consumption: private consumption plus the bits of government consumption spending consumed directly by households (eg health and education).  Separate again is “collective consumption” –  things like defence spending, or the cost of central government policy advice, which have no direct or immediate consumption benefit to households.

Here is the data for the OECD countries for 2016, where the average across the whole of the OECD is 100.

AIC 2016

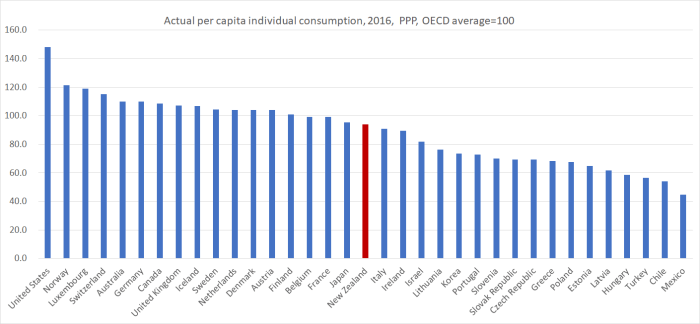
New Zealand does a little less badly on this measure than on the various income or productivity measures.  That is consistent with the fact that our savings rates tend to be lower than those in many other OECD countries and (relative to productivity measures) to high average working hours per capita.  On this measure in all the former communist countries now in the OECD the average person still consumes much less than the average New Zealander does.  Unlike many advanced economies, we have consistently run current account deficits.   Large current account surpluses –  Netherlands for example has surpluses of around 10 per cent of GDP –  open up the possibility of rather higher future consumption.

Having dug into the data this far, I decided to have a look at investment spending per capita.  I mostly focus on investment as a share of GDP, and have repeatedly highlighted here the OECD comparisons that show business investment as a share of GDP has been relatively low in New Zealand for decades, even though we’ve had relatively rapid population growth (and thus, all else equal, needed more investment just to maintain the existing capital stock per worker).   Here is the OECD data, for total gross fixed capital formation (“investment” in national accounts terms) and ex-housing (where there are a few gaps in the data).

investment ppp

You can probably ignore the numbers for Ireland (distorted by various international tax issues) and Luxembourg (lots of investment supports workers who commute from neighbouring countries).  But however you look at it, New Zealand shows up in the middle of the pack.  That mightn’t look too bad –  and, actually, was a bit higher than I expected to find – but when considering investment one always needs to take account of population growth rates.      Average investment spending per capita might be similar to that in France, Finland, or Germany, but over the most recent five years, the populations of those countries increased by around 2 per cent, while New Zealand’s population increased by 9 per cent.  Just to keep up, all else equal, we’d have needed much more investment spending (average per capita) than in those other countries.

Over the most recent five years, only two OECD countries had faster rates of population growth than New Zealand.  One was Luxembourg –  where, as far as we can tell, things look fine (lots of investment, lots of consumption, high wages, high productivity) –  and the other was Israel.  In Israel, average investment spending (total or ex-housing) was even lower than in New Zealand.  And as I highlighted in a post a few months ago, Israel’s productivity record has been strikingly poor.

But how has Israel done by comparison?  This chart just shows the ratio of real GDP per hour worked for New Zealand and Israel relative to that of the United States (as a representative high productivity OECD economy), starting from 1981 because that is when the Israel data starts.

israel nz comparison

We’ve done badly, and they’ve done even worse.

If productivity growth is the basis for sustained growth in material living standards –  and employee compensation –  how have wages been doing recently in New Zealand?

One way of looking at the question is to compare the growth in GDP per hour worked with the growth in wages.  If we look at nominal GDP per hour worked, we capture terms of trade effects (which can boost living standards without real productivity gains) and avoid the need to choose a deflator.  From the wages side, I still like to use the SNZ analytical unadjusted labour cost index series.  Perhaps there are serious flaws in it –  if so, SNZ should tell us – but, on paper, it looks like the best wage rates series we have.

Here is the resulting chart, with everything indexed to 1 in 1998q3, when the private sector LCI analytical unadjusted series begins.

NGDP and wages

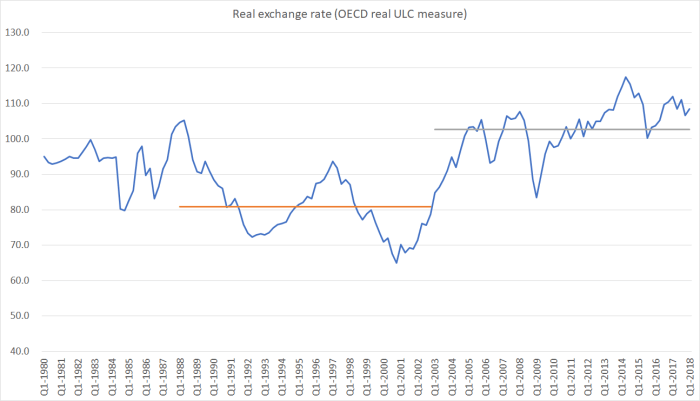
When the series is rising, wages (as measured by this series) have risen faster than the average hourly value of what is produced in New Zealand.  A chart like this says nothing about the absolute level of wages (or indeed of GDP per hour worked), but it does suggests that over the last 15 years or so, wage rates in New Zealand have been rising faster than the value of what is produced in New Zealand.  That is broadly consistent with the rebound in the labour share of total GDP over that period.  There is some noise in the data, so not much should be made of any specific shorter-term comparisons, but even over the last five years –  when there has been so much public angst about wages – it looks as though wage inflation has outstripped hourly growth in nominal GDP (even amid a strong terms of trade).    All of which is consistent with my story of a persistently (and, so I argue, unsustainably) out-of-line real exchange rate, notably over the last 15 years or so.

New Zealand is a low wage, low productivty (advanced) country.  We don’t seem to do quite as badly when it comes to consumption, but investment remains quite low (relative to the needs of rapidly growing population) and wage earners have been seeing their earnings increase faster than the (pretty poor) growth in GDP per hour worked.  None of that is a good basis for optimism about future economic prospects, unless politicians and officials finally embrace an alternative approach, under which we might see faster (per capita) capital stock growth and stronger productivity growth, in turn laying the foundations for sustainably higher earnings (and higher consumption).  Most likely, a key component of any such approach would involve finally abandoning the “big(ger) New Zealand” mythology that has (mis)guided our leaders –  and misled our people – for decades.

A low wage, low productivity (advanced) economy

There was an article on Stuff the other day from Kirk Hope, head of Business New Zealand, suggesting (in the headline no less) that “the idea [New Zealand] is a ‘low-wage economy’ is a myth”.   I didn’t even bother opening the article, so little credence have I come to give to almost anything published under Hope’s name (when there is merit is his argument, the case is almost invariably over-egged or reliant on questionable numbers).   But a few people asked about it, including a resident young economics student, so I finally decided to take a look.

Hope attempts to build his argument on OECD wages data.   I guess it is a reasonable place to try to start, but he doesn’t really appear to understand the data, or their limitations, including that (as the notes to the OECD tables explicitly state) the New Zealand numbers are calculated differently than those of most other countries in the tables.

The reported data are estimated full-time equivalent average annual wages, calculated thus:

This dataset contains data on average annual wages per full-time and full-year equivalent employee in the total economy.  Average annual wages per full-time equivalent dependent employee are obtained by dividing the national-accounts-based total wage bill by the average number of employees in the total economy, which is then multiplied by the ratio of average usual weekly hours per full-time employee to average usually weekly hours for all employees.

That seems fine as far as it goes, subject to the limitation that in a country where people work longer hours then, all else equal, average annual wages will be higher.  Personally, I’d have preferred a comparison of average hourly wage rates (which must be possible to calculate from the source data mentioned here) but the OECD don’t report that series  (and I don’t really expect Hope or his staff to have derived it themselves).   Although New Zealand has, by OECD standards, high hours worked per capita, we don’t have unusually high hours worked per employee (the reconciliation being that our participation rate is higher than average) so this particular point probably doesn’t materially affect cross-country comparisons.

The OECD reports the estimated average annual wages data in various forms.   National currency data obviously isn’t any use for cross-country comparisons, so the focus here (and in Hope’s article) is on the data converted into USD, for which there are two series.  The first is simply converted at market exchange rates, while the second is converted at estimated purchasing power parity (PPP) exchange rates.   Use of PPP exchange rates –  with all their inevitable imprecisions –  is the standard approach to doing cross-country comparisons.

Decades ago people realised that simply doing conversions at market exchange rates could be quite misleading.   One reason is that market exchange rate fluctuate quite a lot, and when a country’s exchange rate is high, any value expressed in the currency of that country when converted into (say) USD will also appear high.  Take wages for example: a 20 per cent increase in the exchange rate will result in a 20 per cent increase in the USD value of New Zealand wages, but New Zealanders won’t be anything like that amount better off.  The same goes for, say, GDP comparisons.   That is why analysts typically focus on comparisons done using PPP exchange rates.

But not Mr Hope.   Using the simple market exchange rate comparisons, he argues

OECD analysis however shows that NZ is not a low-wage economy. We sit in 16th place out of 35 countries in terms of average wages.

(Actually, I count 14th.  And recall that it isn’t many decades since we were in the top 2 or 3 of these sort of league tables.)

But he does then turn to the PPP measures, without really appearing to understand PPP measures.

But the OECD analysis also shows that among those countries our relative Purchasing Power Parity (PPP), a measure of how much of a given item can be purchased by each country’s average wage, is lower.

New Zealand is included among a group of countries – Australia, Denmark, Iceland, Norway, Sweden, Switzerland and the UK – where wages don’t buy as much as they could.

That’s right: Australia – where the grass has always been deemed to be greener, and Switzerland – which has long been lauded for its quality of life.

There are several possible explanations for wages in this group being higher than their PPP.

The Nordic countries have high tax rates, which support their social infrastructure but dilute their spending power.

We have lower tax rates – but the costs of housing, as an obvious example, are a lot higher in PPP terms than in other countries.

In PPP terms, the estimated average annual wages of New Zealand workers, on these OECD numbers, was 19th out of 35 countries.   The OECD has expanded its membership a lot in recent decades –  to bring in various emerging economies, especially in eastern Europe (the former communist ones).  But of the western European and North American OECD economies (the bit of the OECD we used to mainly compare ourselves against), only Spain, Italy, and (perpetual laggard) Portugal score lower than New Zealand.  On this measure.

But to revert to Hope’s analysis, he appears to think there is something wrong or anomalous about wages in PPP terms being lower than those in market exchange rate terms.  But that simply isn’t so.  In fact, it is what one expects for very high income and very productive countries, even when market exchange rates aren’t out of line.   In highly productive economies, the costs of non-tradables tend to be high, and in very poor countries those costs tend to be low (barbers in Suva earn a lot less than those in Zurich, but do much the same job).     Poor countries tend to have PPP measures of GDP or wages above those calculated at market exchange rates, and rich countries tend to have the reverse.  It isn’t a commentary on policy, just a reflection of the underlying economics.

Tax rates and structures of social spending also have nothing to do with these sorts of comparisons.  They might be relevant to comparisons across countries of disposable incomes, or even of consumption, but that isn’t what Hope is setting out to compare.

But he is right –  inadvertently –  to highlight the anomaly that in New Zealand, PPP measures are below those calculated on market exchange rates.  That seems to be a reflection of two things: first, a persistently overvalued real exchange rate (a long-running theme of this blog), and second, the sense that New Zealand is a pretty high cost economy, perhaps (as some have argued) because of the limited amount of competition in many services sectors.

But there is a more serious problem with Hope’s comparisons, one that presumably he didn’t notice when he had the numbers done.   I spotted this note on the OECD table.

Recommended uses and limitations
Real compensation per employee (instead of real wages) are considered for Chile, Iceland, Mexico and New Zealand.

Wages and compensation can be two quite different things.   If so, the comparisons across most OECD countries won’t be a problem, but any that involve comparing Chile, Iceland, Mexico or New Zealand with any of the other OECD countries could be quite severely impaired.   In many respects, using total compensation of employees seems a better basis for comparisons that whatever is labelled as “wages” –  since, for example, tax structures and other legislative mandates affect the prevalence of fringe benefits – but it isn’t very meaningful to compare wages in one country with total compensation in another.

Does the difference matter?  Well, I went to the OECD database and downloaded the data for total compensation of employees and total wages and salaries.  In the median OECD country for which there is data for both series, compensation is about 22 per cent higher than wages and salaries.     I’m not 100 per cent sure how the respective series are calculated, but those numbers didn’t really surprise me.   Almost inevitably, total compensation has to be equal to or greater than wages.   (There is an anomaly however in respect of the New Zealand numbers.  Of those countries where compensation is used, New Zealand is the only one for which the OECD also reports wages and salaries.  The data say that wages and salaries are higher than compensation –  an apparently nonsensical results, which is presumably why the OECD chose to use the compensation numbers.)

So what do the numbers look like if we actually do an apples for apples comparison, using total compensation of employees data for each country.  Here I’ve approximated this by scaling up the numbers for the countries where the OECD used wages data by the ratio of total compensation to total wages in each country (rather than doing the source calculations directly).

compensation per employee

On this measure, New Zealand comes 24th in the OECD, with the usual bunch behind us – perpetual failures like Portugal and Mexico on the one hand, and the rapidly emerging former communist countries on the other.  On this estimate (imprecise) Slovenia is now very slightly above New Zealand.  By advanced country standards, we are now a low wage (low total employee compensation) country.

But it is about what one would expect given New Zealand low ranking productivity performance.   Here is a chart showing the relationship between the derived annual compensation per (FTE) employee (as per the previous chart) and OECD data on real GDP per hour worked for 2016 (the most recent year for which there is complete data).  Both are expressed in USD by PPP terms.

compensation and productivity

Frankly, it is a bit closer relationship than I expected (especially given that one variable is an annual measure and one an hourly measure).  There are a few outliers to the right of the chart: Ireland (where the corporate tax rules resulted in an inflated real GDP), Luxembourg, and Norway (where the decision by the state to directly save much of the proceeds from the oil wealth probably means wages are lower than they otherwise would be).    For those with sharp eyesight, I’ve marked the New Zealand observation in red: we don’t appear to be an outlier on this measure at all.  Employee compensation appears to be about what one would expect given our dire long-term productivity performance.

And that appears to be the point on which –  unusually –  Kirk Hope and I are at one.  He ends his article this way

We need to first do the hard yards on improving productivity, and then push for sustainable growth in wages.

If we don’t fix the decades-long productivity failure, we can’t expect to systematically be earning more.  Sadly, there is no sign that either the government or the National Party has any serious intention of fixing that failure, or any ideas as to how it might be done.

Incidentally, this sort of analysis –  suggesting that employee compensation in New Zealand is about where one might expect given overall economywide productivity –  also runs directly counter to the curious argument advanced in Matthew Hooton’s Herald column the other day, in which he argued that wages were being materially held down by the presence of Working for Families.   In addition, of course, were Hooton’s argument true then (all else equal) we’d should expect to see childless people and those without dependent children dropping out of the labour force (discouraged by the dismal returns to work available to those not getting the WFF top-up).   And yet, for example, labour force participation rates of the elderly in New Zealand –  very few of whom will be receiving WFF –  are among the highest in the OECD and have been rising.

And, of course, none of this is a comment on the merits, or otherwise, of any particular wage claim.

Unpicking the inflation numbers

On the face of it, the CPI numbers released earlier in the week seemed quite noteworthy.  The Reserve Bank’s preferred sectoral core measure of CPI inflation is still clearly below the 2 per cent the Bank has been told to focus on, and was last at 2 per cent in the year to December 2009, almost a decade ago.  But the sectoral core measure has increased again, now up to 1.7 per cent, having averaged about 1.4 per cent (without a lot of short-term noise) for the previous five years.   If the trends suggested by this series continue, sectoral core inflation could be back to 2 per cent some time next year.

sec core infl to june 18

That would, all else equal, represent good news not bad (after all, three successive governments now have taken the view that a target midpoint of 2 per cent inflation is best for New Zealand).

But even on this series alone there is still some reason for caution.  The sectoral factor model filters the data, and the nature of the filter means the endpoint estimates (in particular) are prone to revision, and as the paper I just linked to illustrates there are margins of error around any of these estimates.  I’m reluctant to back away from the sectoral factor model numbers –  it has generally been quite a good guide in the years since it was introduced, and tells plausible stories about history.  But, equally, it doesn’t make sense to focus only on this one series.

For example, the CPI ex-petrol is a very simple core measure.  Petrol prices are quite volatile.

CPI ex petrol to June 18

And yet the latest observation in this series is still a touch below the average inflation rate for the previous five years (and at 1.2 per cent well below the target midpoint).  And that is so even though the exchange rate has been unusually high in the last 12-18 months (headline CPI is sensitive to changes in the exchange rate).

There isn’t much sign of rising core inflation being an issue abroad either.  Here is the OECD data on CPI inflation ex food and energy, for the G7 grouping as a whole, and the median of the countries/areas with their own currencies (thus the euro area, like the US, is just one observation).

OECD core inflation jul 18

Both series bounce around a bit, but there isn’t much sign of any sort of breakout to a consistently higher rate of inflation.  Even among the G7, the latest observations suggest that if US core inflation is edging up a bit, that in the UK and the euro-area is falling back a bit (Japan’s June numbers aren’t available yet).

New Zealand might be different of course.  It isn’t obvious why we would be – eg our unemployment rate hasn’t fallen away further or faster than those in most other OECD countries –  but we might.   Here is the NZ version of the same series: CPI inflation ex food, vehicle fuels, and household energy.

cpi ex nz jul 18 2

Indirect taxes and government charges also complicate the interpretation of the inflation numbers.  Weirdly, SNZ still does not publish a straightforward series excluding these effects, to give us a clean read on market prices.  It is not as if these are trivial issues either –  there was the GST increase a few years ago, there are large increases in tobacco taxes every year (which have had the effect of materially increasing the tobacco weight in the CPI), and there are changes in things like ACC levies and (this year) in government subsidies for tertiary fees.

Here are some individual exclusion measures.

cpi ex jul 18

And here is a series SNZ does publish: non-tradables inflation excluding both central and local government charges and tobacco.

NT ex govt and tobacco jul 18

That might suggest a moderately encouraging story, of core non-tradables picking up.  But even if so, it would be the third pick-up in the past five or six years, and neither of the previous ones amounted to much.   Perhaps this time will be different?

One reason to think it might be a little different is developments in housing inflation: construction costs and rents make up quite a substantial proportion of non-tradables.

housing components

Rents are a much larger component of the CPI (9.2 per cent) than construction costs of new houses (5.5 per cent) but most of the cyclical fluctuations are in the construction cost component.   Construction cost inflation has been dropping away quite markedly since the start of last year (and for all the talk of renewed waves of housebuilding –  which I rather doubt will happen) there isn’t any obvious reason to think that phase of the cycle will reverse soon.   Some of the earlier increases in core non-tradables inflation will have reflected increasingly high inflation in construction costs, but since construction costs have been slowing for the last 18 months, the latest pick-up can’t be simply written off as a construction story.  But, whatever the story, core non-tradables inflation of only around 2.4 per cent is simply not going to be high enough to be consistent with core CPI inflation getting back to 2 per cent.  We’d need to see further increases in core non-tradables inflation from here, and with the rate of growth of demand having weakened it isn’t yet obvious that that is the most likely outcome.

And what do the bond markets make of the situation?  Recall that there are two indexed bond maturities either side of the 10 year nominal bond.

IIB breakevens jul 18

There has been some drift high in the inflation breakevens, or implied inflation expectations, over the last 12 months or so.  But however one looks at things, it is hard to see the market pricing average inflation for the next decade much higher than about 1.6 per cent.  That is still a long way from the target midpoint of 2 per cent.

So where does all that leave me?    At very least, there is no sign that core inflation is falling and perhaps some reason to be encouraged, and to think it is picking up.   But however one looks at the numbers, current core inflation isn’t even close to 2 per cent, and by this stage of a long-running cycle (especially one characterised by weak productivity growth) one might have hoped –  even expected –  that core inflation might be running a bit above any target midpoint.   Notwithstanding the sectoral core measure, it seems too early for too much encouragement –  perhaps things are finally on course for a return to 2 per cent, but there are conflicting signs, and not too many compelling reasons to yet think that this time will be different.

What of the outlook?   With ebbing population pressures, weak business confidence, no fixes for the over-regulated and dysfunctional urban land markets, and various policy proposals that not only engender uncertainty but could act as considerable drag on actual and potential growth (eg net zero emissions targets), it isn’t obvious why core inflation is likely to rise from here.   Headline measures will, as always, be tossed around by oil prices developments (and petrol taxes), and a weakening exchange rate will push prices up a little.    Some might argue that public sector wage pressures, and higher minimum wage rates, will themselves contribute to higher domestic inflation.   Perhaps so, although I remain a bit sceptical that they will amount to much (even if there are some material relative price changes).   And, although no one knows when, the next recession is coming –  here and abroad.  From an inflation perspective, including positioning ourselves for the next downturn, we’d have been better off if the OCR had been a bit lower over the last couple of years

Official corruption, there and here

On holiday in the (remarkably for mid-July) sunny South Island, I was reading Dictatorland: The Men Who Stole Africa, by British journalist Paul Kenyon.  It is well-worth reading for anyone with an interest in Africa, or indeed in economic (under)development. Over 400 or so pages, it is a series of accounts of leaders of post-colonial African countries who enriched themselves –  typically almost obscenely so –  from the vast natural wealth of the continent.    There are exceptions of course; notably well-governed Botswana.   And there were countries where idealistic disastrous policies impaired the material wellbeing of the citizenry without any great personal enrichment of the leaders (Tanzania and Zambia under Nyerere and Kaunda are two examples).  But Kenyon’s focus is on a series of countries with abundant natural resources (oil or very fertile land in his particular examples), one or more brutal leaders, and, at very best, mediocre material living standards for their people –  think Congo, Zimbabwe, Nigeria, Equatorial Guinea, Libya, Ivory Coast (with the rather different, but equally bleak, Eritrea thrown in for good measure).  Eritrea may – the author reports – have abundant oil and gas, but the regime simply refuses to allow any exploration.   Looting by leaders and their cronies was too often a big part of the story –  billions in foreign banks, fancy houses in Paris, London and the like.  The way various Western companies –  oil companies notably –  acted as enablers of this evil is pretty unedifying too.

Many many books and learned articles have been written on failures of post-colonial Africa.  I’m not sure that any of the stories really persuade me, except perhaps in the most reduced-form sense: there were weak institutions for sure, but they needn’t have stayed weak; the boundaries of many countries were artificial at best, but a strongman (arguably necessary to hold some countries together) could have lived modestly, governed wisely, and so on.   And if one were to blame the colonial predecessors –  in some cases dreadful (think Leopold of the Belgians), in others not much better than indifferent – much of east Asia also emerged from (relatively shortlived) colonial rule at around the same time, and the small Pacific countries emerged even later.  Much of the Middle East emerged from Ottoman rule only a little earlier.   And if, indeed, there is a “natural resource curse” of sorts –  at least in the presence of weak institutions – there are places like Brunei or Norway (independent since 1905).

I spent a couple of years in Zambia, working as the economic adviser to the central bank.  Kenneth Kaunda hadn’t been overly brutal, and hadn’t much enriched himself.  But under his watch, his country’s economy and material living standards had been severely impaired nonetheless.  In the midst of the liberalisation/disinflation shakeout in the early-mid 1990s, per capita GDP is estimated to have been more than a third lower than it had been at independence in 1964.  In the “what might have been” file, the story was often told of how at independence Zambia –  rich in copper, and with abundant agricultural land and a small population – had had per capita GDP similar to (or a bit higher than) those in Taiwan or South Korea.   Zimbabwe had also been about as well-off as those two east Asian states, which themselves had only emerged from fairly brutal decades of Japanese occupation in 1945.   These days, Zambia and Zimbabwe “enjoy” per capita GDP between 5 and 10 per cent of those of Taiwan and South Korea.

Another way to look at Africa’s economic failure is to compare the growth performance with New Zealand. In 1960, New Zealand was still among the richer of the advanced countries of the world. Nowhere in Africa had estimated per capita incomes more than about half of New Zealand’s (South Africa and Algeria), and most had incomes not much more than a tenth of New Zealand’s.  As readers know, over the subsequent decades we have been among the worst performing of the advanced countries.  So beating New Zealand’s growth record over the decades since 1960, should have been easy.  But of the 25 African countries for which the Conference Board database had data (in PPP terms), only 7 did.   Taken as a whole, the continent couldn’t even manage to make gains relative to the advanced country laggard New Zealand.  Of the 18 east Asian countries in  the Conference Board database, every single one grew faster than New Zealand over the period since 1960.   Looting by Africa’s leaders is far from the only story, but at very least it was symptomatic of the wider failure –  as well as being morally inexcusable.

Official looting isn’t, of course, confined to post-colonial Africa. It is mercifully rare in New Zealand, but in the course of my holiday I stumbled on an extraordinary example from the early days of settlement,  In Nelson, we stayed in Blackmore Cottage, (the warmer version of) a house first built in the early 1850s for Edward Blackmore, who had been appointed by Governor Grey as Collector of Customs and sub-treasurer in Nelson.  The owner was keen to tell us the story.  Blackmore had started by lying about his qualifications –  claiming an Oxford degree when he’d done no more than qualified to matriculate (never even attending) – but that was just the start.  He appears to have collected customs duties (at the time, the bulk of regular government revenue other than land sales) and simply never passed the revenue to the government.  At the time, it appears, people appointed customs collector had to provide sureties or guarantors, but Blackmore never provided these either.  Questions were soon asked, repeatedly, but the mails were slow, and it appears that Governor Grey himself took Blackmore under his wing (when senior public servants started pursuing him).  By the time the incident came to a head a year or two later, Blackmore owed the Crown around 2000 pounds.   That mightn’t seem like much, but total customs revenue for the entire country in 1855 was 105000 pounds.

No one seems quite clear what Blackmore did with the money, but it was probably failed business ventures.  He’d even bought a couple of islands.  But whatever he did with it, there wasn’t much left by the time things came to a head.  You might suppose that he’d have been arrested and served a considerable prison sentence –  defalcation is no trivial crime. But, astonishingly, there were no legal consequences at all.   Instead, someone in the Nelson community apparently gave Blackmore ten shillings, and took over whatever assets were left, apparently with the intention of liquidating them and paying any proceeds to the Crown.  Ten shillings (or perhaps it was in addition to the fare) seems to have been enough for the Blackmore family to leave for Sydney, whence the law did not pursue them.  Blackmore was, reportedly, no more successful in Australia, running for a time (before it failed) a private school, at which two of Australia’s earliest Prime Ministers were educated.

The Blackmore affair seemed to create quite a stir.  There was a near-unanimous resolution in Parliament that Blackmore should be arrested, wherever he was.  There was a parliamentary inquiry into the failures of senior civil servants in dealing with Blackmore (the question was whether those civil servants should have their pensions docked.  But Blackmore was never arrested, never prosecuted. never punished.  Perhaps it was simply too embarrassing for some senior people?  Whatever the latter day failings of our leaders –  and they are many –  looting in office is almost unknown.

And with that post-holiday whimsy, I’ll start to get back to the regular round of posts.

When economists all agree

There was a new survey out last week from the European IGM panel of economics experts, about the recent proposal from the UK Labour Party to give the Bank of England an economywide productivity objective.  These were the results:

IGM productivity

Not a single economist in the panel seemed to think this was a good idea. Not one thought that central banks can make any material difference to productivity growth, except by promoting or maintaining macroeconomic stability.  Note that the question wasn’t just about monetary policy, and the Labour Party policy talks of the use of regulatory tools as well.

I share the view of the panellists, but it is interesting to see the answers coming through so strongly when the Bank of England itself (notably the chief economist Andy Haldane) has at times been quite vocal in arguing (drawing from this speech) that the costs of financial crises are large, and are either permanent or semi-permanent.    I’ve long been rather sceptical of that proposition (some arguments developed at the first link in the previous sentence).   Whether the respondents to the IGM survey connected the two stories I don’t know –  many would probably just have been running the conventional macro story that monetary policy is more or less neutral in the longer-run –  but the results are a useful reminder of just how limited monetary policy and banking regulation are in doing good, once one gets beyond the relatively short-term (perhaps three to five years).

It being school holidays, I’m taking a break and will resume late next week.   There are many things I haven’t got round to writing about so far this year, and I hope to put some of them high on the priority list in the coming weeks, including taxation.  For example, there are the officials’ papers for the Tax Working Group, in which it is recommended that rates of taxation on business incomes should not be lowered.    With such weak long-term rates of business investment, and low rates of productivity growth, you might have thought this was an obvious place to look.  But not, apparently, to the Treasury and IRD officials.  The bacillus of Treasury’s wellbeing approach has reached even into these background papers: lower rates of business taxation would, it is asserted, damage “social capital”.


The real exchange rate mattered in 1985, and it still does

In Christchurch tomorrow evening, Anne Krueger is giving the 2018 Condliffe Lecture.

Krueger is an eminent figure in economics, now in her 80s.  She had a distinguished academic career, specialising mostly in trade and development issues, and she also spent time as first Chief Economist at the World Bank, and then later (until 2006) as first deputy managing director of the International Monetary Fund.   (My lasting impression of her, as an international bureaucrat, was the day she declaimed at a Board retreat about the challenges the IMF faced as a small organisation –  at the time staff numbers totalled about 3000.)

According to Canterbury University

In the University of Canterbury’s 2018 Condliffe Lecture, Anne Krueger will explore the topic: “Is it harder or easier to develop rapidly than it was a half century ago?” in her talk on development and economic growth.

She will argue, we are told

“In this lecture, I shall argue that while the future is never entirely foreseeable, there are a number of considerations that point to greater ease of development now than in the past. These include: the diminishing rate of increase in populations in most low income countries; the fact that much more is understood now (albeit still imperfectly) about development (and especially how not to achieve it); that global markets are much larger; and obtaining information of all kinds is much easier.”

There are also some technological advances that make development easier: mobile phones; continuing discoveries of improved technology in agriculture; advances in materials sciences; and so on.

I hope a copy of her text is made available.

I’m not sure how often Professor Krueger has been to New Zealand, but there is a record of a visit in 1985, when she was at the World Bank.  She delivered a lecture under Treasury’s Public Information Programme, under the heading Economic Liberalization Experiences – The Costs and Benefits (if anyone wants a copy, it appears to be held in the University of Auckland library, but isn’t online anywhere).

As she noted

As a newcomer to the New Zealand scene, it would be foolhardy of me to attempt any assessment of the policies implemented in support of the New Zealand quest for economic liberalization.  It may be useful, however, to discuss what liberalization more generally is usually about, and to attempt to draw on the experience of other countries for lessons and insights that may potentially be applicable –  by those of you more knowledgeable about the situation here than I – in evaluating the progress of liberalization in New Zealand.

It is a very substantial lecture (18 pages of text), drawing on the experiences in previous decades of a wide range of other countries grappling with twin challenges of stabilisation (inflation, fiscal etc) and liberalisation..   The small bit I wanted to highlight –  which saddened me when I first read it a few years ago, and still does, from a “what might have been” perspective –  was about the exchange rate.

Two important lessons emerge from the Southern Cone [of Latin America] experience: failure to maintain the real exchange rate during and after liberalisation is an almost sure-fire formula for major difficulties and the defeat of the effort.  The reason for this is that a liberalization effort aimed at opening up the economy must induce more international trade; it is not enough that there be more imports, there must be more exports.  Since the exchange rate is the most powerful policy instrument with which to provide incentives for exporters, its maintenance at realistic levels which provide an incentive to producers to export is crucial to success.

and a few pages later she returns to the theme

“In particular, the exchange rate regime must provide an adequate return to producers of tradable goods, particularly to exporters”

At the time, this would have resonated strongly with senior New Zealand officials.  One of the starkest memories of my first year at the Reserve Bank, fresh out of university, was being minute secretary to a meeting in late 1984 attended by the top tiers of the Reserve Bank and The Treasury.  It was a just a few months after the big devaluation that ushered in the reform programme: senior officials were explicitly united in emphasising how vital it was to “bed-in” the lower exchange rate, and ensure that the real exchange rate stayed low.

You can see that 1984 devaluation in this chart of the real exchange rate I ran a few weeks ago.

ULC jun 18

In fact, the gains from the devaluation were swallowed up very quickly by inflation.    When we finally got on top of inflation, the real exchange rate did average lower for some time –  and during those years the tradables sector of the economy (and export and import shares) were growing relatively strongly.  But for the last 15 years, the real exchange rate has averaged even higher than it was prior to the start of the liberalisation programme.  It hasn’t been taken higher by a stellar productivity performance.

It shouldn’t be any surprise that the export and import shares of GDP have fallen back, and that there has been no growth at all in per capita tradables sector GDP this century.    Successful sustained catch-up growth –  of the sort New Zealand desperately needs – doesn’t come about that way.

Perhaps some attendee might ask Professor Krueger for any reflections on her 1985 comments about the importance of the real exchange rate in light of New Zealand’s disappointing economic experience since then.  And linking back to the topic of her 2018 lecture, can we now catch-up fast, having failed so badly to do for the last 30+ years?  Fixing the badly misaligned real exchange rate, a symptom of imbalances but which is skewing incentives all over the economy, seems likely to be imperative.  New Zealand just isn’t that different: wasn’t then, isn’t now.


Free speech, even for odd or obnoxious views

Last week the Mayor of Auckland, Phil Goff, announced –  using what powers isn’t clear –  that no venue owned or managed by the Auckland Council would be made available for hire by organisers for an event involving a couple of controversial Canadian speakers, who had been planning to visit New Zealand next month.

I’d never previously heard of the speakers, or the organisers.    When I looked them up, some of the views one or other has apparently propounded seemed, frankly, kooky.  Here, for example, is a (unverified) report of some of Stefan Molyneux’s views.

According to Jessica Roy of Time magazine, Molyneux argued that violence in the world is the result of how women treat their children, and that “If we could just get people to be nice to their babies for five years straight, that would be it for war, drug abuse, addiction, promiscuity, sexually transmitted diseases, … Almost all would be completely eliminated, because they all arise from dysfunctional early childhood experiences, which are all run by women.”

Odd, or even obnxious, as some or many of their views might be, they are quite at liberty to hold them, or express them.  And New Zealand audiences should be free to listen to them, whether to cheer, to heckle, or just out of curiosity.

No owner of a private venue should be under any obligation to rent out a venue –  or provide a media outlet – but councils should be a different matter altogether.   Council property is paid for by all the local residents and ratepayers, and when such venues are available for hire or use by private groups, there should be a strong and clear commitment that the political views of those who happen to be councillors, mayors, or council staff at the time won’t influence which groups are allowed to use such facilities for their functions/meetings.  There are plenty of causes around that individual people will count as obnoxious –  stances on a contentious issues such as abortion law is a good example, where either side tends to view the other in a very deeply hostile light –  and it isn’t for those who happen to hold office at a particular time to impose some sort of ideological litmus test on views that can be uttered in public facilities.    Such an approach would smack of the sort of authoritarian semi-democracies of Turkey, Russia, or Hungary –  where elections still take place, but those in power stack the field by denying access to the public square to views/people they find awkward, disagreeable or threatening.

The stance taken by Auckland Council staff and the mayor shouldn’t be tolerated, no matter how odd or obnoxious many of us might find most of views of Lauren Southern and Stefan Molyneux.  And plenty of views now regarded as mainstream, almost obligatory in “polite society”, would have been regarded as threatening or obnoxious only a few decades back.

A group of concerned people have got together to challenge the Auckland Council’s right to deny use of their venues.  It appears to breach the Human Rights Act, and is inconsistent with the (non-binding) New Zealand Bill of Rights.  I’ve pledged to donate to the fund being raised to seek a judicial review of the Council’s action.  I’d encourage you to think of doing so to, whatever your view (or none) of the substantive views held by Southern and Molyneux.  This issue –  effective freedom of speech –  should be one of those issues that unites people from left and right (and people in open support of this cause range from Don Brash to Chris Trotter), and nowhere in particular on the political spectrum, who care about a functioning democracy, robust debate, and who believe that ideas –  even obnxious ones –  are best debated, not suppressed by government agencies.

The website is……https://freespeechcoalition.nz

I have also encouraged the organisers to consider working with a sympathetic member of Parliament to seek to introduce, via the ballot, a private members bill, to require all local authorities and similar public entities (eg school boards of trustees) to adopt a hiring or facilities use policy that does not use judgements about whether those in control of deciding on facilities use happen to agree with any views that would be expressed or not. These are community facilities, and when made available for outside use, it should be clear that no ideological litmus tests can be applied.

Choices: New Zealand and the PRC

There was an article on interest.co.nz the other day from the New Zealand resident American geopolitical and strategic affairs consultant, Paul Buchanan.  In his column –  well actually even in the headline –  he argues that

New Zealand is facing a very tough choice between our security interests and our economic interests, and that choice may have to be made very soon.

This is, as he sees it, a choice between the PRC and that of the United States (and our traditional allies).

Perhaps, but I reckon Buchanan misunderstands the nature of New Zealand’s economic exposure to the PRC.  The economic interests involved aren’t those of the country as whole –  countries make their own prosperity – but rather of a relative handful of, perhaps politically influential, businesses (and universities)  And if there is a choice it is more likely to be between the sort of values and friendships that have guided this country for the last 100 years and more, and those of one of the most brutal aggressive regimes on the planet; a regime which, as this article highlights, is becoming worse –  more threatening to its own and others –  not better.  It should be no choice at all, unless our politicians are now quite without shame.  Values and beliefs –  the things that unite people, communities, countries, beyond just common material interests –  don’t appear in Buchanan’s story.

Buchanan sets up his article noting that New Zealand`s trade and security relationships had diverged.   He seems to present it as a matter of active choice, whereas I would see it –  at least on the trade side –  as a natural evolution.  There was no conceivable world in which the bulk of our firms` overseas trade (and it is firms that trade, not governments) would continue to be with UK counterparts, or even with Australian or US firms.   That is true in respect of both imports and exports.   Our previous position –  buying and selling from firms in a single dominant country –  was historically not the norm.   These days –  though you wouldn’t know it from Buchanan’s article –  our foreign trade is relatively unusually widely spread.  No single country’s firms –  not even the very largest or the very closest –  take or provides more than a quarter of our foreign trade.  And, unfortunately, our foreign trade is rather smaller, as a share of GDP, than it would be if our economy were more successful.   To the extent that one worries about trade with the PRC –  and some individual firms clearly should, having chosen to sup so large with the “devil – a much larger share of Australia’s trade is with PRC counterparts than New Zealand’s.

Buchanan presents New Zealand as caught on the horns of a dilemma, or as he puts it

…that makes the New Zealand’s stance more akin to straddling a barbed wire fence while standing on ice blocks rather than balancing between competing great power interests.

It seems he sees it as a choice because he has bought into the narrative, often promoted by the previous government, that somehow our (so-called) prosperity (weak productivity, shrinking tradables sector etc) owes much to the PRC.

On the one hand, the Chinese presence in New Zealand has been materially beneficial. But that has come with strings attached that are believed to compromise the integrity of New Zealand institutions. For its part, New Zealand’s Anglophone orientation has not recently paid similar material dividends even though it gives it a seat at the table in security meetings with our traditional partners.

But where is the evidence that, in anything other than a willing buyer/willing seller sense, New Zealanders as a whole have particularly profited from the relationship with the PRC?   Is there reason to suppose that more milk powder would have been produced, if PRC buyers hadn`t purchased it from New Zealand sellers?  It is a globally-traded product, and what isn`t sold in one place is sold in another. In that respect, it is a little like oil.   The same goes for many of our exports, which aren`t specifically designed from the Chinese market.  And no one supposes that the PRC is about to impose export bans on the sort of stuff New Zealand firms purchase from the PRC.

Trade is, generally, mutually beneficial, and so things that disrupt trade patterns are generally costly.  But the cost of any particular disruption can easily be overstated, especially in a bilateral relationship where total exports to a particular country (in this case, New Zealand to the PRC) total only around 5 per cent of GDP.   Dairy prices fluctuate from week to week and, quite a lot, from season to season.  On the other side, so do oil prices.  But economies have a lot of capacity to adapt, and instruments like monetary policy and a flexible exchange rate that help smooth the adjustment.  It isn’t always easy for particular firms –  but they’ve made choices about their exposures, and the failure to manage them effectively – but the focus of policymakers needs to be on the economy, and country, as a whole.

Buchanan sets up a looming almost inevitable choice, about rising US/PRC tensions (economic, but even more so strategic)

The question is therefore not a matter of if but of when and for/against who?

He offers this scenario of “going with” the PRC (although it isn’t entirely clear what specifically he thinks this choice would involve doing, or not).

Should New Zealand choose China, it will lose the security umbrella and suffer the diplomatic wrath of our most traditional and closest international partners. The consequences will be felt in a loss of trade and diplomatic ostracism, but most acutely in damaged security relations with other Western democracies. The Five Eyes listening posts in New Zealand will be dismantled and all of the highly sensitive equipment, to say nothing of archived records and stored data, will be removed under duress. This could prompt a revolt within the New Zealand intelligence community given its Anglophone orientation, and when coupled with “dark” influence operations by former allies could cause civil unrest amongst those disinclined to cast their lot with the Chinese. It could even lead to covert and overt hostile responses from jilted partners, who will likely discontinue military relations with New Zealand, including sale and supply of equipment. There will be a moment of national reckoning.

I`d certainly join any protests against such a choice – utterly morally reprehensible as it would be.  It would be akin to Marshall Petain treating with Hitler, with less excuse. It isn`t entirely clear why Buchanan thinks this opting for the PRC option is a realistic possibility though.   All he offers is economic coercion initiated by the PRC.

Should New Zealand opt to side with the US and its security allies, it will suffer serious economic losses as a result of Chinese retaliation. This has already been presaged by the PRC response to New Zealand’s support for the International Court of Arbitration’s ruling in favour of the Philippines in its dispute with China over island-building in contested waters, where state-controlled media editorials warned New Zealand over the consequences of siding against China (including in trade). More broadly, there is ample record of Chinese economic retaliation against countries that do not toe its preferred line on a number of issues, so New Zealand has both immediate and contextual reasons to see the writing on the wall.

This is all rather overwrought.   I’ve written previously about PRC attempts at economic coercion.   In a case that will have bothered the PRC far more than anything New Zealand could do, and where the PRC authorities had far more effective leverage, –  missile defence system being installed very close to the PRC – the central bank of Korea estimated an effect from PRC coercive measures of perhaps 0.4 per cent of GDP.

As I noted in that earlier post, a couple of industries –  one government-owned anyway (the universities) – have made themselves overly-dependent on the PRC.  A sudden stop on PRC students or tourists coming to New Zealand (the option that would hurt here and do least harm to PRC people themselves), would be very disruptive to those industries.  But those are risks they need to be managing –  and not just by persuading governments never to see anything upsetting to Beijing.     No matter what the PRC did, there is no sense in which the “writing is on the wall” for the New Zealand economy.   The next international recession –  whatever its cause – is more of an issue to worry about (especially as our authorities aren’t that well prepared).

So we can choose to abandon traditional allies, and abandon any interest in supporting democratic countries in the east Asia region, and in doing so abandon any sort of self-respect as a nation.  Or we could summon some self-respect, and perhaps give some lead (moral if not military) in pushing back against PRC intrusions abroad (including here specifically), and abuses at home.  But whichever choice our leaders ended up making –  and it should be no choice at all –  it isn’t one that seriously threatens our (rather attenuated) economic prosperity (let alone our physical security).

On which note, it was interesting to see that in a week the government had moved from being unwilling to name the villain in the South China Sea, to being a bit more explicit in the Strategic Defence Policy Statement released on Friday.  Even then, they can barely bring themselves to disapprove, and cloak there concerns in all sorts of rather laughable diplospeak such as the suggestion that “China is deeply integrated into the rules-based order”.  When it suits perhaps, but that is not at all the same thing –  what matters is the choices made when it doesn’t suit.  And those aren’t encouraging.

Also interesting to note the contrasts in the comments of two senior officials, one from New Zealand and one from Australia.  Our outgoing ambassador to the PRC, John McKinnon, was profiled in the Dominion-Post on Saturday.

Some have expressed unease over China’s expanding influence in the Asia-Pacific region. Canada’s Security Intelligence Service has claimed China is busy “co-opting political and economic elites” in New Zealand.

McKinnon makes it clear it is not a topic he will comment on; nor will he discuss current government policy towards China or the policies of the ministers he has served while in Beijing.

He also does not want to venture an opinion on whether China will move towards a more Western-style democracy.

“To understand the dynamic of what’s driving China now you have to understand where they’re coming from. It’s something they have to make their own decisions about and I can’t foreshadow what will happen.”

I’m enough of a bureaucrat to not encourage officials to speak out-of-turn openly. But clearly his masters also had no interest in him ruffling any feathers at all, even as the defence strategy document was being released.

And on the other hand, in his final days in his role, the outgoing head of the Australian defence forces comments thus

Defence chief Mark Binskin says Beijing’s broken promise not to militarise the South China Sea means it has squandered the trust of its neighbours and undermined its aspirations to regional leadership.

and

Asked about China’s trajectory since he took over in 2014, Air Chief Marshal Binskin agreed “it has changed” and cited the “very, very concerning” militarisation of features as well as “the influence of some nations starting to come down into the south west Pacific”.

Chinese President Xi Jinping said during a 2015 visit to Washington that his country had “no intention to militarise” the artificial islands it had built in the strategically important South China Sea.

Air Chief Marshal Binskin dismissed Beijing’s claims that its placement of weapons on built-up features in the Paracel and Spratly archipelagoes were purely defensive and said other countries around those waters were entitled to stand up for their legal and territorial rights.

 “I don’t think there is trust there … because [according to] all the reports that you see, they are militarising,” he said. “They’ll put a spin on that and say it’s only for defensive reasons. But … if you didn’t build an island, you wouldn’t need to defend it. If there are weapons on those islands, they are militarised.”

Asked what the militarisation was for, he said: “I think that they are looking to expand into there and I think it is quite obvious what their approach is.”

Not, sadly, the sort of thing one hears from New Zealand ministers or their senior officials.  But then, why would they, when they seem unbothered by Jian Yang as a member of Parliament, and where the parties seem to compete over which president can offer the most laudatory praise of Xi Jinping and the PRC.

Do our leaders –  National, Labour, New Zealand First, or Green –  care any longer about anything but the quiet life, and the next trade transaction? Do they feel no shame at all about associating with such a heinous regime?  If so, how would we know?  Thank goodness that wasn’t the approach of people like Michael Joseph Savage, Peter Fraser or their then Opposition counterparts.

Are things better or worse than 50 years ago?

I saw reference the other day to a new(ish) multi-country survey conducted by the Pew Research Center last year, asking people in 38 countries whether life in their country was better, worse, or not much different for people like them than it had been 50 years previously.  Among the people I saw tweeting a link to the survey results, there seemed to be general incredulity that anyone could not think things were better now than they had been 50 years previously.  The focus of those comments was particularly on the US results, where 41 per cent of respondents thought things were worse, and 37 per cent though things were better.

But, as it happens, the US results were close to the middle of the field.

pew

At the extremes, the results are not remotely surprising. In 1967 Vietnam had been in the midst of a longrunning war, and now is relatively prosperous and stable, even if not free.  And in 1967 Venezuela was pretty prosperous, whereas now it is poor and chaotic.

And if it is mostly rich countries above the median line, and mostly poor countries below it, that picture isn’t uniform.

New Zealand wasn’t covered by the survey, but Australia, the UK, and the US were.  Australian and British respondents were net positive, while US respondents were slightly net negative.   To the extent that overall economic performance is a material part of what shapes respondents’ answers to such a question, I suspect that New Zealand answers would be less positive than those for the US and the UK.  After all, over that half century almost a million New Zealanders net left the country in pursuit of better opportunities abroad, mostly in Australia.

In a bit over half the countries covered in the survey (but not, for example, in Australia), there was a statistically significant difference in which those with a higher education were more likely than the less educated to say that things had improved.

pew 2

Without being aware of this survey, I wrote about the 2017 vs 1967 question on another blog a few months ago.   I came to the conclusion that, taken as a whole, I’d answer “worse” if asked this particular survey question about New Zealand (even though transplanted 50 years back, this blog would have been impossible, and I’d have been grinding out an existence in some public sector job, probably longing for retirement).

Here is how, in that earlier post, I described some of the things I would put on the positive side of any such assessment.

For sure, there are things to be thankful for –  that favour 2017 over 1967.   Real per capita GDP, for example, is around twice what it was 50 years ago –  that is the ability to consume more stuff.  “More stuff” encompasses “better stuff” –  cars that are better-built, that are air-conditioned; TVs that offer (in NZ) more than a single channel; a rich array of eating-out options; much more affordable overseas travel, and smartphones with the resources of the internet in our pocket.   And yet in 1967 New Zealand most people had fridges, ovens, washing machines, TVs and radios, cars, and it is far from obvious how much real gain new and better gadgets have brought.  Some no doubt, but much?   People like to talk, for example, of the immediacy of news via the internet.  But how many of us really need that immediacy that much?  I look at some copies of Time magazine on my shelves from the late 1960s –  sure it was only weekly, but the content was generally far superior to that in today’s newspapers or news magazines.  I’m not suggesting I’d prefer the 1967 model in this respect, but how large is the gain?  (In some ways, this is  economist Robert Gordon’s point)  After all, in 1969 I heard the broadcast of the moon landing live, played out into our school playground.

Life expectancy is quite a bit longer than it was too –  infant mortality has dropped further, and life expectancy among the old has also improved considerably.    And there are more work options for women in particular –  if most discriminatory laws had gone by 1967, old models in which married women were typically out of the workforce either permanently or for long periods while children were around still prevailed.  In many more-formal ways, options for Maori have considerably improved –  witness the number of Maori MPs as just one small example.  In 1967 people like me couldn’t find an audience with something like a blog.

And on the other hand, specific to New Zealand:

  • so many New Zealanders have left (a regrettable thing in itself, for community and family relationships/networks etc),
  • the house price disaster.  Just prior to 1967, my parents bought a (new) first house on a single (not especially high) income.  Few have that opportunity now,
  • rates of imprisonment are so much higher now than then,
  • rates of welfare dependency are so much higher now than then,
  • a far smaller percentage of children are growing up in two-parent families,
  • the normalisation of drug use (my 13 year old niece told me the other day of recently being offered marijuana in the playground in a nice middle class New Zealand high school),
  • pervasive access to, and use of, pornography,
  • more social isolation and higher rates of mental illness,
  • the growth of the regulatory (and surveillance) state,
  • the deference paid by our elites to one of the most brutal states on earth, in contrast say to New Zealand attitudes to the Soviet Union in 1967.

I could go on to include things more specific to the decline of Christianity in the west, and in New Zealand specifically, but I won’t belabour that point here.  As a parent, my impression is that it is harder to raise children well now than then.

In the Pew results, there was not a statistically significant difference between attitudes of young and old respondents in most countries, but among those where the young were more upbeat were the UK, the US, and Australisa.  Most probably, one would find such a difference in New Zealand.

When we discussed these results around the dinner table, it was suggested that woman might be more inclined to answer positively than men.  I am not sure I share that prior, but unfortunately no results were reported by gender (perhaps suggesting that there were not any consistent or interesting differences, given the typically fairly comprehensive nature of Pew analysis).   Sadly, there also was not any analysis of differences by political inclination (liberal vs conservative), which one would expect to explain some of the differences in responses within, and perhaps between, countries.

I can see how some people would answer that things were better now (many liberals –  depending on the components of the liberal agenda emphasised – would be expected to), and economists seem often to weight most heavily income measures (undoubtedly higher than half a century ago), available technology, and life expectancy.   But these results suggest that to people around the world the answer is not clear cut.  Perhaps in some cases those negative answers involve people just looking at the past with nostalgic rose-tinted glasses, but the diversity of results across countries suggests something more is at work than that.

Productivity: still doing poorly

I had been planning to write today about some of the recent Reserve Bank material on electronic currency.  I even took the papers away with me yesterday to read on some flights, but in the course of that reading  –  coincidentally, en route to another funeral – I discovered that a former Reserve Bank colleague, only a year or two older than me, had died a couple of months ago.    We hadn’t been close, but I’d known him off and on for 35 years beginning with an honours course at VUW in 1983, and when I’d last seen him six months or so ago he’d been confident the cancer was beaten.   What left me a bit sick at heart was that I had commented here last month, moderately critically, on a recent Reserve Bank Bulletin article of which he had been a co-author.   None of the comments were, as I reread them, personal.  But I’d have written differently had I known.  So I’m going to put aside issues around the Reserve Bank for a few weeks (and the blog is taking a holiday next week anyway).

So instead, having listened to a few upbeat stories in the last few days, including the IMF mission chief for New Zealand on Radio New Zealand this morning, talking about the “sweet spot” the New Zealand economy was in etc, I thought it was time to update some productivity charts.

Here is real GDP per hour worked for New Zealand.

real GDP phw jul 18

I’ve marked the average for the last year, and for the 12 months five years’ previously.  If anything, things have been going backwards a bit for the last three years, and for the last five or sx years taken together, productivity growth has averaged no better than 0.3 per cent per annum.  Some “sweet spot”, especially when our starting position relative to other advanced economies was already so far behind.

And here is the comparison with Australia –  in many respects the OECD economy with most in common with New Zealand (distance, resource dependence, Anglo institutions), and also the exit option for New Zealanders.

real GDP nz and aus jul 18

In 1989, when this chart starts, New Zealand was already behind Australia.   Since then, we’ve lost another 15 percentage points of ground, about 0.5 per cent per annum.  A decade ago perhaps one could have mounted an argument that the decline had come to an end: looked at in the right light, perhaps we were even showing signs of some modest closing of the gap.  But then we took another step down, and the rate of decline in the last decade as a whole has been about the same as that for the full period since 1989.

For almost a decade now, I’ve been sobered by the performance of the former eastern-bloc countries that are now part of the OECD.  Thirty years ago, when we –  already a market economy –  were in the throes of reform, they were just beginning the journey to freedom (Estonia and Latvia were still actually, involuntarily, part of the Soviet Union).   Their starting point was, of course, a great deal worse than ours –  for all the early 80s talk of New Zealand having an economy akin to a Polish shipyyard –  but the common economic goal was catching-up, reversing decades of relative decline.

In the decades since, New Zealand has lost ground relative to the richer countries of the OECD (and, as per the chart above, has lost a lot of ground relative to Australia, even more recently).  The former eastern-bloc countries have done a great deal of catching up.  They still have a long way to go to catch that group of highly productive northern European economies (Belgium, Netherlands, France, Germany, Denmark), but New Zealand is on track to be overtaken: on OECD numbers Slovakia now has real GDP per hour worked higher than that in NEw Zealand.

There are seven former eastern-bloc countries in the OECD.  The OECD is filling in 2017 data only slowly, and so in this chart I’ve shown real GDP per hour worked for New Zealand relative to the median of the six former eastern-bloc countries for which there is 2017 data (the country for which they don’t yet have 2017 data is Poland, which managed 7 per cent productivity growth in the four years to 2016, a period when New Zealand –  on the measure the OECD uses –  had none).

eastern bloc

Some of these former eastern-bloc countries had a very rocky ride (notably Estonia and Latvia, which ran currency board arrangements in the 00s, and had massive credit booms, and then busts), but the trend is still one way.  They are catching up with us, and we aren’t catching up with the sort of countries we aspire to match.

The pace of decline (New Zealand relative to these former eastern-bloc countries) has slowed, as you would expect (in 1995 it was still quite early days for post-communist adjustment) but the scale of the chart shouldn’t lead us to minimise the recent underperformance.   In 2007, we had an economy that was 20 per cent more productive than the median former eastern bloc OECD member, and last year that margin was only 12 per cent.

The measure of success in this economy shouldn’t be whether we stay richer and more productive than Slovenia or the Czech Republic.  All of us are a long way off the pace, far from the overall productivity frontier (best outcomes).    But what these former eastern bloc countries help highlight is that convergence can and does happen, if you have the right policies and institutions for your country (in all its relevant particulars).  Policymakers here used to genuinely believe that. It is no longer clear that they – or their Treasury advisers –  any longer do.

On which note, Paul Conway of the Productivity Commission recently published an interesting article in an international productivity journal on New Zealand’s productivity situation and policy options.  Commission staff were kind enough to send me a link.  Paul Conway has a slightly more optimistic take on the last decade or so than I do, but common ground is in recognising the total failure to achieve any catch-up or convergence.  There is a lot in Paul’s article –  which, not surprisingly, is not inconsistent with his earlier “narrative” on such issues that he wrote for the Commission itself, and which I wrote about here.   I will come back later and write about Paul’s analysis and prescription –  there is a lot there, some of which I agree with strongly, and some of which I’m much more sceptical of.  For my money, he materially underweights the importance of a misaligned real exchange rate as a key symptom, which has skewed incentives all across the economy.     But it is good to see public service analysts contributing substantively to the (rather limited) debate on these issues.