I’m tied up in a meeting all day, so just a quick post to update one of my standard charts, following the release yesterday of the quarterly GDP numbers.
In this chart, initially developed by an IMF mission to New Zealand 14 or so years ago, GDP is fairly crudely allocated between tradables and non-tradables sector. Tradables consist of primary industries and manufacturing, with exports of services added in. Non-tradables is the rest of GDP. Flourishing economies tend to have a strong tradables sector: local firms doing well taking on the world (whether as exports or import-substitutes). It isn’t that one type of activity is inherently superior to the other, but when your tradables sector lags behind it usually isn’t a promising sign.
Here is the chart, expressed in per capita terms with both series indexed to 1991q1 when the official quarterly population series starts.
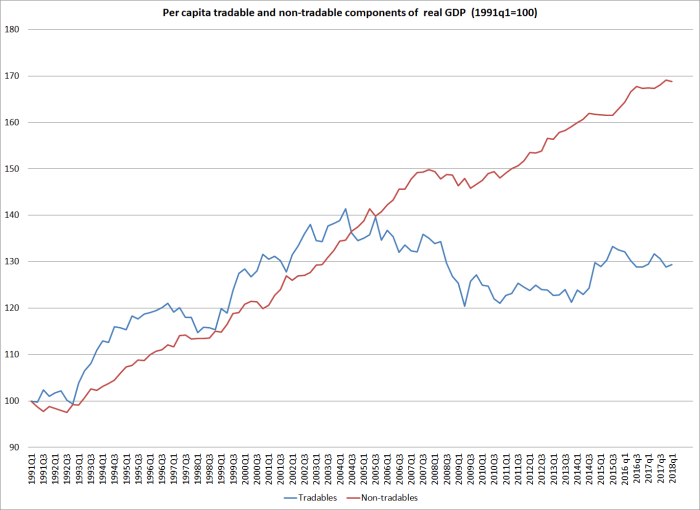
Tradables sector activity performed quite strongly in the 1990s, and even up to 2004. But the current level of real per capita activity was first reached in 2000, 18 years ago. The current level of real per capita tradables sector GDP (on this measure) is almost 10 per cent lower than it was at peak in 2004.
There are plenty of sceptics of this chart, and it isn’t entirely kosher to add together bits of production GDP and bits and expenditure GDP. So here are the individual components of the tradables GDP indicator.
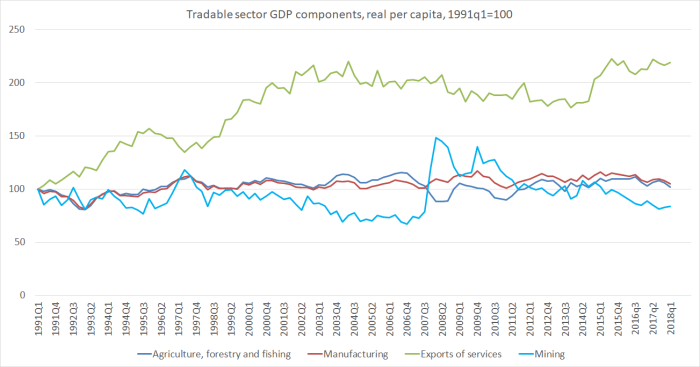
Over 27 years, there has been no growth at in real per capita GDP in agriculture, forestry and fishing, in mining (includes oil and gas – see the spike up in 2007), or in manufacturing. There has been growth in real per capita exports of services, but almost all that growth was in the 1990s and early 2000s – really strong growth back then, and very little, overall, since.
What changed 15 or so years ago? The (real) exchange rate did.
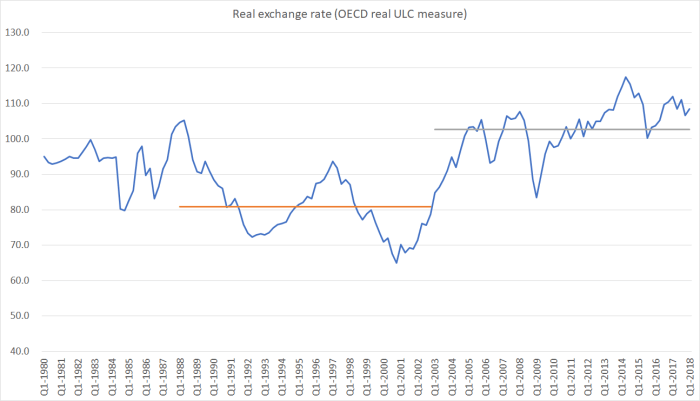
27 per cent higher, on average, over the last 15 years than in the previous 15 years. And it isn’t as if the increase has resulted from the superb performance of the tradables sector of the economy.
Real exchange rates aren’t exogenous instruments that governments (or central banks) can change at will. But if the authorities care at all about getting to the bottom of our economic underperformance, they really need to get to the bottom of what pressures have resulted in such a marked increase in the real exchange rate, sustained now for so long (hint: the terms of trade is at best a small part of such a story). 15 years ago it was almost possible to believe that the New Zealand economy had been turning a corner, becoming more productive and more outward oriented, that it might even begin to close the gaps with the OECD peers. But no longer….and that is before the oil and gas exploration sector was summarily given notice, before net zero carbon emissions targets looked like becoming a real factor.
A successful economy will, almost inevitably be a more outward-oriented one, in which more and more firms operating here are successfully taking on the world. At present, nothing in government policy suggests any improvement, any reversal of the 15 years of sliding backwards, reliant ever more on “taking in each other’s washing” – the (population-driven) domestic non-tradables sector. It is simply not a robust foundation for a more prosperous future.

16 March 2015
Spin from The Broadcaster:
“Auckland is increasingly reliant on Asian immigrants”
Segregation due to Kiwi racism. If it continues “the pallor(?) will be with Fonterra and export education”
https://www.radionz.co.nz/national/programmes/ninetonoon/audio/20171050/is-auckland-becoming-increasingly-racially-segregated
LikeLike
He’s talking about small to medium business but Michael Barnett [Big Business] “very much on board” [luxury yachts?].
LikeLike
70% of NZ population is still very much European so still unsure why Asian migrants are being picked on. The Asian faces on Queen St are mainly the 100,000 International students spending up $4.5 billion in fees, entertainment, food and tourism as they hang around the city waiting for their various study classes.
LikeLiked by 1 person
A. The public never had a say in the policy.
B. Most New Zealanders haven’t benefited
C Pakeha New Zealanders are a minority in Auckland
D. Asia NZ Foundation say 40% think immigration from asia will have a positive impact and (migrants more likely to be positive than Pakeha)
F. The key to bringing this policy about has been control of polling.
LikeLike
I think you will find that rather than waiting for their next classes they are watching the clock tick down and waiting for their permanent residency.
LikeLike
Spoonley again .. again .. again
The interviewees were discussing skilled job openings
I listened to that interview .. have a different experience .. a generation ago high-end employment-recruiters came of age and got a strangle-hold on high-level placement services. One feature that was a consequence of that phenomenon was they would only submit your resume to a potential employer dependent on your last employment. If you were a chemical engineer applying for an civil engineering position you wouldn’t get past the recruiter.
It was worse in the contracting scene
I suspect there is a significant element of that. But Spoonley and Barnett who are not close to the employment coal-face bleated on with high sounding words and opinions. I did not believe much of what they said and didnt say
LikeLike
Money Laundering
LikeLike
15 years ago would coincide with the time when the RBNZ and Don Brash took on a superstar status and decided to run monetary policy independent of the government with a hawkish approach to monetary policy. This hawkish approach has stayed with the culture of the RBNZ ever since.
LikeLike
Well, maybe more like 30 years ago when Don Brash first started as RB governor and ended his term 14 years later having decimated most of NZ manufacturing and production industries.
LikeLike
As you recognise, Don’s time as Governor covered almost exactly the first period in the chart. There were many complaints at times during that term about the high exchange rate, but the peak during the Brash tenure was (at least on this measure) below the average for the last 15 years.
Monetary policy simply isn’t powerful enough to produce those sorts of substantial sustained real exchange rate changes.
LikeLike
….hmmm; indeed but still struggle with why foreign cash continues to flow if NZ is ‘so’ relatively unproductive?? back to those higher real rates due, in part, to the immigration story; I guess labour productivity in the export sector would look ok over time (??) while future demand for milk and holidays is a theme one could still place some chips on….
LikeLike
There are always profitable businesses even in a moribund economy (eg many concentrated in the non-tradables sector). Some flows are equity – eg reinvested profits in banks – some in debt. Much of the debt is, in effect, financing the banks’ housing lending, which is pretty safe, even as regulation increasing messes up the housing market.
Not sure about productivity in the export sector. It will be good in some parts of what there is, but recall that in a successful economy, exports would play a much larger part in our economy than they do (as, of course, would imports).
LikeLike
My friends neighbours sold out of a posh neighbourhood in Christchurch; in moved Chinese and there is a Mercedes Sprinter van outside. They are driving Chinese around the country – utilizing the commons.
LikeLike
[…] be any surprise that the export and import shares of GDP have fallen back, and that there has been no growth at all in per capita tradables sector GDP this century. Successful sustained catch-up growth – of the sort New Zealand […]
LikeLike