Automation, future of work, and other distractions

The Labour Party, led by the now Minister of Finance, has made great play in recent years of the looming “threat” of automation, and the claimed need to think hard about the Future of Work.  There was a taskforce in Opposition, repeated references in ministerial speeches, and now even a Future of Work Forum.  I’ve always been a little sceptical: the application of new technology has been a key part of how living standards have improved over the last few hundred years, and I’m sure most people are hoping for further improvements for themselves and their children/grandchildren.   And employment rates seemed to be about as high as they’ve been for decades.

And so I was interested this afternoon flicking through today’s online Financial Times to find an article citing some new OECD work suggestiong that New Zealand is among the advanced countries with some of the lower propotions of jobs at significant risk of automation.  Here is the key chart from the OECD paper.

automation2

New Zealand fourth lowest share of jobs at high risk of being automated, and lowest in the OECD for the combined high and significant risks.

For the geeks, here is some text from the paper on how OECD researchers have been revising down their estimates.

automation 4

Automation will, no doubt, continue to happen.  It should.  We’ll generally be better off for it (even if some individuals will face difficult adjustments, as they did in every phase of activity –  indeed every business cycle – since the Industrial Revolution).  But particularly if this methodology is even approximately right, it reinforces my sense that the Labour Party – and now the government –  (probably with good intentions) use the Future of Work issue, and automation risks/possibilities, as a distraction from, and substitute for, their lack of interest/ideas in addressing the real economic elephant in the room: decades of underperforming productivity growth that mean we would now need a two-thirds lift in productivity (all else equal) to once again match the leading countries, most of whom we used to consistently outstrip.

As Morning Report reminded us today on the anniversary of women’s suffrage, we should celebrate the automatic washing machine, for all the time it freed up, and opportunities it allowed people (then largely women) to pursue.  It is only one of a myriad of such innnovations, past, present and future.

But New Zealanders get fewer of the gains than most advanced country citizens, as successive governments have done nothing to reverse the productivity failure.


The Secretary to the Treasury and productivity

As I noted in Saturday’s post about The Treasury, the Secretary to the Treasury –  he of the rushed citizenship presumably on the grounds of some exceptional services the previous government thought he might offer to New Zealand –  gave a speech last week on productivity.

One can feel a little sorry for senior public servants venturing into the public domain.  After all, there are limits as to what the head of a government department can really say, while still retaining the confidence of his/her minister (let alone that of the State Services Commissioner).  Political masters change and with those changes there are changes in what can’t really be said in public by their most senior advisers.  All of which is probably a good reason why heads of government departments shouldn’t really give any but the most anodyne (or perhaps obscurely technical) public addresses (in fact, most simply keep quiet in public – do a search for speeches by the Secretary of Justice or the chief executive of MBIE and you won’t find much, if anything).  After all, their primary job is to advise ministers, not to act as public lobbyists for their own policy preferences  Upon leaving office they are, of course, free to champion whatever causes they like.

But all that assumes some idealised fine public servants, who have laboured to generate judicious but penetrating insights.  Wise men and women whose words shed light in dark corners, enrich our understanding, and could –  if only we listened – help resolve some of these intractable challenges that face any modern government and society.

And then there are the Makhlouf speeches.  I written about several of them here (eg here, here, here and here).  They often read fluently enough at a first glance, before quickly turning to dust under any close examination.

Last week’s effort wasn’t that much better.  At least the Secretary to the Treasury was talking about productivity –  something I noted was strangely totally absent from The Treasury’s Briefing to the Incoming Minister last year – but he didn’t have a credible or robust story to tell.

The speech was delivered in Queenstown, so Makhlouf began with some local colour –  some good, some bad.  Among the less positive indicators was

The mean income for people in the Queenstown-Lakes District in 2017 was about $51,000 compared with the national mean of $59,000.  With low incomes but the highest average weekly rental cost in the country and an average house value of more than $1.1 million, the housing affordability problem in Queenstown is in the same league as Auckland.

To which the Secretary’s response was

In response, the Government’s Housing Infrastructure Fund is contributing $76 million in 10-year interest-free loans to support an increase in Queenstown’s housing supply.

So the Secretary to the Treasury now thinks interest-free loans by the government are sensible economic policy?    This isn’t supposed to be some local MP’s party-political broadcast, but the Secretary to the Treasury, guardian of the public purse.

The Secretary then touches on the failure that is New Zealand productivity growth, recognising that we’ve done poorly (while taking no responsibility as head of the leading economic advice agency).  But there is nothing new, and litttle specific.

There are various unsupported assertions  (emphasis added)

We know that our productivity levels stem from a number of factors including weak international connections, the small size of domestic markets, low investment in knowledge-based capital and weaknesses in the allocation of labour.

as if symptoms (in some cases arguable ones) are causes, and then a string of platitudes

It remains a fundamental truth that successful economies need, among other things, a stable and sustainable macroeconomic framework, sound monetary policy and a prudent fiscal policy. It remains true that a well-regulated financial system matters, that properly functioning markets matter, that price signals matter and that incentives matter. And, perhaps most important of all, it remains true that productivity matters.

No doubt largely true (I’d quibble about the “well-regulated” financial system, substituting “sound and stable) but New Zealand has had these features for decades, and we are just slowly drifting further behind.

The second half of the speech builds off this paragraph

The Treasury believes there are a number of factors that always matter for productivity: our human capital, the management of our resources, our international connections, the dynamism of our markets and the effectiveness of our rule-making. I want to say a few words about each of these. To improve our productivity we will have to be more effective in their utilisation and the interactions between them.

First, skills matter.  As if we didn’t know.

There seemed to be two areas of focus

In the Treasury’s view, to help achieve this there should be an emphasis on attainment of cognitive and non-cognitive foundational skills and social skills that are transferable and support life-long learning, as well as greater rates of progression to higher tertiary qualifications.

But I’m not sure what the first half of the sentence really means (Great Books programmes for all, to teach people to think and write?) and the second half looks like a bid for even more tertiary education, when there is little sign that the massive public and private spend on tertiary education in recent decades has been reflected in commensurate increases in productivity or earnings.  And none of this seems embedded in some comparative analysis about whether, and to what extent, New Zealand is doing worse than other advanced countries.

The other specific was slightly surprising

I should also add that we will need to look carefully at whether our social welfare system – which was initially set up to help people make transitions from one job to another in what was expected to be a similar trade – is optimal for the changing world ahead of us.

I presume he means the bits of the system around the unemployment benefit (or whatever it is now called) since most of the social welfare system wasn’t set up to support employment transitions at all (age pensions, widows’ pensions, DPB, sickness and invalid pensions etc), but as his current political masters have, as a matter of policy, been weakening the sanctions in the welfare system that were, supposedly, designed to assist such transitions, I’m left a bit puzzled as to what the Secretary means by this cryptic observation.  Perhaps he is toying with notions of a Universal Basic Income (but, charitably, I’ll assume not)?

Then there is a section on resources.  Some of it seems sensible enough, including around water use rights.  I’m right with him when he favours congestion charging.  But I’m left wondering whether he or The Treasury really believes that either is a significant part of the story explaining our severe relative underperformance.  I don’t.

And lets just say that I rather doubt the robustness of The Treasury’s analytical framework when the Secretary includes these sentences.

The Emissions Trading Scheme is a good example of a tool that can promote the more productive use of resources. Including agriculture within its scope would provide incentives for investment in R&D or innovation in on-farm practices and improve productivity.

An ETS can, no doubt, be a good mechanism for constraining emissions, and even for doing so in a way which might be economically efficient.  But it simply isn’t a way to improve New Zealand’s economywide relative productivity and/or incomes.  Impose an impost (perhaps quite justifiably) on firms in a particular industry, and those who survive will have to adapt their production techniques, perhaps even lifting their own firm productivity.  But it will also considerably shrink the industry in question, when it is an internationally tradable industry, when efficient alternative technologies don’t yet exist, and when other countries aren’t adopting the intervention The Treasury proposes.  All else equal, New Zealanders would be poorer rather than richer if this bit of the Secretary’s prescription was adopted –  the government’s own commissioned economic modelling, by NZIER says as much.

Then Makhlouf moves on to “international connections”, one of the ill-defined buzzwords in this debate.

Mostly it is just empty conventional slogans

Improving the flow of people, capital, trade and ideas will help improve productivity. Strong people-to-people relationships build confidence and understanding and promote learning. They help our businesses to identify capabilities that will help them improve their productivity and ultimately compete and succeed in both domestic and global markets.

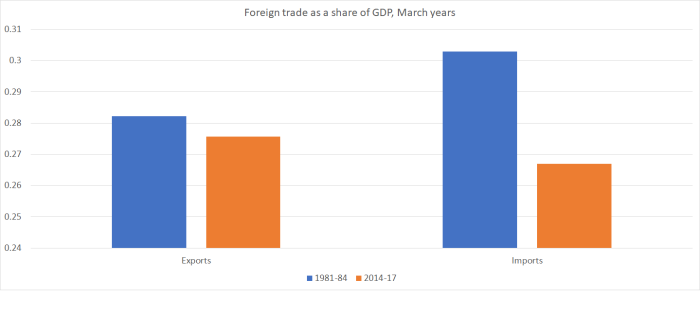
All of which would have sounded good in 1984, and yet we greatly liberalised immigration, got rid of most tariff barriers, signed up to all manner of trade agreements, and……the productivity gaps are larger than they were, and actual trade (exports and imports as a share of GDP) is smaller than it was.  The Secretary is either unaware of these basic facts, or simply chooses to ignore them.

I’m closer to the Secrerary’s position when it comes to foreign investment –  where he has to step delicately around the recent legislative choices of his masters –  but there is no sign that he has thought hard about why foreign investment here isn’t more attractive or, indeed, why not many New Zealand based firms do much foreign investment themselves.

There is a section on “markets” that I’m going to skip over.  I don’t particularly disagree with much in it, but there also isn’t much specific there, and nothing to suggest The Treasury has thought seriously about the connection to sustained New Zealand relative productivity underperformance.  Much the same goes for the section on Rules.  I’m all in favour of robust policy evaluation –  it is a shame it hasn’t been applied to Treasury advice on productivity –  and I’m sure there are real opportunities there, but again is there any evidence that things on that score are worse here than in other countries?  Perhaps, but if so he doesn’t mention it.

(The dig at the massive taxpayer subsidy to the cattle industry was interesting, and welcome

Speaking of incentives, I find the situation around the eradication of mycoplasma bovis an interesting one. Responsibility for the genesis and subsequent spread of the mycoplasma bovis outbreak sits with the cattle industry. The question is, should the taxpayer compensate those affected, or should the industry pay for the consequences of the industry’s making? We might also ask what incentives are signalled to the industry by these different options.

And yet, how different is it anywhere else? )

There was an odd section on co-operatives, as if it was a matter for governments to decide on the appropriate sort of vehicles through which business activity is undertaken, and one on public sector productivity, which was really no more than a footnote.

And then there was tax reform.  Mostly, it was in praise of the New Zealand tax system, including the –  highly questionable –  claim, that

the New Zealand tax system is much less distortionary than the tax systems of other OECD countries

That might be true, more or less, if we look only across activities in the same time period, but is demonstrably not true once we take account of intertemporal dimensions.  Not consuming your income now and delaying until later (ie saving –  particularly retirement savings) is much more heavily penalised by the tax system here than in almost any other advanced economy.  That is a distortion The Treasury has been consistently reluctant to address or (it seems) even acknowledge.

There is also no recognition of the possible connections between low rates of foreign investment, and low rates of business investment (symptoms he touches on elsewhere) and business tax regime, where (for example) our company tax rate –  a key consideration for foreign investors –  is now towards the upper end of the OECD range.

And then it was interesting to see that in a speech on productivity, the specific policy proposal that the Secretary devotes most space to (in the entire speech, not just this section) was the call for a capital gains tax.

But there is one area where we stand out as an outlier and which I think needs further attention. The current approach to the treatment of capital income – in particular, capital gains – is highly inconsistent. Some gains are already taxed but others are not. The result is therefore something of a patchwork, the results of which can be unfair, regressive and distortionary. A more consistent approach to the taxation of capital gains would increase the fairness of the tax system, and reduce distortions by levelling the playing field between different types of investments.

For these reasons, the Treasury has long believed there is a real case to extend the taxation of capital income. I recognise that this would come with its own risks, and give rise to higher compliance and administration costs. But there are interventions available to address these risks. The extent to which the impacts are realised – whether positive or negative – will depend significantly on the design of policy.

Some readers will support a capital gains tax.  I don’t particularly, partly because a real-world one (ie the sort many other countries actually have) just introduces a whole new set of distortions, but does anyone seriously believe that a capital gains tax –  whatever the case on “fairness” grounds –  is going to make any material difference to economywide productivity?  And if there is such a case, not even the Secretary to the Treasury advances it.

The Secretary, of course, has to keep on side with his masters, so we read this

I should also add that there are many things being done to address points I’ve just raised. The government has been working on education and training, welfare reform, tax reform and trade relations, to name just a few of the actions happening.

If the Secretary to the Treasury really believes that the goverment’s policy agenda –  at least as revealed to the public –  is going to make a helpful difference in reversing the decades of relative productivity decline, he must surely be the only such person.    But I guess that if he is going to speak in public, he has to say such stuff.

In the final paragraph of the speech there is material for both a brickbat and a rare bouquet.

The brickbat?

And the ‘we’ means everyone: businesses, workers and government seizing the opportunities offered by being part of, and closer to, the fastest-growing region in the world.

Which is simply nonsense of course,   New Zealand is incredibly remote from Asia, or from any other major part of the world economy.     We might be a little less far from some of Asia than we are from Europe or much of North America, but we aren’t even a little close to the major bits of Asia, let alone “part of” it (whatever that means).  When the Seceretary was at home in London he was closer to Mumbai or Bangalore or Delhi than he is in Wellington.  He was actually a little closer to Seoul or Shanghai too.

It is a fundamentally unserious “analysis”.

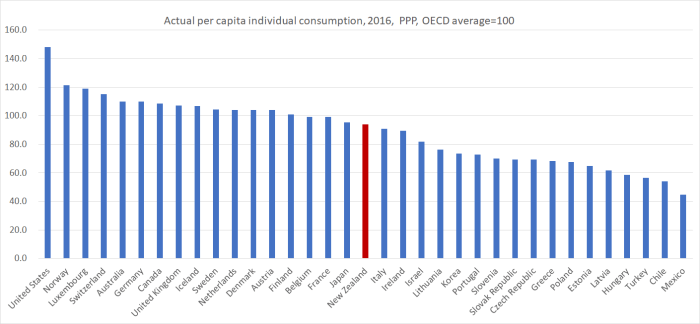
But there is a bouquet.   Early in his speech, the Secretary was rather downplaying the failure of New Zealand policy, and policy advisers, in observing that labour productivity is “now about 20 per cent below the OECD average”  –  an average considerably lowered by the entry to the OECD of a large group of emerging countries (especially in eastern and central Europe), all of whom throughout modern New Zealand history were considerably poorer and less productive than New Zealand.

But the Secretary ends

Recent research indicates that if New Zealand’s productivity caught up with the better-performing countries in the OECD, our incomes would be 50-60% higher.

It doesn’t take much “research” –  a quick download of an OECD table does the job.   Here is an extract of that table I did recently for a paper I’ve been writing on these issues.

GDP per hour worked
USD, constant prices, 2010 PPPs
1970 1990 2017
New Zealand 21.4 28.6 37.2
Netherlands 27.4 47.5 62.3
Belgium 25.0 46.7 64.6
France 21.7 43.3 59.5
Denmark 25.1 44.8 64.1
Germany 22.3 40.7 60.4
United States 31.1 42.1 63.3
Median of six 25.1 44.1 62.8
NZ as per cent of median 85.4 64.9 59.2
Source: OECD

If anything, a 50-60 per cent lift is an understatement: it would take a two-thirds lift in New Zealand productivity to match the average of this group of high-productivity countries.   And such a lift could be expected to be mirrored in commensurately higher living standards,

But it is great to see the stark magnitude of our failure –  and “failure” is the only honest word for it – as the note the Secretary ends on, even if there isn’t much sign the institution he leads has any serious answers.

And, to be entirely fair, the Governor of the Reserve Bank’s own speech last week makes the Secretary’s effort look like a fine piece of public sector analysis and communications by comparison.  I will write about the Governor’s extraordinary speech tomorrow.


A country is not a company

That was the title of an article by Paul Krugman, published more than 20 years ago now, in the Harvard Business Review.  The Prime Minister might perhaps consider reading it, and reflecting on it.

Yesterday morning the Prime Minister gave her promised speech on the economy.  It was, frankly, astonishing how little there was there.   There was some mention of the problems

Our overall objective is to build a productive, sustainable and inclusive economy.

On each score we have some way to go. When it comes to productivity, the OECD has said we are “well below leading OECD countries, restraining living standards and well-being”

and

We need to transition from growth dominated by population increase and housing speculation, to build an economy, that as I said, is genuinely productive, sustainable and inclusive.

and

First we want to grow and share more fairly New Zealand’s prosperity.

That means the gap between the highest and lowest income and wealth deciles reduces, real per capita income increases; the value and diversity of our exports grows and home ownership increases.

In particular we want to build our exports and have export led growth.

Which is all well and good, but there is nothing –   nothing –  in the speech about what the government proposes to do, and how it believes that the modest measures it does propose will deliver such better outcomes.   And, of course, no mention of the government initiative which, on the government’s own consultative document modelling, would severely undermine the competitiveness of core parts of our tradables sector, and reduce GDP by perhaps as much as 10 to 22 per cent.

And this from a Prime Minister who has now been in office for almost a year.  It is extraordinary.

But in this post I wanted to focus on the new Business Advisory Council the Prime Minister announced yesterday.  Perhaps it is all just window-dressing, intended to get some favourable headlines for a day or two, and perhaps placate the odd sceptic in the business community (although one might wonder how many sceptics will be invited onto the Council).    If so, I guess no real harm done.

But such councils can be a path towards cronyism.  On the one hand, attracting sycophants who like to be able to tell their mates they have the ear of the Prime Minister.  And on the other, more concerningly, enabling selected business heads to bend the ear of ministers and put pressure on them to make decisions favourable to the specific economic interests of those involved and their employers.  That might not be direct subsidies –  although we have had all too many of them in recent years –  but might involve making the case for regulatory changes which skew the playing field against new entrants, in favour of incumbents.

But by far the bigger issue, if the Prime Minister and the government are at all serious about the lines they ran yesterday, is “what do chief executives of businesses know about overall economic management, and the challenges of New Zealand’s longstanding productivity underperformance?”.  In Krugman’s words, a country is not a company.

Here are a few extracts from his article

What people learn from running a business won’t help them formulate economic policy. A country is not a big corporation. The habits of mind that make a great business leader are not, in general, those that make a great economic analyst; an executive who has made $1 billion is rarely the right person to turn to for advice about a $6 trillion economy.

Why should that be pointed out? After all, neither businesspeople nor economists are usually very good poets, but so what? Yet many people (not least successful business executives themselves) believe that someone who has made a personal fortune will know how to make an entire nation more prosperous. In fact, his or her advice is often disastrously misguided.

and

I am not claiming that business-people are stupid or that economists are particularly smart. On the contrary, if the 100 top U.S. business executives got together with the 100 leading economists, the least impressive of the former group would probably outshine the most impressive of the latter. My point is that the style of thinking necessary for economic analysis is very different from that which leads to success in business. By understanding that difference, we can begin to understand what it means to do good economic analysis and perhaps even help some businesspeople become the great economists they surely have the intellect to be.

and

Keynes was right: Economics is a difficult and technical subject. It is no harder to be a good economist than it is to be a good business executive. (In fact, it is probably easier, because the competition is less intense.) However, economics and business are not the same subject, and mastery of one does not ensure comprehension, let alone mastery, of the other. A successful business leader is no more likely to be an expert on economics than on military strategy.

And yet here was our Prime Minister yesterday (emphasis added).

The role of the Council will be to build closer relationships between Government and business, provide high-level free and frank advice to the Prime Minister on key economic issues and to create a vehicle to harness expertise from the private sector to inform the development of the Government’s economic policies.

….

“The Council will provide a forum for business leaders to advise me and the Government and to join us in taking the lead on some of the important areas of reform the Government is undertaking,” said Jacinda Ardern.

“The Council will report to me on opportunities it sees and identify emerging challenges. It will bring new ideas to the table on how we can scale up New Zealand businesses and grow our export led wealth.

“I want to work closely with, and be advised by, senior business leaders who take a helicopter view of our economy, who are long term strategic thinkers who have the time and energy to lead key aspects of our economic agenda.

Expertise on economic management, and the particular confounding challenges the New Zealand economy faces, just aren’t the sort of thing that tends to be fostered in the course of a corporate career.   Many of these people might have been superb marketers, exceptional operations managers, corporate finance whizzes, smooth operators around the edges of regulation and the tax system, and have risen to assume overall responsibility for (by New Zealand standards) fairly large organisations. They are absolutely vital skills, and business roles done well are a big part of how, in pursuing the interests of shareholders, society is also made better off.   But those skills bear no resemblance to the issues involved in addressing long-term economic underperformance.  For a start, the things businesses have to take as given are precisely the sorts of things governments often can vary, and (as Krugman eloquently notes) the sorts of constraints even a large business faces are very different from those an entire economy faces.   And so on.

There can be exceptions of course.  Sometimes people with a strong background in economics end up in top corporate roles.  Back in the day, for example, Don Brash as as private sector CEO was able to provide a valuable contribution in leading advisory groups around things like the introduction of GST.  More recently, Kerry McDonald –  former director of NZIER and later chief executive of Comalco and chair of the BNZ –  has continued to bring valuable contributions (eg here) to policy discussions and debates (although probably not ones likely to see him invited to join the Business Advisory Council).

But I don’t see many (any?) such people in the top tier of New Zealand business today. The head of Air New Zealand –  chair of the new council –  is reported to be obsessed with politics, but I don’t think we’ve ever heard his ideas on New Zealand’s longer-term economic underperformance.    Fonterra doesn’t have a permanent CEO, and Xero’s head is an Australian based in Australia.    The film industry and the export education industry survive on explicit or implicit subsidies.  And so on.  But even if there were a range of hugely successful outward-oriented businesses led by stellar CEOs lauded by their peers around the world……..it is simply a totally different skill set.

In her column in this morning’s Herald Fran O’Sullivan, who tends to articulate the perspectives of (in the Australian term) the “big end of town”, is pretty keen on the new Council.

Luxon positioned himself well to take a leadership role.

He recently hosted Finance Minister Grant Robertson to a private dinner in Auckland attended by a number of CEOs.

On the guest list were KiwiRail’s Peter Reidy, Spark’s Simon Moutter, Mercury’s Fraser Whineray and McKinsey and Company’s Andrew Grant. The Warehouse chair Joan Withers was also present.  …..

The chief executives at Luxon’s table are all “progressives” — interested in public policy, innovation and sustainability — and wanting to have a say and contribute to the direction of New Zealand.

Moutter led an innovation mission to Israel a couple of years ago to get a focus on the secrets to Startup Nation. Whineray led last year’s Go Swiss mission by business think tank, the New Zealand Initiative which delved into Switzerland’s focus on localism and vocational education — two contributing factors in that country’s success.

Kiwirail……that sink hole that absorbs billions of dollars of taxpayers’ money, contributing to our economic underperformance.

But it was convenient that O’Sullivan included this snippet, as before I read it I’d also been thinking of the cases of Simon Moutter and Fraser Whineray (the latter another head of a majority state-owned company).

As she notes, Moutter was dead-keen on the Israeli model.  I picked apart that idea in this post (followed later by this one).  As for Whineray and the Swiss trip (of which Fran O’Sullivan was part), they headed off to one of the very few countries to have had less productivity growth than New Zealand in the last 50 years (I wrote about some of the findings of the trip here).

It is great that these individuals care about New Zealand’s economic performance, but there is no particular reason to believe that in general they will have more useful perspectives to offer than the average moderately-educated voter chosen from the phone book at random.  Running a business no more equips you to provide useful advice on economic policy more generally (as distinct perhaps from specific bits around your industry) than it does to, in Krugman’s words, write great poetry or make military strategy.

Of course, the usual pushback against such business advisory councils –  again, at least if they are supposed to be anything more than window-dressing –  is that governments have access to a range of high quality contestible advice from….well…. economists (in particular those in key public sector agencies).    But that defence is weaker now that MBIE is run by an HR person with no policy or economics background (although apparently the CEO did previously work in Air New Zealand) and The Treasury seems to have given up on seriously addressing long-term productivity underperformance in favour of corralling a politically convenient, ideologically-driven grab bag of feel-good indicators into a forthcoming “wellbeing Budget”.


The Minister of Finance champions an economic strategy

Longstanding readers will know that I was pretty critical of the previous government for the utter absence of any sign of a set of economic policies that might have begun to reverse the decades of relative economic decline.  Worse, they and their acolytes too often seemed to make up stories about how well things were going when the data pretty clearly pointed in the opposite direction.   I’m not sure I’d be quite as harsh as Kerry McDonald and Don Brash, who recently gave the Key-English government an overall score of 0/10, but I’d be close, especially around productivity (and also around housing).

What has become increasingly disconcerting is that the new government –  now almost a third of the way through its term –  also has no credible ideas about reversing the decline and little interest either.  They seem increasingly reduced to making stuff up as well, and trotting out the same lines again and again without any sign of a really understanding the challenge, without any sign of a compelling analytical framework, and without any reason to think that the policies they talk of will make any material (helpful) difference.

I woke this morning to the news that the Minister of Finance had an op-ed in the Herald explaining how the government was going to restore our economic fortunes.   With suitably low expectations, I tracked it down.   Even with low expectations, I was struck by how weak it was, and left wondering why the Minister and his PR team thought the article was a good idea.

The Minister begins thus

The coalition Government is helping business modernise our economy to be fit for purpose for the 21st century.

Presumably he is aware that one sixth of the 21st century has already gone?  And that his party was in government for half that time?  But let that pass: as rhetoric it might be empty, but it is probably harmless.

This means being smarter in how we work, lifting the value of what we produce and export, supporting the environment, planning for future generations and giving everyone a fair shot at success. It means making sure that all hard-working Kiwis share in the rewards of economic growth.

All of which is hard to argue with, but isn’t exactly a) specific, or (b) new.  I keep a copy of National’s 1975 election manifesto by my desk, and flicking through it –  43 years on now – I think I spotted all those points (actually, in light of Eugenie Sage’s announcement on Sunday, I also found a pledge to “discourage all forms of environmental pollution and encourage the recycling of materials.  We will place a levy on difficult-to-dispose-of products’).   Labour’s 1972 manifesto, or its 1984 one, or its 1999 one probably had them all too.

Most New Zealanders know we cannot go on relying on a volatile mix of population growth, an overheated housing market buoyed by speculation, and exporting raw commodities as our growth drivers.

Quite a bit of that was in the 1975 manifesto too.    They are old lines, each trotted out by politicians of either main party for decades as the symptoms presented.     Not always even very accurately – does anyone actually think an “overheated housing market buoyed by speculation” added to national prosperity?   And not with much sense that the speaker had any sort of robust model of the New Zealand economy.  Let alone serious policies in response: for example, if this paragraph is to be believed, the current government is apparently uneasy about rapid population growth, but continues to run the same immigration policy as both its predecessor governments for the last 20 years.

And despite all this, a few sentences later the Minister of Finance tries to assert that

the fundamentals fuelling the economy are strong

Quite which “fundamentals” he has in mind – presumably not those in the previous quote (above) –  isn’t clear.  In fact, all he offers in support of his view is

Last week, the Reserve Bank said growth will still average 3 per cent over the next three years. And Mainfreight managing director Don Braid said recently: “I think the business environment is good right now.”

A government agency whose forecasts seem to command increasing scepticism among other forecasters, and one prominent business person.  Perhaps you are persuaded.  I’m not.

But finally we get to some of the things the government is promising.  First, what the Minister presents as a key component

Our plan to become more productive is built on getting our infrastructure sorted. This year, and for the next 10 years, we will invest more than $4 billion getting roads, rail and coastal shipping humming. We are sorting out Auckland’s congestion to save the $1b loss in productivity it causes each year.

Haven’t we heard these infrastructure stories (“we are taking steps to clear the backlog”) for 15 years now?  But even if they are doing everything well in this area, look at the number in the final sentence.   $1 billion –  assuming the estimate is robust –  is a great deal of money to you and me individually, but this is an economy with an annual GDP of $280 billion.  On the Minister’s own numbers, fixing congestion would lift GDP by about 0.36 per cent.  It would be very welcome, but it is tiny relative to the scale of the economic underperformance: with no productivity growth at all for the last three years, it might take 10 similar initiatives to just reverse the further slippage (relative to other countries) in the last few years.  But this was the only hard number in the entire article.

So what else does the Minister have to offer in his economic strategy?

We are investing to improve the skills of our workforce so that workers can adapt to changing workplaces. New programmes like our Mana in Mahi/Strength in Work apprenticeship scheme will get young people off the dole and support employers with the costs of giving them an apprenticeship to help them grow their business.

As I’ve noted numerous times previously, on OECD data New Zealand workers are among the most highly-skilled in the OECD.   And where the government is spending most heavily in the broad area of skills, it seems to be in providing fee-free tertiary education –  a policy that will (a) mostly redistribute money to people (and their families) who would already undertake tertiary education, and (b) to the limited extent it encourages further participation, presumably do so mostly among those for whom tertiary education offers lower expected returns.  It doesn’t have the feel of a productivity-enhancing policy, and the government has not (that I’ve seen) offered any numbers to the contrary.   As for getting “young people off the dole”, it is (of course) a worthy objective but haven’t we seen many such initiatives in the last 50 years?

Other policies supporting small and medium enterprises to manage costs include greater access to training programmes, e-invoicing and cutting compliance costs.

There may well be some useful stuff in that list.  But surely every government in modern times has talked of cutting compliance costs?  And, in practice, haven’t most ended up increasing them overall?  The previous government liked to boast of the 500 (?) items that comprised its Business Growth Agenda, but none of it (not even all of it) began to reverse decades of underperformance.  It was symptom of the drive for action without analysis.

New Zealand was built on innovation. The best path for us to get richer as a country is to invest in new opportunities and find better ways of doing things. The coalition Government is supporting business to lift research and development investment, with $1b set aside in the Budget for R&D tax incentives.

Hard to disagree with the second sentence, but without some compelling analysis suggesting that the government and its advisers understand why firms haven’t regarded it as worth their while to spend more heavily on R&D, it is difficult to be optimistic that more subsidies are the answer.   As I noted in an earlier post on the government’s proposals in this area

R&D tax credits aren’t the only form of government spending to subsidise business R&D – in fact, the government’s new scheme involves doing away with the current grants. And as it happens, OECD numbers suggests we already spend more (per cent of GDP) on such subsidies than Germany (DEU), and quite a lot more than Switzerland (CHE). [both of which have far far higher levels of actual business R&D]

All of which might suggest taking a few steps back and thinking harder about why firms themselves don’t see it as worth undertaking very much R&D spending here. But given a choice between hard-headed sceptical analysis and being seen to “do something”, all too often it is the latter that seems to win out.

But we are only stepping up to the big stuff

Our bold goal for New Zealand to have a net zero emissions economy by 2050 is essential as we face up to climate change. This goal creates economic opportunities. The business community is alongside us, with 60 of our biggest firms forming the Climate Leaders Coalition. The $100 million Green Investment Fund and the One Billion Trees initiative are key parts of this work.

Perhaps it is “essential”.   Perhaps it even creates “economic opportunities” –  big changes in regulation and relative prices always do, for some people.   But the government’s own consultative document, and modelling commissioned for them from NZIER, suggests that once one looks at the entire economy, a serious net-zero emissions target by 2050 will result in losses of real GDP per capita of 10 to 22 per cent (relative to the baseline in which no such target is adopted by New Zealand).   No democratic government is history has ever consulted on proposals that would lead to such a dramatic fall in expected future living standards and productivity.  And, as a reminder, on the government’s own numbers, the costs would fall wildly disproportionately on the poorest New Zealanders.   And, yes, there probably will be a lot more trees planted –  many of them probably on good, easy to access and harvest, land –  but just last week the government had to announce large subsidies to get even that programme underway.  Subsidies have never been the path to improved economywide economic prosperity.  Of course, few suppose the government proposes adopting a net-zero target for economic purposes, but they should at least stop misrepresenting the analysis on the economic effects from their own consultants.

We are also committed to ensuring no one is left behind in our economy. That’s why we have put in place the Families Package and lifted the minimum wage. It is why we have a $1b annual fund for regional infrastructure and economic development opportunities.

So the regions are so “stuffed” that only an annual subsidy scheme is going to help ensure they aren’t “left behind”?    That seems to be the implication of what the Minister of Finance is saying there.   And perhaps the Minister skipped over the likely tension between the laudable desire (see above) to get young people off the dole, and the really substantial increase in the minimum wage his government is putting in place (at a time when there is little or no economywide productivity growth)?

There are challenges in the world that are outside of New Zealand’s control. That is why we are running a surplus and being prudent with our debt levels. We are also diversifying our export markets to create new opportunities for our exporters.

There is no hint of what, specifically, the Minister has in mind with his final sentence.  But there is a certain sameness to it, going back decades and decades (nice quotes –  including about the potential role of forestry –  in that 1975 manifesto I mentioned earlier).  And, actually, taken over the decades there has been a huge amount of diversification of export markets –  no single country takes more than a quarter of New Zealand firms’ exports – but it hasn’t enabled New Zealand to lift the foreign trade share of its GDP much.  In fact, over the last 35 years that share has shrunk.

As Don Brash noted in his article the other day, the previous government had fine words too

Key spoke about the need to increase the export orientation of the economy, and set a target for exports of goods and services of 40 per cent of GDP, up from 30 per cent when he came to office. Today, exports are just 27 per cent of GDP

Just no policies to make a difference.

The Minister of Finance attempts to end his article on an upbeat note

We are committed to working with business, workers and communities to build a stronger, more productive economy that delivers the quality of life that all New Zealanders deserve.

A worthy objective indeed, but there is nothing in what he told his readers that is likely to address –  and begin to reverse –  the decades and decades of underperformance.  If we take seriously the government’s own numbers around the proposed emissions goal, the relative underperformance could be even worse under this government (were it to win nine years in office) than under its two predecessors.

I presume (hope) the Minister believes what he says, but until he starts to confront the implications of charts like this he is unlikely to make any progress (except perhaps by chance)

With a real exchange rate now averaging 25 per cent higher than in the previous 15 years, in a country where productivity has dropped further behind, it shouldn’t be any surprise at all that foreign trade shares are falling, that the economy is increasingly skewed towards the non-tradables sector (where competition is often, and often of necessity) quite limited, or that firms don’t see the likely payoff to investing heavily in R&D.   These are classic symptoms of a severely unbalanced economy.  Most often they arise from misguided government choices.  In our case, the biggest single misguided choice is the grim determination –  or perhaps enthusiastic dream – to keep on rapidly driving up our population in such an isolated location where the opportunities to take on the world from here seem few –  and all the fewer with such a severely out-of-line real exchange rate.

Really successful economies  –  ones with materially stronger productivity growth than their peers –  tend to have strong, and rising, real exchange rates.  But that strength is a consequence of success, an outcome of success, a way of spreading the gains.  Driving up the real exchange rate has never been a part of successful strategy to lift the relative productivity performance of the economy.  The reformers here in the 1980s recognised the importance of a sustained lower real exchange rate as part of a successful economic transition.  It is tragic that today’s political and economic leaders seem to have almost completely lost sight of that.

We have –  and will have –  a 21st century economy.  But the question is whether it will be a struggling upper middle economy, with hazy memories of glory days long gone, or one that once again matches many of the richer countries in the advanced world, something I’m pretty sure we could do, but for a small number of people.  If the government really believes they have the answer for how they can do it with a population that they  actively drive further up every year, they surely owe it to us to lay out their reasoning, their analysis, with much more specificity than the Minister of Finance has yet done.  That might include explaining why their clever wheezes and proposed reforms will make the difference their predecessors also claim to have aspired to for decades now.

Then again, perhaps tangible achievement no longer matters.  Under the government’s wellbeing approach perhaps warm feelings will substitute for world-leading incomes?


Consumption, investment and wages (inflation) in New Zealand

After writing yesterday’s post, I noticed another somewhat-confused article on the “low wage” question.  The author of that piece seemed to want to look at after-tax wages, without then looking at the services those taxes might deliver.   Taxes are (much) higher in France or Denmark, but so is the range of government services.

One way of looking at the material standard of living question is to look at per capita consumption, again converted using PPP exchange rates.   Just looking at private consumption –  the things you and I purchase directly –  will also skew comparisons.    Take two hypothetical countries with the same real GDP per capita.  One has much lower taxes than the other, but health and education in that country are totally private responsibilities,  whereas in the higher tax country many of those services are delivered by the government, largely free to the user at the point of use.    Private consumption in the low-tax country will be much higher than in the high-tax country, but the overall actual consumption of goods and services may not be much different  (depending on incentive effects etc, a topic for another day).

For cross-country comparisons, the way to handle these differences is to use estimate of actual individual consumption: private consumption plus the bits of government consumption spending consumed directly by households (eg health and education).  Separate again is “collective consumption” –  things like defence spending, or the cost of central government policy advice, which have no direct or immediate consumption benefit to households.

Here is the data for the OECD countries for 2016, where the average across the whole of the OECD is 100.

AIC 2016

New Zealand does a little less badly on this measure than on the various income or productivity measures.  That is consistent with the fact that our savings rates tend to be lower than those in many other OECD countries and (relative to productivity measures) to high average working hours per capita.  On this measure in all the former communist countries now in the OECD the average person still consumes much less than the average New Zealander does.  Unlike many advanced economies, we have consistently run current account deficits.   Large current account surpluses –  Netherlands for example has surpluses of around 10 per cent of GDP –  open up the possibility of rather higher future consumption.

Having dug into the data this far, I decided to have a look at investment spending per capita.  I mostly focus on investment as a share of GDP, and have repeatedly highlighted here the OECD comparisons that show business investment as a share of GDP has been relatively low in New Zealand for decades, even though we’ve had relatively rapid population growth (and thus, all else equal, needed more investment just to maintain the existing capital stock per worker).   Here is the OECD data, for total gross fixed capital formation (“investment” in national accounts terms) and ex-housing (where there are a few gaps in the data).

investment ppp

You can probably ignore the numbers for Ireland (distorted by various international tax issues) and Luxembourg (lots of investment supports workers who commute from neighbouring countries).  But however you look at it, New Zealand shows up in the middle of the pack.  That mightn’t look too bad –  and, actually, was a bit higher than I expected to find – but when considering investment one always needs to take account of population growth rates.      Average investment spending per capita might be similar to that in France, Finland, or Germany, but over the most recent five years, the populations of those countries increased by around 2 per cent, while New Zealand’s population increased by 9 per cent.  Just to keep up, all else equal, we’d have needed much more investment spending (average per capita) than in those other countries.

Over the most recent five years, only two OECD countries had faster rates of population growth than New Zealand.  One was Luxembourg –  where, as far as we can tell, things look fine (lots of investment, lots of consumption, high wages, high productivity) –  and the other was Israel.  In Israel, average investment spending (total or ex-housing) was even lower than in New Zealand.  And as I highlighted in a post a few months ago, Israel’s productivity record has been strikingly poor.

But how has Israel done by comparison?  This chart just shows the ratio of real GDP per hour worked for New Zealand and Israel relative to that of the United States (as a representative high productivity OECD economy), starting from 1981 because that is when the Israel data starts.

israel nz comparison

We’ve done badly, and they’ve done even worse.

If productivity growth is the basis for sustained growth in material living standards –  and employee compensation –  how have wages been doing recently in New Zealand?

One way of looking at the question is to compare the growth in GDP per hour worked with the growth in wages.  If we look at nominal GDP per hour worked, we capture terms of trade effects (which can boost living standards without real productivity gains) and avoid the need to choose a deflator.  From the wages side, I still like to use the SNZ analytical unadjusted labour cost index series.  Perhaps there are serious flaws in it –  if so, SNZ should tell us – but, on paper, it looks like the best wage rates series we have.

Here is the resulting chart, with everything indexed to 1 in 1998q3, when the private sector LCI analytical unadjusted series begins.

NGDP and wages

When the series is rising, wages (as measured by this series) have risen faster than the average hourly value of what is produced in New Zealand.  A chart like this says nothing about the absolute level of wages (or indeed of GDP per hour worked), but it does suggests that over the last 15 years or so, wage rates in New Zealand have been rising faster than the value of what is produced in New Zealand.  That is broadly consistent with the rebound in the labour share of total GDP over that period.  There is some noise in the data, so not much should be made of any specific shorter-term comparisons, but even over the last five years –  when there has been so much public angst about wages – it looks as though wage inflation has outstripped hourly growth in nominal GDP (even amid a strong terms of trade).    All of which is consistent with my story of a persistently (and, so I argue, unsustainably) out-of-line real exchange rate, notably over the last 15 years or so.

New Zealand is a low wage, low productivty (advanced) country.  We don’t seem to do quite as badly when it comes to consumption, but investment remains quite low (relative to the needs of rapidly growing population) and wage earners have been seeing their earnings increase faster than the (pretty poor) growth in GDP per hour worked.  None of that is a good basis for optimism about future economic prospects, unless politicians and officials finally embrace an alternative approach, under which we might see faster (per capita) capital stock growth and stronger productivity growth, in turn laying the foundations for sustainably higher earnings (and higher consumption).  Most likely, a key component of any such approach would involve finally abandoning the “big(ger) New Zealand” mythology that has (mis)guided our leaders –  and misled our people – for decades.

A low wage, low productivity (advanced) economy

There was an article on Stuff the other day from Kirk Hope, head of Business New Zealand, suggesting (in the headline no less) that “the idea [New Zealand] is a ‘low-wage economy’ is a myth”.   I didn’t even bother opening the article, so little credence have I come to give to almost anything published under Hope’s name (when there is merit is his argument, the case is almost invariably over-egged or reliant on questionable numbers).   But a few people asked about it, including a resident young economics student, so I finally decided to take a look.

Hope attempts to build his argument on OECD wages data.   I guess it is a reasonable place to try to start, but he doesn’t really appear to understand the data, or their limitations, including that (as the notes to the OECD tables explicitly state) the New Zealand numbers are calculated differently than those of most other countries in the tables.

The reported data are estimated full-time equivalent average annual wages, calculated thus:

This dataset contains data on average annual wages per full-time and full-year equivalent employee in the total economy.  Average annual wages per full-time equivalent dependent employee are obtained by dividing the national-accounts-based total wage bill by the average number of employees in the total economy, which is then multiplied by the ratio of average usual weekly hours per full-time employee to average usually weekly hours for all employees.

That seems fine as far as it goes, subject to the limitation that in a country where people work longer hours then, all else equal, average annual wages will be higher.  Personally, I’d have preferred a comparison of average hourly wage rates (which must be possible to calculate from the source data mentioned here) but the OECD don’t report that series  (and I don’t really expect Hope or his staff to have derived it themselves).   Although New Zealand has, by OECD standards, high hours worked per capita, we don’t have unusually high hours worked per employee (the reconciliation being that our participation rate is higher than average) so this particular point probably doesn’t materially affect cross-country comparisons.

The OECD reports the estimated average annual wages data in various forms.   National currency data obviously isn’t any use for cross-country comparisons, so the focus here (and in Hope’s article) is on the data converted into USD, for which there are two series.  The first is simply converted at market exchange rates, while the second is converted at estimated purchasing power parity (PPP) exchange rates.   Use of PPP exchange rates –  with all their inevitable imprecisions –  is the standard approach to doing cross-country comparisons.

Decades ago people realised that simply doing conversions at market exchange rates could be quite misleading.   One reason is that market exchange rate fluctuate quite a lot, and when a country’s exchange rate is high, any value expressed in the currency of that country when converted into (say) USD will also appear high.  Take wages for example: a 20 per cent increase in the exchange rate will result in a 20 per cent increase in the USD value of New Zealand wages, but New Zealanders won’t be anything like that amount better off.  The same goes for, say, GDP comparisons.   That is why analysts typically focus on comparisons done using PPP exchange rates.

But not Mr Hope.   Using the simple market exchange rate comparisons, he argues

OECD analysis however shows that NZ is not a low-wage economy. We sit in 16th place out of 35 countries in terms of average wages.

(Actually, I count 14th.  And recall that it isn’t many decades since we were in the top 2 or 3 of these sort of league tables.)

But he does then turn to the PPP measures, without really appearing to understand PPP measures.

But the OECD analysis also shows that among those countries our relative Purchasing Power Parity (PPP), a measure of how much of a given item can be purchased by each country’s average wage, is lower.

New Zealand is included among a group of countries – Australia, Denmark, Iceland, Norway, Sweden, Switzerland and the UK – where wages don’t buy as much as they could.

That’s right: Australia – where the grass has always been deemed to be greener, and Switzerland – which has long been lauded for its quality of life.

There are several possible explanations for wages in this group being higher than their PPP.

The Nordic countries have high tax rates, which support their social infrastructure but dilute their spending power.

We have lower tax rates – but the costs of housing, as an obvious example, are a lot higher in PPP terms than in other countries.

In PPP terms, the estimated average annual wages of New Zealand workers, on these OECD numbers, was 19th out of 35 countries.   The OECD has expanded its membership a lot in recent decades –  to bring in various emerging economies, especially in eastern Europe (the former communist ones).  But of the western European and North American OECD economies (the bit of the OECD we used to mainly compare ourselves against), only Spain, Italy, and (perpetual laggard) Portugal score lower than New Zealand.  On this measure.

But to revert to Hope’s analysis, he appears to think there is something wrong or anomalous about wages in PPP terms being lower than those in market exchange rate terms.  But that simply isn’t so.  In fact, it is what one expects for very high income and very productive countries, even when market exchange rates aren’t out of line.   In highly productive economies, the costs of non-tradables tend to be high, and in very poor countries those costs tend to be low (barbers in Suva earn a lot less than those in Zurich, but do much the same job).     Poor countries tend to have PPP measures of GDP or wages above those calculated at market exchange rates, and rich countries tend to have the reverse.  It isn’t a commentary on policy, just a reflection of the underlying economics.

Tax rates and structures of social spending also have nothing to do with these sorts of comparisons.  They might be relevant to comparisons across countries of disposable incomes, or even of consumption, but that isn’t what Hope is setting out to compare.

But he is right –  inadvertently –  to highlight the anomaly that in New Zealand, PPP measures are below those calculated on market exchange rates.  That seems to be a reflection of two things: first, a persistently overvalued real exchange rate (a long-running theme of this blog), and second, the sense that New Zealand is a pretty high cost economy, perhaps (as some have argued) because of the limited amount of competition in many services sectors.

But there is a more serious problem with Hope’s comparisons, one that presumably he didn’t notice when he had the numbers done.   I spotted this note on the OECD table.

Recommended uses and limitations
Real compensation per employee (instead of real wages) are considered for Chile, Iceland, Mexico and New Zealand.

Wages and compensation can be two quite different things.   If so, the comparisons across most OECD countries won’t be a problem, but any that involve comparing Chile, Iceland, Mexico or New Zealand with any of the other OECD countries could be quite severely impaired.   In many respects, using total compensation of employees seems a better basis for comparisons that whatever is labelled as “wages” –  since, for example, tax structures and other legislative mandates affect the prevalence of fringe benefits – but it isn’t very meaningful to compare wages in one country with total compensation in another.

Does the difference matter?  Well, I went to the OECD database and downloaded the data for total compensation of employees and total wages and salaries.  In the median OECD country for which there is data for both series, compensation is about 22 per cent higher than wages and salaries.     I’m not 100 per cent sure how the respective series are calculated, but those numbers didn’t really surprise me.   Almost inevitably, total compensation has to be equal to or greater than wages.   (There is an anomaly however in respect of the New Zealand numbers.  Of those countries where compensation is used, New Zealand is the only one for which the OECD also reports wages and salaries.  The data say that wages and salaries are higher than compensation –  an apparently nonsensical results, which is presumably why the OECD chose to use the compensation numbers.)

So what do the numbers look like if we actually do an apples for apples comparison, using total compensation of employees data for each country.  Here I’ve approximated this by scaling up the numbers for the countries where the OECD used wages data by the ratio of total compensation to total wages in each country (rather than doing the source calculations directly).

compensation per employee

On this measure, New Zealand comes 24th in the OECD, with the usual bunch behind us – perpetual failures like Portugal and Mexico on the one hand, and the rapidly emerging former communist countries on the other.  On this estimate (imprecise) Slovenia is now very slightly above New Zealand.  By advanced country standards, we are now a low wage (low total employee compensation) country.

But it is about what one would expect given New Zealand low ranking productivity performance.   Here is a chart showing the relationship between the derived annual compensation per (FTE) employee (as per the previous chart) and OECD data on real GDP per hour worked for 2016 (the most recent year for which there is complete data).  Both are expressed in USD by PPP terms.

compensation and productivity

Frankly, it is a bit closer relationship than I expected (especially given that one variable is an annual measure and one an hourly measure).  There are a few outliers to the right of the chart: Ireland (where the corporate tax rules resulted in an inflated real GDP), Luxembourg, and Norway (where the decision by the state to directly save much of the proceeds from the oil wealth probably means wages are lower than they otherwise would be).    For those with sharp eyesight, I’ve marked the New Zealand observation in red: we don’t appear to be an outlier on this measure at all.  Employee compensation appears to be about what one would expect given our dire long-term productivity performance.

And that appears to be the point on which –  unusually –  Kirk Hope and I are at one.  He ends his article this way

We need to first do the hard yards on improving productivity, and then push for sustainable growth in wages.

If we don’t fix the decades-long productivity failure, we can’t expect to systematically be earning more.  Sadly, there is no sign that either the government or the National Party has any serious intention of fixing that failure, or any ideas as to how it might be done.

Incidentally, this sort of analysis –  suggesting that employee compensation in New Zealand is about where one might expect given overall economywide productivity –  also runs directly counter to the curious argument advanced in Matthew Hooton’s Herald column the other day, in which he argued that wages were being materially held down by the presence of Working for Families.   In addition, of course, were Hooton’s argument true then (all else equal) we’d should expect to see childless people and those without dependent children dropping out of the labour force (discouraged by the dismal returns to work available to those not getting the WFF top-up).   And yet, for example, labour force participation rates of the elderly in New Zealand –  very few of whom will be receiving WFF –  are among the highest in the OECD and have been rising.

And, of course, none of this is a comment on the merits, or otherwise, of any particular wage claim.

Productivity: still doing poorly

I had been planning to write today about some of the recent Reserve Bank material on electronic currency.  I even took the papers away with me yesterday to read on some flights, but in the course of that reading  –  coincidentally, en route to another funeral – I discovered that a former Reserve Bank colleague, only a year or two older than me, had died a couple of months ago.    We hadn’t been close, but I’d known him off and on for 35 years beginning with an honours course at VUW in 1983, and when I’d last seen him six months or so ago he’d been confident the cancer was beaten.   What left me a bit sick at heart was that I had commented here last month, moderately critically, on a recent Reserve Bank Bulletin article of which he had been a co-author.   None of the comments were, as I reread them, personal.  But I’d have written differently had I known.  So I’m going to put aside issues around the Reserve Bank for a few weeks (and the blog is taking a holiday next week anyway).

So instead, having listened to a few upbeat stories in the last few days, including the IMF mission chief for New Zealand on Radio New Zealand this morning, talking about the “sweet spot” the New Zealand economy was in etc, I thought it was time to update some productivity charts.

Here is real GDP per hour worked for New Zealand.

real GDP phw jul 18

I’ve marked the average for the last year, and for the 12 months five years’ previously.  If anything, things have been going backwards a bit for the last three years, and for the last five or sx years taken together, productivity growth has averaged no better than 0.3 per cent per annum.  Some “sweet spot”, especially when our starting position relative to other advanced economies was already so far behind.

And here is the comparison with Australia –  in many respects the OECD economy with most in common with New Zealand (distance, resource dependence, Anglo institutions), and also the exit option for New Zealanders.

real GDP nz and aus jul 18

In 1989, when this chart starts, New Zealand was already behind Australia.   Since then, we’ve lost another 15 percentage points of ground, about 0.5 per cent per annum.  A decade ago perhaps one could have mounted an argument that the decline had come to an end: looked at in the right light, perhaps we were even showing signs of some modest closing of the gap.  But then we took another step down, and the rate of decline in the last decade as a whole has been about the same as that for the full period since 1989.

For almost a decade now, I’ve been sobered by the performance of the former eastern-bloc countries that are now part of the OECD.  Thirty years ago, when we –  already a market economy –  were in the throes of reform, they were just beginning the journey to freedom (Estonia and Latvia were still actually, involuntarily, part of the Soviet Union).   Their starting point was, of course, a great deal worse than ours –  for all the early 80s talk of New Zealand having an economy akin to a Polish shipyyard –  but the common economic goal was catching-up, reversing decades of relative decline.

In the decades since, New Zealand has lost ground relative to the richer countries of the OECD (and, as per the chart above, has lost a lot of ground relative to Australia, even more recently).  The former eastern-bloc countries have done a great deal of catching up.  They still have a long way to go to catch that group of highly productive northern European economies (Belgium, Netherlands, France, Germany, Denmark), but New Zealand is on track to be overtaken: on OECD numbers Slovakia now has real GDP per hour worked higher than that in NEw Zealand.

There are seven former eastern-bloc countries in the OECD.  The OECD is filling in 2017 data only slowly, and so in this chart I’ve shown real GDP per hour worked for New Zealand relative to the median of the six former eastern-bloc countries for which there is 2017 data (the country for which they don’t yet have 2017 data is Poland, which managed 7 per cent productivity growth in the four years to 2016, a period when New Zealand –  on the measure the OECD uses –  had none).

eastern bloc

Some of these former eastern-bloc countries had a very rocky ride (notably Estonia and Latvia, which ran currency board arrangements in the 00s, and had massive credit booms, and then busts), but the trend is still one way.  They are catching up with us, and we aren’t catching up with the sort of countries we aspire to match.

The pace of decline (New Zealand relative to these former eastern-bloc countries) has slowed, as you would expect (in 1995 it was still quite early days for post-communist adjustment) but the scale of the chart shouldn’t lead us to minimise the recent underperformance.   In 2007, we had an economy that was 20 per cent more productive than the median former eastern bloc OECD member, and last year that margin was only 12 per cent.

The measure of success in this economy shouldn’t be whether we stay richer and more productive than Slovenia or the Czech Republic.  All of us are a long way off the pace, far from the overall productivity frontier (best outcomes).    But what these former eastern bloc countries help highlight is that convergence can and does happen, if you have the right policies and institutions for your country (in all its relevant particulars).  Policymakers here used to genuinely believe that. It is no longer clear that they – or their Treasury advisers –  any longer do.

On which note, Paul Conway of the Productivity Commission recently published an interesting article in an international productivity journal on New Zealand’s productivity situation and policy options.  Commission staff were kind enough to send me a link.  Paul Conway has a slightly more optimistic take on the last decade or so than I do, but common ground is in recognising the total failure to achieve any catch-up or convergence.  There is a lot in Paul’s article –  which, not surprisingly, is not inconsistent with his earlier “narrative” on such issues that he wrote for the Commission itself, and which I wrote about here.   I will come back later and write about Paul’s analysis and prescription –  there is a lot there, some of which I agree with strongly, and some of which I’m much more sceptical of.  For my money, he materially underweights the importance of a misaligned real exchange rate as a key symptom, which has skewed incentives all across the economy.     But it is good to see public service analysts contributing substantively to the (rather limited) debate on these issues.


A puzzling government economic target

An occasional reader pointed out to me a government economic target that I wasn’t aware of.   Late last year, Communications Minister Clare Curran announced that

“The Chief Technology Officer will be responsible for preparing and overseeing a national digital architecture, or roadmap, for the next five to ten years,” Ms Curran says.

“This Government intends to close the digital divides by 2020, and to make ICT the second largest contributor to GDP by 2025.

At least one tech firm seems to think that goal is in the coalition agreement, although I couldn’t see it there.

There doesn’t seem to be much around on this goal, which is perhaps not surprising as it doesn’t seem a particularly realistic or well thought-through goal.  There are no obvious definitions or compators.    Would such an outcome even be desirable?  How would we know?

But I did find this chart in an MBIE report from last year, using data that isn’t readily available to the public.

ICT mbie

Which looks like a reasonable aount of activity, except of course that GDP in 2015 was $230 billion. so these ICT sectors in total account for about 4 per cent of GDP.

The OECD doesn’t seem to have data for all member countries, but I found this chart.

OECD ICT

New Zealand’s ICT share doesn’t seem out of line with (although perhaps a bit less than) the median OECD country.

But then I went to Infoshare to look at the breakdown of GDP by production sector.  These are the sectors that were bigger than MBIE’s ICT number in the year to March 2016 (which presumably aligns most closely with the 2015 data they quote).

GDP in year ending March 2016
Construction 15,290
Wholesale Trade 12,691
Retail Trade 11,057
Transport, Postal and Warehousing 12,377
Financial and Insurance Services 14,604
Rental, Hiring and Real Estate Services 18,021
Owner-Occupied Property Operation (National Accounts Only) 16,429
Professional, Scientific and Technical Services 19,935
Education and Training 11,436
Health Care and Social Assistance 15,095

Which industries, I wondered, did the government envisage being displaced by the ICT sector?  For example, the government also seemed to be aiming to build a lot more houses, and encouraging more people into education and training.   Which industry do you expect will still be ahead of ICT by 2025 (only seven years away now)?

And how realistic is any of this anyway?   That MBIE chart above looks quite impressive at first glance.  But as a share of total GDP, those ICT subsectors in total did not change from 2007 to 2015.   What policy changes, already announced or in the works, are likely to transform the prospects of these sub-sectors in just a few years?

In a post last year, I pointed to some other indicators of how these technology sectors just haven’t been growing to anything like the extent the boosters would like us to believe (although of course there are individual firm success stories).   Sadly, of course, that is really the story of our tradables sector as a whole –  which has managed no per capita growth at all this century.

UPDATE: From some digging around it appears that the government’s target, championed by Clare Curran is even flakier than I imagined.  Apparently at a recent select committee hearing she claimed that the technology sector was New Zealand’s third largest exporter and that she hoped it would become the “second largest contributor to the economy”.   This “third largest exporter” claim appears to come from last year’s TIN report (critiqued here), where the total foreign sales of NZ-owned tech firms are treated as New Zealand exports (for comparisons with official export data of other sectors).  As I noted in my critique, this is a nonsense claim: much of the value in many of these foreign sales is generated abroad (eg both F&P companies have large manufacturing operations abroad).  In their 2017 ICT report, MBIE talk of ICT exports of around $1 billion per annum (about 0.3 per cent of GDP).    As I showed in my earlier post, tech-like services exports as a share of GDP has barely changed this century (and the profitability of New Zealand firms operating abroad also seemed pretty weak).

To put the numbers in perspective, here is an extract from a recent SNZ table

Total exports
By top 30 categories
Year ended March
Commodity / service Exports (fob)
2017 2018
NZ$(million) % of total NZ$(million) % of total
Milk powder, butter, and cheese  11,547  16.5  14,174  18.2
Business and other personal travel  10,012  14.3  10,879  14.0
Meat and edible offal  5,983  8.5  6,797  8.7
Logs, wood, and wood articles  4,133  5.9  4,828  6.2
Education travel  3,547  5.1  4,025  5.2
Fruit  2,758  3.9  2,648  3.4
Air transport  2,158  3.1  2,451  3.1
Wine  1,627  2.3  1,723  2.2
Mechanical machinery and equipment  1,596  2.3  1,683  2.2
Fish, crustaceans, and molluscs  1,586  2.3  1,619  2.1
Preparations of milk, cereals, flour, and starch  1,213  1.7  1,558  2.0
Miscellaneous edible preparations  1,162  1.7  1,305  1.7
Aluminium and aluminium articles  982  1.4  1,152  1.5
Electrical machinery and equipment  999  1.4  1,071  1.4
Casein and caseinates  826  1.2  904  1.2
Optical, medical, and measuring equipment  829  1.2  873  1.1
Wood pulp and waste paper  721  1.0  858  1.1
Telecommunications, computer, and information services  875  1.2  848  1.1

Relative poverty: old and young

When I was working on my lecture last month on productivity as the best sure basis for dealing with poverty across a society as whole, I did take the opportunity to read around some of the literature on child poverty in New Zealand.   A line that used to be quite common in the New Zealand debate was that we had high rates of child poverty but low rates of poverty among old people, and that this represented some mix of a misplaced sense of priorities and some imbalance in political clout.  On checking, I see that I previously used the “low poverty rate among the elderly” argument myself in a published report.  On further checking, this was the sort of chart we used to see.

oecd elderly poverty chart 2000s

I’m fairly sceptical of these measures of poverty or deprivation.   They are mostly measures of (in)equality rather than of poverty, being calculated as the percentage of people in any particular group with incomes less than some threshold percentage (typically 50 or 60 per cent) of the (equivilised) median.     Real incomes for everyone could be doubled over time – by some mix of economic good fortune, innovation, and fine management –  and yet if the distribution of income didn’t change, we’d be told that exactly the same share of the population was still in “poverty”.  Sure, the detailed reports will specify that what they are measuring is relative “poverty”, but (a) that is almost a meaningless concept (whereas income or consumption inequality is not), and (b) the “relative” qualifier is usually too readily lost sight of once we shift from detailed technical reports to political debate and the like.     And so, a few months ago we had a  (very capable and well-regarded) visiting economist and politician noting in his lecture that child poverty rates (on these measures) were very similar in New Zealand and Australia, while failing to mention that average or median incomes in Australia are much higher in Australia than in New Zealand   People will be classified as “poor” in Australian who would be close to the median income in New Zealand.

Of course, there is a place for redistributive policies, but over time lifting overall rates of productivity make much more difference: the difference between the “poverty” most New Zealanders lived with (by today’s standards) when we were the richest country in the world a century ago, and the living standards of today.

But the specific point of this post, was this OECD chart I stumbled when I was thinking about poverty issues.  The differences in the differences between male and female rates look as though they could be interesting, but my focus is on the blue bars –  the number for the entire population aged over 65.

elderly poverty

OECD data used to (see first chart) suggest that New Zealand had some of the very lowest rates of elderly “poverty” anywhere.  But, apparently, that is no longer so.  On this measure –  using the 50th percentile –  New Zealand elderly “poverty” rates are still a little below the OECD total, and are actually a little above the OECD median (the countries labelled in italics are not OECD members).

And even in the days when numbers like those in the first chart were widely cited, people used to point out that it made quite a difference whether one looked at the 50th percentile, or (say) the 60th.  The widely-quoted child “poverty” measures in New Zealand typically use the 60th percentile.

Somehow I managed to find the underlying data for the elderly on the OECD website.  The tables say that there is a new measure being used since 2012 (and thus the difference between the first two charts).   Here is an aggregate chart showing the share of the population aged over 65 with income below 60 per cent of median equivilised disposable income (ie the same measure as in the OECD chart above, just using a different percentile threshold).  Here are the data for 2015 (or most recent).

elderly poverty 60%

I was quite taken aback when I saw those numbers.   The results of this new methodology are so different from those under the old methodology (at least for New Zealand) that one would need to dig into the new and old methodologies to be at all comfortable with the results.  After all, it is not as if NZS policy has changed materially over the last 15 years or so, and we know that a relatively high share of New Zealand over-65s are still in the workforce.    And given the universal coverage of NZS, I find it a little difficult to believe that our elderly (relative) “poverty” rates are so much higher than those in, say, the United States.   Then again, it is interesting to see the Australian numbers – especially when we hear occasional calls to adopt something more like the Australian system (compulsory private savings and a means-tested age pension) here.

But if the OECD numbers are to be taken seriously at all, it looks as if  –  relative to the rest of the OECD –  our child poverty scores might be not much different than those for our elderly.   This is the OECD data on child “poverty” using the same 50th percentile benchmark as in the fancy OECD chart above.

child poverty 2014

New Zealand almost identical to the OECD average.

There will, unfortunately always be pockets of extreme deprivation and perhaps even absolute poverty (often perhaps not well-captured in these sorts of aggregate charts).  Some of that –  even after welfare system redistribution – will be about culture, some about personal poor choices, and some about misfortune.  Some of it will even be about atrocious policies –  for example, land use law in New Zealand.

But what we do know, with a very high degree of confidence, is that overall average material living standards –  for children, the old, and everyone in between –  in New Zealand are well below those in most of the “old” OECD countries, that we used to far exceed.  Remember the statistic I’ve quoted previously: it would take a two-thirds lift in average productivity in New Zealand to match that on average in Germany, France, Netherlands, Denmark, Belgium, and the United States.   The best way to sustainably –  including politically sustainably – and substantially lift the living standards of those at the bottom is to lift productivity across the economy as a whole.  And there is little sign that the government or the Opposition have any ideas as to how to turn the decades of underperformance on that score around,


The government consults on slashing productivity growth

Since the current government took office, I’ve highlighted from time to time (eg here) the tension between the rhetoric about the desire to lift New Zealand’s productivity performance (poor for decades, woeful in the last five years or so) and to increase the outward orientation of the economy,  and the specific policy promises which mostly seem likely to work in exactly the opposite direction.

The determination to reduce carbon emissions even more aggressively than the previous government’s goal, especially while sticking with a largely unchanged immigration policy that continued to drive up the population, seemed a prime example. I didn’t have any numbers, but the direction of the effect seemed pretty clear.

But now the government has published some numbers, which really should be getting a lot of attention.    Yesterday the Green Party leader James Shaw (Minister of Climate Change) launched a consultative document on what form the “net zero by 2050” target might actually take.  Perhaps naively, I’d assumed they had meant what they said, but in fact they are consulting on three quite different variants.

  • Net zero carbon dioxide by 2050: this target would reduce net carbon dioxide emissions in New Zealand to zero by 2050 (but not other gases like methane or nitrous oxide, which predominantly come from agriculture).
  • Net zero long-lived gases and stabilised short-lived gases by 2050: this target would reduce emissions of long-lived gases (including carbon dioxide and nitrous oxide) in New Zealand to net zero by 2050, while stabilising emissions of short-lived gases (including methane).
  • Net zero emissions by 2050: this target would reduce net emissions across all greenhouse gases to zero by 2050.

The third of those was, I think, was what most people had in mind.

Somewhere in the consultative document the first of these options is described as not being that different, in overall effect, from the target put in place by the previous government.

At the front of the report, the language –  not just from the Minister but from the MfE bureaucrats is very upbeat.    From the bureaucrats’ Executive Summary

This is our chance to build a high value economy that will hold us in good stead for the future. By upgrading our economy and preparing for the future, we can help make sure quality of life continues to improve for generations to come.

To read that, you’d suppose that pursuing ambitious emissions targets would make us richer, and better off in material terms.

A few paragraphs on the MfE officials suggests that the British have already shown us the way

Our economy is already dynamic and constantly adjusting to change. Jobs are continually created and lost. For some of us, the changes through the transition could be small or not noticeable – we could be driving vehicles powered by 100 per cent renewable electricity. For others, the changes could be bigger. The transition will affect how we travel, use land and what we produce and consume. Other countries, such as the UK, have shown that it is possible to reduce their emissions while growing their economy and maintaining a high standard of living.

This is probably what they had in mind (using OECD data which still only goes up to 2015).

emissions uk nz 1

That certainly makes the UK look good relative to us.

Then again, here is the emissions data for the two countries per unit of GDP.

emissions uk nz 2

The drop in emissions per unit of GDP has been almost exactly the same, over 25 years, in the United Kingdom as in New Zealand.   Our numbers are a lot higher than those in the UK but (for example) their economy trades with bankers/lawyers etc and ours trade with sheep and cattle.   There are different opportunities and different emissions profiles.

(And, as it happens, productivity growth in the UK in the last decade –  although not prior to that – has been materially worse than that in New Zealand.)

So the upbeat story about other countries having blazed a prosperous trail doesn’t really seem to have anything to it, at least in the one example MfE cites.  The main difference between the total emissions profiles is simply that we’ve adopted policies that raised our population much faster than the population growth in the UK.  It really is almost as simple as that.

But after the upbeat introduction, a bit of realism starts to creep in.

As we reduce emissions, the economy will continue to grow but possibly less quickly.

Only “possibly” though, although one’s confidence should have been waning already when a few lines later one reads that

We will need to invest in innovation and plant a lot more trees, to ensure we maintain a strong economy over the coming decades.

Because we all know that advanced countries get and stay rich by planting (lots and lots of) trees.  At best, it seems that they are likely to be a mitigant –  absorbing carbon emissions possibly more cheaply than some other methods.  They aren’t likely to add to our productivity or per capita income.

To the credit of the Ministry, they have had some modelling estimates done, and the Minister has allowed the summary results to be published.   It is not very satisfactory that the full model results have not been published yet, in what is a fairly short consultative period.  In fact, the suggestion is that the modelling work hasn’t even been finished yet

This and future material will be published on the Ministry for the Environment website as it is finalised.

But better to have what they did publish than to have to try to get it out of them via the Official Information Act.

NZIER was commissioned to do some modelling on the impact on GDP of the various net zero target options.  This is the table reproduced in the report.

emissions NZIER

As MfE observes

The analysis by NZIER suggests that GDP will continue to grow but will be in the range of 10 per cent to 22 per cent less in 2050, compared with taking no further action on climate change.

(Note that emissions per unit of GDP have been steadily trending down for decades as it is –  see first chart above.)

These are really big numbers.  I have never before heard of a government consulting on a proposal to cut the size of the (per capita) economy by anything from 10 to 22 per cent.  And, even on their numbers, those estimates could be an understatement.

The baseline assumptions NZIER have used produce average real GDP growth over 2017 to 2050 of 2.2 per cent.  They do not lay out the assumptions in more detail, but Statistics New Zealand population projections show average population growth over that period of 0.7 per cent per annum, so they seem to be assuming baseline productivity growth of something like 1.5 per cent.  That would be high by the standards of recent decades, but (except for rhetorical purposes) it does not matter very much: the focus is on the difference the various carbon emissions targets make to future productivity growth.

The numbers in the table do not show the unadorned comparisons.    They helpfully show the difference the varying degrees of ambition in the possible net emissions targets makes: the more ambitious the target, the worse the expected economic growth.  But in each of the three different scenarios (described in the very top line of the table), the modellers assume that the magic fairy helps out.     They assume faster rates of innovation in these particular sectors, over and above what is embedded in the baseline assumed rate of productivity growth.   This is how they describe it:

  • faster energy innovation occurs, driven by higher emissions prices and transitional policies that double the baseline energy efficiency trends across all industries and provide a shift to 98 per cent renewable energy by 2035 with the remaining 2 per cent used being gasfired generation in dry years only
  • faster transport innovation occurs, driven by higher emissions prices and transitional policies that increase electric vehicle uptake to 95 per cent of the light vehicle fleet and 50 per cent of the heavy vehicle fleet by 2050
  • faster agricultural innovation occurs, this sees a one-off innovation of a methane vaccine introduced in 2030 being adopted across all farms, which reduces dairy emissions by 30 per cent and sheep and beef emissions by 20 per cent. A reduction in global demand for dairy (11 per cent fall in 2050 output from 2015 levels) and sheep and beef (15 per cent fall) is experienced as consumer preferences shift towards lower emissions intensive foodstuffs, such as synthetic meats.

All of which might be fine, but there seems to be no allowance at all for the possibility that higher input costs etc might discourage investment in innovation (relative to baseline) elsewhere in the economy.  Affordable energy was, after all, a huge contributor to economic development in the last few centuries.

So on the best-case magic ferry scenario (the furthest right column) –  with much increased innovation in these sectors, and no offset elsewhere –  the full net zero target by 2050 would result in GDP in 2050 being a full 10 per cent lower than otherwise  (with 20 per cent of assumed overall productivity growth just given up).

If we only get the added innovation in agriculture, or only get it in transport and energy, the sacrifice is perhaps 40 per cent of all productivity growth (the difference between the 2.2% GDP growth baseline, of which productivity growth is about 1.5%, and the 1.5% and 1.6% GDP growth scenarios (in which productivity growth is only 0.8 or 0.9 per cent)).     A sacrifice of 0.7 per cent annual productivity growth for 33 years means accepting living standards 26 per cent lower than otherwise by 2050.

Again, to the credit of the government, they are also explicit about where the costs are likely to fall

Modelling shows the impact of domestic climate action would be felt more strongly by lower income households, because a higher proportion of their spending is on products and services that are likely to increase in cost as we reduce emissions across the economy.
Our modelling suggests the households that are in the lowest 20 per cent bracket for income may be more than twice as affected, on a relative basis, than those households with an average income.

Quite breathtaking really.   We will give up –  well, actually, take from New Zealanders –  up to a quarter of what would have been their 2050 incomes, and in doing so we will know those losses will be concentrated disproportionately on people at the bottom.   Sure, they talk about compensation measures

The Government has a number of tools it could choose to use to compensate affected households for higher costs, such as tax or welfare measures.

But the operative word there is could.  The track record of governments –  of any stripe –  compensating losers from any structural reforms is pretty weak, and it becomes even less likely when the policy being proposed involves the whole economy being a lot smaller than otherwise, so that there is less for everyone to go around.  The political economy of potential large scale redistribution just does not look particularly attractive or plausible (and higher taxes to do such redistribution would have their own productivity and competitiveness costs).

I guess I am impressed that the government was willing to publish a document suggesting adopting a policy which it openly documents would come at such a large potential cost to New Zealanders (substantial even if the magic fairy comes to our aid to the extent assumed in these scenarios).  It must surely be a first in history.   No one asked the citizens of, say, 1948 Czechoslovakia if they wanted to be impoverished (relative to a faster growing West).  But it is hard to see what is in for New Zealanders –  lagging badly behind other advanced countries on productivity anyway, with constant complaints about child (and other) poverty) – to just happily sign in to such a huge economic sacrifice?   And for what?

I guess these targets are advocated by zealots, but even the zealots surely recognise that what New Zealand does is not going to change the climate, and that many countries already richer and more productive than we are are proposing adjustments that are materially less costly or demanding that what the New Zealand government is proposing here.   I am not suggesting we can or should do nothing –  there is some minimum effort probably required to ward off the threat of trade sanctions –  but surely on any reasonable cost-benefit assessment of the interests of New Zealanders, we would be confronting these costs – the wilfully given up opportunities for our kids and grandchildren –  and pulling back?  Or we might be thinking again about whether deliberately boosting the population –  bringing people to a country with high baseline emissions per unit of GDP –  is sensible for the world, or (more importantly) for our own people.  I would be keen to see a variant of the NZIER results in which the population growth (and thus baseline emissions growth) was materially lower than what is assumed, based on current immigration policy.

To repeat, I would be surprised if ever before in history a democratic government has consulted on proposals to reduce the material wellbeing of its own people by up to 25 per cent.      Wars, of course, come at a very considerable cost –  and sometimes are worth fighting –  but again, I doubt any democracy (or perhaps even any tyranny) ever entered a war thinking that as a result of doing so they would be so much poorer 30 years on.  It is simply a breathtaking proposition –  the more so in a country that at the moment struggles to achieve any material productivity growth at all.

And as a reminder of what productivity means, see this recent post.

UPDATE: One issue I didn’t spot earlier is how there can be no marginal cost in going from the 75% to the net zero option, under either of the two scenarios shown.  To one decimal place, the assumed average growth rates are identical.  Given that going from 75% to net zero involves dealing with the short-lived gases (from agriculture), which are some of the most intractable issues (without dramatically shrinking the industries), it is difficult to see that this particular model result can be plausible.   But, to the extent, that the model results are the same under the two alternative targets, it undermines the case made by some that this document represents the government trying to walk back the original commitment to (true) net zero.