Exporting: the failure of one small OECD country

The current government has a published target for increasing the share of exports in GDP.  I’ve argued previously that that was unwise, for a bunch of reasons, including the risk that it can encourage measures that might boost exports (to meet the target) but which don’t pass standard tests of good economic policies. I’d probably put enhanced film subsidies in that category –  the export incentives of the current generation.  But, equally, setting targets without any supporting economic strategy to deliver sensible results that meet the target has its own problems.

Despite all that, I suspect no one who cares about improving New Zealand’s medium to long-term economic performance is indifferent to the export performance of New Zealand firms, and the  New Zealand economy as a whole.  After all, the wider world is where most of the potential markets are –  especially for firms from smaller countries.  Perhaps there are examples, but I’m not aware of cases of countries that have markedly improved their economic performance on a sustainable long-term without a robust export sector (and tradables sector more generally) being part of that success.

I showed a chart the other day with a snapshot comparison of export shares in Australia and New Zealand in 1980 and 2014.  New Zealand hadn’t done well.  But how have we done over the decades not just by comparison with Australia, but compared with the wider group of advanced countries?

The OECD has data on exports as a share of GDP going back to 1970 for 27 countries, including New Zealand.  Here is the chart, comparing New Zealand with the median of those OECD countries.

exports as a share of GDP

For an individual country, in particular, there is quite some variability.  Thus, the combination of the sharp fall in our exchange rate in 2000 with high dairy prices temporarily boosted New Zealand’s exports to around 35 per cent of GDP.  But if one focuses on the trends, one could say that broadly speaking we had kept pace with the growth of exports in other OECD countries until around 2002/03.  But over the last 15 years, even though world trade growth slowed sharply late in the 2000s and has never really recovered, New Zealand has fallen well behind.

Only rarely is all the information in a single chart.   This isn’t one of those times.  Part of what has gone on, especially in Europe, is the growth of “global value chains”: whereas previously a car might have been designed and built entirely in Germany, and then exported, now often enough there is a lot of gross cross-border trade in the design and manufacturing phase, before the finished product is sold.  That inflates gross exports (and imports) and overstates the growth in economic value-added associated with exporting.  We don’t have up-to-date value-added data, nor a good long time series.  On the other hand, this didn’t suddenly start becoming an issue in 2003.

We also know that:

  • small countries tend to export and import larger shares of their GDP
  • far-away countries tend to export and import smaller shares of their GDP

Both these points need to be kept in mind. The first doesn’t have any very obvious implications: were Belgium to split in two, exports and imports as a share of the respective  GDPs of Flanders and Wallonia would rise even if no transactions were done differently after the split than before it.    But the distance point does have implications.  For whatever reason, distance is an obstacle to foreign trade, even that in services (it is probably not typically the dollar transport costs, but something about time taken to ship goods, and the physical proximity of people –  customers, potential staff, even competitors), and makes it harder –  all else equal –  for distant places to prosper.  Not surprisingly then, one doesn’t find too many people in very distant places.

But reverting to size, here is how the chart above looks if we focus only on the small countries the OECD has data for.  In 1970 only two OECD countries –  Iceland and Luxembourg –  had smaller populations than New Zealand.  We had just under 3 million people, and at the time Norway, Ireland, Denmark, Finland and Israel had fewer than 5 million people.

exports small countries

The recent divergence is, if anything, even more stark.  Our export share of GDP in 1970 was already low by small advanced country standards –  and had shrunk, as one would expect, during the years of heavy protectionism.  But the gap has materially widened only in the last 15 years.  Some of that will be the (profitable) growth in Europe in cross-border trade as part of the production process. But it certainly isn’t the whole story.

What makes me fairly confident of that claim?  Two things really.  The first is this chart (which I’ve run before), the indicative breakdown of New Zealand’s per capita GDP into tradables and non-tradables sectors.  Something here changed, quite materially, in the early 2000s.

pc gdp components

And the second is our exchange rate.  Here is the real TWI, using Reserve Bank data updated to capture the last few months.

real exch rate

Our real exchange rate has always been quite variable.  But if anything over the last decade or so there has been a bit less variability than in the preceding decades.  And probably more importantly, the average real exchange rate since the start of 2004 has been 20 per cent higher than the average over the previous 20 years (the period for which the Reserve Bank has the data).

That would be great if it had reflected a marked improvement in our relative productivity performance. But, of course, it hasn’t.  And perhaps unsurprisingly our tradables and export sectors have really struggled.

Of course, the real exchange rate isn’t simply a policy lever governments pull.  It is an outcome of other factors –  some policy, some market.  And quite what those factors were is a topic for other days.  For today, I simply encourage to reflect on how poorly New Zealand continues to do, and especially in building and expanding sales to the rest of the world, drawing on the high level of skills of our people, and the talents of our firms.


Immigration is “a good thing”, and that is all we need to know

I’ve been struck again over the last few days by the determination of our “elites” –  whether from the left-liberal end of the spectrum, or the (rather smaller) libertarian end – not to actually engage with the data on New Zealand’s experience of large scale immigration.

In their amusing tongue-in-cheek simplified retelling of English history, 1066 and all that, Sellars and Yeatman had most things classified as “a good thing” or “not a good thing”.

There seems to be a world view, straddling National, Labour and the Greens, and ACT as well, that in some sense “immigration is a ‘good thing'” and that is really all that needs to be said on the matter.  Much the same goes for the media.  The plebs just need to get with the programme –  perhaps having it explained to them again, slowly and clearly this time, that immigration is a “good thing”.   Any skepticism is too often deemed to reveal more about the character of the sceptic, than the merits of the economic case.

There is a respectable theoretical argument (at least within the narrow confines of economics) to be made for an open borders policy.  But the fact that no political party I’m aware of –  here or abroad –  actually argues for such a policy is probably quite telling.  Within the EU, there is a particularly respectable case for open borders –  the EU-enthusiasts see the countries of Europe as being on a transition to a political union.  Only brutal authoritarian countries –  think China – want to control migration of citizens within their own country.  But, as it happens, most Brits didn’t want to be part of an EU political union, preferring to govern themselves.  Polls suggest citizens in most other EU countries also don’t want such a union.

Even without political union, there can be a reasonable case for an easy flow of people across borders.  New Zealand and Australia are two different countries, and that doesn’t seem likely to change.  And yet there have never been direct immigration restrictions on people moving among the various colonies (pre 1901) or between the Commonwealth of Australia and New Zealand (since then).    In practical terms, the barriers to moving – especially from New Zealand to Australia –  have been getting higher in the last few decades, as Australian welfare provisions etc and citizenship have become progressively less readily available to New Zealanders.  On my reckoning, New Zealanders have gained considerably from this ability to move to Australia, especially as the large income and productivity gaps have opened up in the last 50 years.  Some New Zealanders relocated and took direct advantage of the higher incomes and better opportunities abroad.  The rest of us benefited –  at least in principle –  because the departures from this land of (apparently) diminished opportunities eased the pressure on living standards here.   Whether Australians have benefited from the easy flow of people across the Tasman is more arguable.  There are reasonable arguments (and, thus, models) for small gains, small losses, and not much difference at all.

Even within the context of a system of immigration controls, there can be a variety of motives for allowing immigration.  There is the humanitarian perspective that governs refugee policy.  We don’t take refugees because it is good for us, but because it is good for them –  people whose homelands have become impossibly difficult.  If the refugee intake ends up benefiting us economically that is a bonus, but it isn’t –  or shouldn’t be –  what drives us.   And, of course, we allow New Zealanders who marry abroad to bring their spouse home, and to become a New Zealander.  Again, there isn’t an economic motivation behind those provisions.    And some countries have real problems controlling their borders, and get stuck with people they never intended to allow in.

But we do control our borders and the bulk of New Zealand’s non-citizen immigration programme has an economic focus.  MBIE, and the government, have described the immigration programme as a “critical economic enabler” for New Zealand –  a phrase which sounds sillier, and emptier, each time I write it, but which is at least honest.  We take migrants   –  lots of them (three times the per capita inflow in the US) – on the hypothesis that doing so will help New Zealanders economically over the medium to long-term.  We certainly needed “critical economic enablers”, so poor has our economic performance been over the post World War Two decades.  And there are plausible hypotheses for how immigration can help, at least in the abstract.

But several decades on, surely the advocates, administrators, and cheer leaders of the programme should be able to point to economic gains for New Zealanders? It doesn’t seem an unreasonable request, given the economics-based case made for the programme.   The presence of a wider range of ethnic restaurants, or the success of the All Blacks, are all very interesting –  although, to be honest, I hadn’t seen too many new English restaurants (the UK is still the source of more new residents than any other country)  – but that isn’t the case that has been made.  New Zealanders are supposed to have been made better off economically by large scale immigration.  And if there is evidence of those gains, the champions of the programme are strangely reluctant to cite it.

And so we have Liam Dann in the Herald this morning

Australians have been panicking about immigrants and to some extent their loss has been our gain.

Migration-driven GDP growth through a period of commodity price downturn has been a timely break for our economy.

….

There are risks that high immigration disenfranchises those at the bottom of the social ladder.

We need to ensure we have social policy to protect people from losing out and turning their anger towards migrants. We need to remember the current surge is not driven just by the more highly visible arrivals of different culture and ethnicity.

It is being driven by New Zealand passport holders.

History tells us this wave will not last. And that when it passes it will have left this country richer and stronger.

It is a strange argument.  After all, had the economy of our largest trading partner been doing better, presumably that would have helped our economy not hurt it.  And if demand had been weak here –  as actually it has been –  we could have had lower interest rates and a lower exchange rate, the latter in particular would likely to have been helpful.

And then, apparently confusing the variability in the NZ citizen immigration with the baseline large inflow of non-citizen migrants, he worries about people at the bottom “losing out”.  But this appears to be only about perceptions because he knows that when the current immigration surge ends “it will have left this country richer and stronger”.    That is, certainly, the logic behind the immigration programme.  But where is the evidence?  There is no sign that the income or productivity gaps between New Zealand and Australia are closing.  They haven’t closed after the previous waves of immigration either.  It seems to be based on little more than a wish  – and that same underlying belief that somehow high immigration is a “good thing”.

The Prime Minister on Q&A yesterday was no better.   Corin Dann put to the Prime Minister the case recently made by leading businessman (and economist) Kerry McDonald that high rates of immigration to New Zealand are quite damaging.  The Prime Minister responded that he “didn’t think the evidence bears that out”.   But he offered no evidence at all.   He mentioned wage increases in New Zealand, but when the interviewer pointed out that there was still a very large gap to Australia, all the Prime Minister could offer was the defensive “well, we’ve trying to close that gap for a long time” (really?) and “most New Zealanders would say we are making some progress”.  If the numbers supported his case, presumably he’d have quoted them.  They just don’t.  As I illustrated on Saturday, the gaps to Australia have just continued to widen –  not by large amounts in any one years, but little by little.  There is still a net outflow of New Zealanders to Australia, and if it isn’t as large as it was that seems to be mostly because the Australian labour market is tougher than it was, rather than that New Zealand is doing well.  (Again, as I illustrated on Saturday, both New Zealand and Australia have relatively high unemployment rates at present, and the gap in our favour is no larger than it was on average over the last couple of decades).

The Prime Minister was challenged on political spin in the interview, and he acknowledged that both governments and oppositions do it.  It was certainly on display in the answers on immigration.  The Prime Minister likes strong immigration because it is a “vote of confidence in New Zealand”.  Which might sound good for the first five seconds, until one remembers that for New Zealanders not leaving it is mostly that Australia isn’t doing that well either right now, and for those coming from emerging countries, New Zealand is richer than, say, India, China or the Philippines.  None of that tells one anything about whether New Zealanders are gaining from the large scale programme.  Similarly, the PM fell back on the “house prices are a quality problem” type of argument –  suggesting that Auckland was no different than cities around the advanced world with population pressures.  Perhaps he could check out Atlanta and Houston some time.

In a serious interview, on a major issue, the Prime Minister was simply unable to offer any evidence –  or even good arguments –  for how New Zealanders were actually benefiting from the immigration programme that he continues to run (the same programme his predecessors ran).  It should be a clue that there just aren’t such benefits.  With all the resources of the state at his disposal, including state-funded research programmes for advocates of the current policy, and he can’t articulate the benefits for New Zealanders.  Something seems wrong.

This week’s Listener –  house journal for the left-liberal establishment – had a lot of advocacy material on (the perils and woes of) Brexit –  epitomized perhaps in the column of the Otago university professor who concluded

Enough is enough. The British Government must halt its plans to proceed with Brexit and organize a second legally binding referendum to determine Britain’s future relations with the EU.

Vote again –  and again –  until the people deliver the approved answer.

Political columnist Jane Clifton dealt with immigration issue.  She observed

But the bitterest Brexit realisation is the damage that ensues when governments fail to “sell” immigration.  That’s the most urgent lesson for our MPs to swat up, because anti-immigrant sentiment is seldom far from the surface here. A sizeable bloc of British voterdom simply does not believe that immigrants enrich their country and stoke economic growth and job opportunities. And who can blame them, since in many long-term depressed areas, there’s precious little evidence of it.

Here, immigrants are increasingly copping referred anxiety about Auckland’s growing pains. Rather than document and illustrate the benefits of migration, the Government simply refuses to engage on any other level than to call the anxious xenophobic or racist

I’m not sure that last phrase is correct.  So far, to the extent there has been a discussion, it has mostly been free of that sort of thing.  [UPDATE: That was before I saw these comments from the Minister of Immigration.]   But the more general point holds.  The government simply does not, and perhaps cannot, illustrate the benefits of the programme for New Zealanders as a whole.  The alternative approach seems to be instead to whistle to keep spirits up, and attempt to spin the problems into a story of some sort of success.  If there really is now a robust case to be made for current policy, it should be beneath our government to rely on such feeble assertions.   Clifton herself, of course, seems unable to recognise the possibility that there may not be such benefits to New Zealanders –  that it might just be an economic experiment that has failed.

These days, we have serious figures from the centre-right, such as Don Brash and Kerry McDonald, arguing that our immigration policy is flawed, and probably damaging to the fortunes of New Zealanders, but our media and political elites remain enthralled with an “immigration is a good thing” mentality, unwilling or unable to engage with the specifics of New Zealand’s circumstances, location, and general ongoing economic underperformance.

And it carries across to housing policy.  In the last week, there have been a couple of serious contributions to the debate as to “what should be done” about housing, from, Eric Crampton and Arthur Grimes (and here). I agree with a fair amount of Crampton’s piece, and disagree with a fair amount of Grimes’s –  which is notable for wanting to ride roughshod over the rights and interests or existing residents.  But where they unite –  from the left-liberal end of the spectrum and the libertarian end –  is in avoiding any serious discussion about the high baseline target rate of immigration.  Now, I’ve always argued that as a first best we should try to sort of our housing supply issues –  Atlanta and Houston have –  and ideally have a separate conversation about immigration (since my arguments about the damage immigration policy seems to be doing are not at all reliant on house price stories).  And if there were any evidence that rapid inward migration was in fact boosting the fortunes of New Zealanders as a whole that might be a particularly robust case.  But…..there is none, or certainly none that the advocates have advanced.  Instead, we know that Auckland’s GDP per capita has been falling relative to that in the rest of the country for 15 years (as far back as the data go) and the margin by which GDP per capita in Auckland exceeds that in the rest of the country is now very low by international standards.  And if there is no sign that rapid immigration-driven population growth is helping lift New Zealanders’ income, while the political difficulties of fixing housing supply remain large, the  case for cutting back the target inflow is strong.  Doing so would immediately ease house price pressures  –  and without riding roughshod over property rights through use of compulsory acquisition powers that the government and economists now seem to favour –  and at worst not harm our medium-term income prospects.

As a reminder, the OECD produced new data only last week suggesting that the skill levels of adults in New Zealand are among the very highest anywhere (and that, as in most advanced countries, the skill levels of the average immigrant are a bit lower than those of the native-born.  To the extent we’ve managed to grow our exports –  the foundation of long-term prosperity  –  it has mostly been in natural resource based industries (complemented by the heavily subsidized film industry and the subsidized export education industry) where numbers of people just don’t help much, if at all.  There is no compelling economic case –  and recall it is economics that supposedly drives our immigration policy –  for using policy to deliver lots more people to New Zealand.  The Prime Minister, the leader of the Opposition, the Greens leaders all seem to disagree, as do the media establishment, but none of them can offer a clear simple straightforward data-driven explanation for why.

I’m not sure if there is a risk of a serious social/political backlash of the sort senior lawyer and former ACT MP Stephen Franks talks of.  But I certainly hope there is an economic backlash before too long. The alternative is, most likely, that our long slow relative decline continues –  and any other decent policies we adopt, and the skills and capabilities that our people possess, are constantly battling up hill, in face of an ideology (no doubt mostly well-intentioned) convinced that “immigration is a ‘good thing’ for New Zealand”.  In economic terms it doesn’t seem to have been so for a long time.

In a Listener article a few weeks ago, my former colleague (and New Zealand historian) Matthew Wright was writing about the early pre-1769 history of New Zealand.  One line in particular caught my eye:

New Zealand was the last large habitable land mass on Earth reached by humanity. The long journey of our species from Africa’s Rift Valley into the wider world ended, it seems, on the Wairau Bar.

New Zealand has produced pretty good living standards, at such great distance, for a small number of people.  In the halcyon days  –  when our relative performance was at its best –  we had a quarter the population we now have.  New Zealanders saw something going wrong decades ago and started leaving in large numbers –  in outflows that, as a share of the population, are really large by past international standards –  and haven’t yet seen fit to reverse that judgements.  Distance isn’t dead, but our government’s immigration policy –  in thrall to the ideology –  seems to assume that wishing it so can make it so.  We need to be much more cautious, and evidence/experience driven, in continuing to pursue an economic case for an ever-larger population


NZ and the UK: strongest performers in their blocs?

An article in yesterday’s Herald caught my eye. In a double-page feature on Brexit, it was headed “Options beyond the EU” and featured some comments from the former New Zealand Minister of Finance, Ruth Richardson.  I was a bit puzzled by the article, which didn’t really seen like a New Zealand article, but wasn’t attributed to any foreign newspaper or wire service.  When I checked it out, it turned out that it was a backgrounder that had run as part of a series in the Telegraph three months ago looking “at four non-EU economies to see if they could provide a model for Britain’s post-Brexit future”.  One was New Zealand.   (The Telegraph had gone so far as to described Richardson as  a”great economic reformer”, although the Herald quietly deleted the “great”.)

Several passages interested me:

Ruth Richardson, a former New Zealand finance minister and a great economic reformer, believes there is a clear parallel between the two nations, and the choice that each will face. “When Britain decided to become very closely connected [with the EU], Britain was regarded as the sick man of Europe,” she says, with the UK “almost on the brink of the International Monetary Fund dictating policy” to it. Similarly, “when New Zealand decided to explore closer economic relations with Australia, we were clearly the sick man of Australasia”.

However, Richardson says, “nations ought not to be trapped by historical perspective”. She believes that the arguments behind a once sensible decision may have shifted. As in business, decisions over a country’s political future should be made on the basis of what will work best in the here and now, Richardson says.

Both the UK and New Zealand have risen to become the strongest performer in each of their respective blocs, and the reasons to pivot towards emerging markets have become clear.

And

A pair of radical politicians helped New Zealand through this difficult period. Richardson was the finance minister in a Right-of-centre National party government from 1990 to 1993, and her efforts, combined with those of her predecessor, the Labour party’s Roger Douglas, transformed the economy from one at the bottom of the pile to something far more dynamic.

Shaun Goldfinch, a New Zealand-based academic, says that the country moved from being “one of the most hidebound economies outside the former communist bloc, to among the most liberal in the OECD”.

I wasn’t entirely sure that I recognize the pictures being drawn here.

In both cases, it is a picture of economies transformed –  the UK and New Zealand having ‘risen to become the strongest performer in each of their respective blocs’ (the EU and the CER respectively).

The UK entered the (then) EEC on 1 January 1973.  The initial six members of the EEC had been France, (West) Germany, Italy, Belgium, Netherlands, and Luxembourg.  I’m going to ignore Luxembourg in subsequent comparisons, and focus on the five reasonably large initial EEC economies.

For the UK the path to the EEC was pretty slow.  The first de Gaulle veto had occurred in 1963, and the second in 1967.    Over the 1960s, annual UK inflation  was around 1 percentage point above the median of the five EEC countries.  In 1972, just prior to joining the EEC, that gap was 1.4 percentage points.   Things got a lot worse in the following few years, but even then there was only one year –  1975 –  when the UK had the highest inflation rate of these six economies. Italy was typically worse.

And in the 1960s, real GDP per hour worked in the UK is estimated –  using the Conference Board data – to  have been almost exactly equal to that of the median country of the EEC-5.  Britain’s unemployment rate had been slightly below the median of the unemployment rates of those other European economies.

Of course, Britain had its challenges –  economic, and the psychological/political hurdles of the end of empire –  but it was hardly a basket case.

And nor has it, very obviously, gravitated to top of class since then

Here is real GDP per hour worked.

uk gdp phw

The decline in Britain’s GDP per hour worked, relative to those of the EEC-5, ended in around 1980.  And it has gone almost exactly sideways ever since.   Of these five European countries, Britain now only matches the real GDP per hour worked of Italy.  In the other four countries, labour productivity is around a quarter to a third higher than that in the UK.  Perhaps entering the EU staunched the decline, but there were probably a variety of other factors including financial liberalization (financial services being a huge chunk of British exports), the Thatcher reforms, and the end of the post-war catch-up phase.  But……Britain now has a lower level of labour productivity than all but one of these five European peers: it does no better than 80 per cent of the median of these other countries.  Not exactly a “top of class” performance.

One area where they have done better is unemployment.  The following chart shows the UK unemployment rate and the median rate for the same five European countries.  It combines official current OECD data (on harmonized definitions) since 1983, and several years of earlier OECD data from their Historical Statistics: 1960-1988 publication.

uk unemployment rates

Over the last 20 years or so, the UK has clearly done materially better than these five European countries.  Each of the other five is in the euro, but that shouldn’t explain any difference given that these five countries include four of the larger euro-area economies.  But even among those other five countries, the Netherlands has typically had a lower unemployment rate than the UK’s –  although that isn’t so right now.

And what about the New Zealand/Australia comparisons.  Negotiations on the CER agreement began in 1979, and the agreement was signed in early 1983.  Given that there are only two countries in Australasia, I won’t dispute the description of New Zealand by then as the “sick man of Australasia”.  Our economy had been very severely hit by the post-1973 fall in the terms of trade.   The large outflow of New Zealanders to Australia really gathered pace in the 1970s.  Neither country was running macro policy –  or micro policy –  that well, but New Zealand was generally accepted to be lagging somewhat behind Australia.  We compounded the problems with the Think Big energy projects programme in the early 1980s, which temporarily boosted demand, but simply threw away some of the nation’s wealth.

But the story wasn’t totally bleak.  Our unemployment rate, while rising, had been consistently below that of Australia. And over the years when CER was being negotiated, New Zealand’s real GDP per hour worked was about 79 per cent of that of Australia –  alert readers might notice that that is about the same ratio as that between UK GDP per hour worked today and that of the EEC-5 (see chart above).

I’m not about to dispute that lots of worthwhile reforms were done here during the subsequent years.  And I think it is likely –  although hardly certain –  that CER was helpful to both countries (although trade diversion effects were probably material in some sectors).  And there are whole sectors of the economy where I think policy  in New Zealand could reasonably be judged better, at least in terms of encouraging resource utilization, than that of Australia.  The labour market is one of them –  we don’t need elections called on the ostensible grounds of breaking the power of corrupt trade unions.  I know some readers disagree, but I think our approach to retirement income policy is superior to Australia’s.  And I often like to mention that taxi industry, where deregulation has given us a much better outcome than Australia has.

But has it made us the strongest performer in our little two country bloc?  Not really.

Take the real GDP per hour worked comparison, again from the Conference Board.

nz au real gdp phw

The late 1970s were a very bad period, as reflected in these data.  But on this measure things improved a bit of the 1980s –  partly no doubt the unsustainable boom that bust after 1987 –  before tailing off again.  Today, New Zealand’s GDP per hour worked is a little worse, relative to Australia’s, than it was when the CER negotiations got underway.  Perhaps the exam paper was upside down when that “best in class” grade was being awarded?  Of course, both countries are richer, and more open, than they were back then, but Australia has kept on doing a bit better than us.

And a significant part of the liberalization and reform process in both countries was the opening to external trade (not just bilaterally).  Here is the data for exports as a share of GDP.

exports nz and ausNew Zealand’s export share of GDP hasn’t changed in 35 years.

Of course, there are some area in which we do better –  and we have the distinct attractions (to New Zealanders at least) of no snakes or crocodiles.  As I noted earlier, the labour market tends to be one such area.  Here are the unemployment rates for the two countries back to the 1960s (prior to 1986 the New Zealand data are estimates, but good enough to be used by the OECD).  I have taken account of the revised data Statistics New Zealand published earlier this week.

u rates back to 60s

Our unemployment rate has been below that of Australia most years since 1967.  Only on two occasions was our unemployment rate higher – the first episode was in the wake of the post-1976 share and commercial property crash, and the second was in the couple of years after 2009 when Australian commodity prices –  and the associated business investment boom – were at their peak.  We should, of course, welcome the fact that our labour market typically generates less unemployment than Australia’s does, but it is worth mentioning that the gap in our favour is smaller than it was pre-liberalization.

No doubt our economy is rather more “dynamic” than it was –  although it is fair to wonder quite what that words mean specifically –  but it isn’t obviously much more successful., not even relative to Australia.  Compared with the late 70s, both countries now have low and stable inflation –  but their inflation rate is nearer target than ours.  Both countries have low levels of public debt, but in flow terms at present our government accounts are roughly balanced while theirs are still in deficit.    We have a slightly larger reliance on foreign capital (larger net IIP position as a share of GDP) than Australia does, but perhaps they have a slightly more compelling story about the new business investment (tradables sector) that capital has financed.  Both countries have seriously dysfunctional housing markets – it is hard to tell which of two bad performers is worse.  Oh, and New Zealanders are still (net) moving to Australia, not coming home again.

It is election day in Australia.  I was amused when Malcolm Turnbull became Prime Minister and talked about wanting to emulate New Zealand’s approach to economic reform.  In the intervening period, there hasn’t been much sign of reform in Australia –  any more than there had been in New Zealand –  but for all Australia’s challenges, it has still managed more productivity growth in recent years than New Zealand has.

real gdp phw nz and aus

As I noted earlier, the United Kingdom has hardly been a top-of-class performer in Europe in recent decades.  The sobering thing is that over the last few decades, Australia –  with all its newly developed mineral wealth –  has managed to do no better on the productivity front than just about keep pace with the UK.  New Zealand, of course, couldn’t even manage that.

real gdp phw nz aus uk

If Britain is searching for lessons and models in a post-referendum world, New Zealand might offer a model of good intentions.  As for outcomes, not so much.


.

Skills matter….and we already seem to have them

Earlier this week the OECD released Skills Matter, a 160 page report on the results of a programme of surveys of adult skills in OECD (and a handful of other) countries.  As usual with OECD reports, it is full of fascinating charts.  Here is how they describe the programme:

In the wake of the technological revolution that began in the last decades of the 20th century, labour market demand for information-processing and other high-level cognitive and interpersonal skills is growing substantially. The Survey of Adult Skills, a product of the OECD Programme for the International Assessment of Adult Competencies (PIAAC), was designed to provide insights into the availability of some of these key skills in society and how they are used at work and at home. The first survey of its kind, it directly measures proficiency in several information-processing skills – namely literacy, numeracy and problem solving in technology-rich environments.

It is worth emphasizing that the survey involves attempting to directly assess skill levels, not formal qualifications.

The first such survey was done a few years ago, but this is the first round to include all OECD countries and, in particular, the first to include New Zealand.   They even provide a 20 page country note on New Zealand.

The bottom line for New Zealand?  The news is good.

Here is how our adults scored on literacy.

oecd literacy 2

And numeracy

oecd numeracy

And on “Problem-solving in technology-rich environments”

oecd problem solving

Looking across the three measures, by my reckoning only Finland, Japan, and perhaps Sweden do better than New Zealand.    Perhaps there is something very wrong with the way the survey is done, and it is badly mis-measuring things, but those aren’t usually the OECD’s vices.  For the time being, I think we can take it as reasonably solid data.  And the broad sweep of the cross-country results makes some sort of rough sense: typically the poorer countries are to the left of the charts (relatively less highly-skilled).

But if the skill levels of our adults are so high, on average, by international standards (and, as it happens,  we have quite a high rate of tertiary qualifications as well), it should perhaps raise questions again about the size and nature of our immigration programme.

After all, as I noted, the poorer and lower productivity countries are generally to the left of these charts. But New Zealand is one of the less well-performing OECD countries on that score.  Here is real GDP per hour worked for OECD countries in 2014.

real gdp per hour worked 2014

And when the OECD lines up the skills scores against the productivity data one of the largest gaps (lagging productivity) is for New Zealand   The cross-country scatter plots don’t show a tight relationship by any means, but they do tend to suggest that the skills and talents of our people aren’t what holds New Zealand back.

And yet we aim to grant 45000 to 50000 new residence approvals each year (a scale three times the size of US and UK programmes, per capita), supposedly with a focus on skilled migrants.  What is the logic?  And where is the evidence that this is the right place to focus in tackling New Zealand’s long-term economic underperformance?  Reinforcing those doubts, we know that other data show the incremental returns to tertiary education –  a different thing from skills, but one hopes not wholly unrelated –  are also among the lowest in the OECD.

A reasonable person might instead look at the data and suspect that, for whatever reason, the economic opportunities in New Zealand just aren’t that good.  Perhaps that is about location and distance, and a seeming inability to break out of a dependence on (a fixed supply of) natural resources or to increase productivity in those natural resource sectors rapidly enough.  But whatever the underlying reason, the opportunities haven’t been found here –  our export share of GDP has been static for decades, per capita tradables sector production hasn’t changed for 15 years, and a huge number of New Zealanders have kept on leaving for better opportunities abroad (mostly in –  on these measures –  slightly less skilled Australia).

One might have severe doubts about the logic of using policy to actively pursue bringing in lots more people  –  it might be no more sensible here than it would be in Wales, or Scotland, or Nebraska, or Newfoundland, or Tasmania (who’ve been spared the depradations of Think Big bureaucrats and politicians with immigration as a lever).  Perhaps it would be a little less worrying if the new arrivals were typically very highly-skilled people –  but recall that the highly-skilled people we already have aren’t succeeding in generating high returns (high productivity) here now.

But in fact, our immigrants aren’t that highly-skilled at all.  At the frivolous end of the spectrum, we were giving a small number of Essential Skills work visas to shelf stackers and kitchen hands.  More seriously, among those gaining residence visas in the skilled migrant category, the top four occupations in the last year for which we have official data were

Occupation 2014/15
Number %
Chef 699 7.2%
Registered Nurse (Aged Care) 607 6.2%
Retail Manager (General) 462 4.7%
Cafe or Restaurant Manager 389 4.0%

But it isn’t just a matter of occupational lists.

As it happens, the OECD report looks directly at the skills level of immigrant populations.  There are a few countries where immigrant population skill level match those of native born populations.  Perhaps that isn’t too surprising where most migrants come from countries with very similar cultural or linguistic backgrounds.  Among subsets of migrants, one could think of the flow among NZ/Australia/Ireland/UK, or between Chile and Argentina, or between the Czech Republic and Slovakia.  At the other extreme, some countries now face the challenges of very large skills gaps between migrants and native-born (most of the Nordic countries are now in this situation).  New Zealand doesn’t do too badly on this count – after all, we have control on who comes in, we have a notional skills focus, and the UK remains the largest single source of residence approvals. But there is a clear skills gap between immigrants and native-born New Zealanders.  Importing people doesn’t look as though it has been a means of raising skill levels here, or in most other countries.  In general that shouldn’t be surprising –  successful countries solve their own problems, and when they succeed they might share their bounty with newcomers. But a different sort of people is very rarely the answer to serious economic challenges.

On paper, there is some evidence suggesting that migrants to New Zealand have higher formal qualifications than the average New Zealander.  Nonetheless, as Julie Fry reported in her Treasury working paper a couple of years ago

Evidence suggests that immigrants are, on average, more qualified than the
New Zealand-born.  However, they also face language and adjustment barriers, at times including discrimination, which on average take 10-20 years to overcome.  In common with overseas patterns, recent New Zealand immigrants have poorer outcomes than others in the labour market, although those outcomes improve over time.   Immigrants who are from culturally similar source countries (such as Australia and the United Kingdom) adjust more quickly.   On average, migrants from Asia take longer to adjust, and migrants from the Pacific Islands never reach parity with the New Zealand-born, reflecting the fact that they enter mainly on family reunification grounds and non-skills-based quotas.
Our immigration policy seems seriously misguided.  It has been sold as a “critical economic enabler“, but if anything looks more as though it might be serving as a disabling factor.  There is no evidence that we are short of people, or of skills.  Skill levels  –  individually and collectively –  could no doubt always be higher than they are.  But immigration policy hasn’t been, and isn’t, raising skill levels in New Zealand –  nor is it doing so anywhere else in the OECD.
(And to anyone who wants to run an individual sector skills shortages argument, I commend to them the post I wrote on that topic a couple of weeks ago.)


How I think about our long-term underperformance problem

Tempting as it is to write about the failures and weaknesses of the New Zealand public sector –  and there is plenty more grist to the mill, reinforcing Kerry McDonad’s forcefully expressed concerns, even in this morning’s newspaper –  or the inadequate performance of the Reserve Bank in conducting monetary policy, as the TWI now sits above 76, I’m going to write today about some longer-term issues.

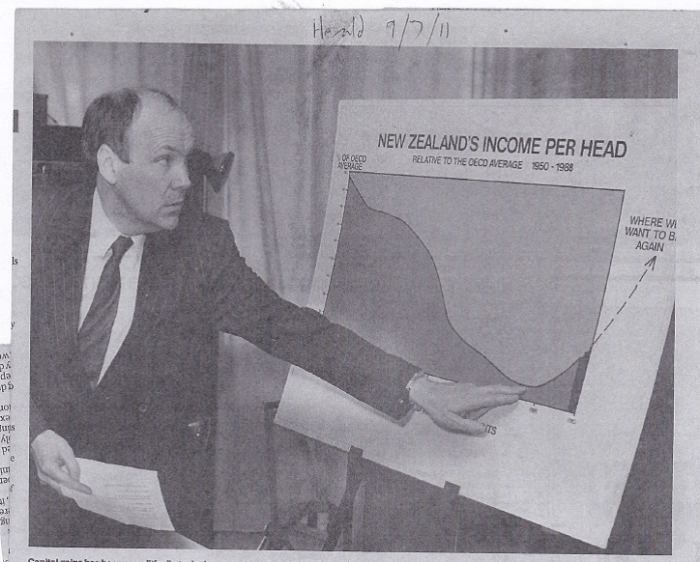
Of all the issues I write about on this blog, probably the one that concerns me most is New Zealand’s long-term structural economic decline, relative to other advanced countries.  That decline has been underway for many decades, and if the rate of decline has slowed there is certainly no sign of the gaps beginning to close. Once upon a time that decline seemed to bother people, but sadly we seem to have got used to it.  And perhaps too people are more cynical –  they’ve heard various stories over the years as to what might reverse the decline, and even when tried none seem to have worked (enough).

This photo, after all, was taken in 1989 – a generation ago now.

caygill 1989 expectations

I don’t think the current state of the affairs is good enough.  There is no political leadership that treats the issue as a priority, debate is virtually non-existent on any sustained basis, and the economic conditions that have seen almost a million New Zealanders (net) leave permanently in recent decades haven’t changed.  I don’t want my kids to grow up to discover that most of the best opportunities for them and their kids are abroad.

Readers here recognize the serious relative decline we’ve experienced over many decades.  But I often get comments, whether sympathetic or critical, asking what I would do to change things –  often with the text, or sub-text, “and why are you always banging on about immigration policy at the expense of everything else?”.

There are plenty of things about our economic policy (broadly defined) that I would change.  Many of them are in areas where I have not spent a lot of time or effort looking at the issues and options in great detail, and so in a spare-time blog I don’t write about them.  And quite a few seem to me like things that would be worth changing, but might not make that much difference at all to measures like GDP per capita, or per hour worked.  I prefer to focus my efforts in areas which might make a material difference –  individually, or even as a package –  and, perhaps, to critiquing proposals that others suggest might make a big difference, but where I disagree.  I happen to favour fully-funded school choice, while I suspect most readers don’t.  In terms of economic performance, no one would argue it matters that much, so why alienate people who might be sympathetic to my core arguments and analysis?    Then again, some of my friends on the (economic, pro-market) right are deeply uneasy about my immigration analysis, so from time to time I do like to remind them that my underlying model is a strongly market-oriented one.  In the end, there are only so many hours in a day, and only so much of my time I want to devote to these issues.

When the National Party led government assumed office in 2008, they set up the 2025 Taskforce.   As it is described on the Treasury website

As part of the Confidence and Supply Agreement between the National and ACT parties reached immediately after the 2008 election, the Government committed to closing the income gap with Australia by 2025 and to establishing an advisory group both to report annually on progress towards achieving that goal and to make recommendations about how best to achieve it.

I don’t suppose the National Party would have been averse to the gap closing.  But the Taskforce was pretty much forced on them by ACT – minor parties entering Confidence and Supply Agreements get to pick a few policies that the dominant governing party agrees to implement, and this was ACT’s that year.

It was an under-resourced exercise from the start.  The one Australian member appointed to the Taskforce by our government was staggered at how little time and resource they were given. Treasury provided the Secretariat to the Taskforce, and I got closely involved in that process –  I was at Treasury at the time, and having worked closely with Don Brash previously, he –  as chair of the Taskforce – was keen to have me involved.  The first report of the Taskforce, issued in late 2009, is the one fairly comprehensive attempt in term of the current government to provide a list of recommendations that, if adopted, offered a reasonable chance of being able to catch up with Australia.  Based on historical experiences with convergence, catching up over 16 years looked to the Taskforce to be demanding, but not impossible.  If most of the words in the Report flowed directly from my pen, the recommendations are those of the Taskforce members.  But at the time, I agreed with most of them –  even if, even then, not all seemed overly important.

Yesterday I went back and read through the 50 or so specific recommendations in the report (they are on pages 8 to 11 are the link above).    I could go through them one by one, but that would bore most readers, and bore me, and in many cases wouldn’t add much value.  But, like the Taskforce, I support:

  • lowering the share of GDP accounted for by government spending,
  • stronger institutional disciplines around new spending proposals,
  • steps to cut the high number of working age people on welfare benefits,
  • increasing the age of NZS eligibility and indexing the age to future changes in life expectancy,
  • introduction of a funder-provider model for the hospital sector and the school sector, allowing new provider entrants whether government or private owned.
  • removal of the substantially increased childcare subsidies introduced a decade or so ago,
  • government-imposed fee caps on university fees should be abolished,
  • reductions in tax rates should have regard to “the evidence that taxes on capital income can be particularly detrimental to economic performance”,
  • all government shares in businesses where competition is actual or feasible should be sold,
  • the NZSF should be wound-up and proceeds used to repay government debt,
  • congestion charging should be introduced in central Auckland (in particular) and full economic road-user charging should be introduced as feasible,
  • mining developments “on or under sensitive Crown land should generally be permitted provided that they pass a full cost-benefit test”,
  • a Regulatory Responsibility Bill should be enacted,
  • an independent Productivity Commission should be established,
  • resource management law should be reviewed from first principles,
  • in zoning land for residential purposes, local authorities should have to report regularly on, and take explicit account of, differences in land prices between residential-zoned undeveloped land and other undeveloped land in similar areas,
  • provisions allowing for probationary periods in employment should be extended
  • increases in youth and adult minimum wages – relative to median incomes –  over the previous decade should be reversed,
  • all remaining tariffs should be removed unilaterally,
  • foreign investment restrictions should be liberalized,
  • Zespri’s kiwifruit export monopoly should be removed.

A few of these have actually happened, or might soon happen.

I’d support all of those proposals.  But as I came away from my involvement with the Taskforce, I gradually came to the view that they just didn’t seem like enough to make large in-roads on the productivity and income gaps that had opened up over previous decades.  People operating within different “models” of the economy might disagree, but as I tried to think hard about the distinctive features of New Zealand’s underperformance I couldn’t convince myself that this was a game-changing agenda.  After all, radical as it was in some respects, it was less far-reaching in the important respects than the reform agenda implemented over 1984 to 1993, which hadn’t reversed our decline.  Arguments that “oh, we just hadn’t gone quite far enough” don’t typically ring very persuasively –  whoever is running them is simply inviting policymakers to double up on a bet which, so far, has shown no signs of paying off.

There is probably a variety of “models” people have in mind for thinking about New Zealand’s economic underperformance.  I’ll stylize (caricature) two of them as “small government” and “smart government”.  One of the finest representatives of the small government school in New Zealand was the late Roger Kerr, who had thought hard about economic performance and New Zealand for a long time, and was always will to engage on the issues.  I think he probably thought –  and his public and private comments at the time suggest –  that the 2025 Taskforce report didn’t go quite far enough, and didn’t grapple with all the issues it could have, but that if only we got government spending down to perhaps 15 to 20 per cent of GDP, facilitated foreign investment, reformed the provision of health and education, privatized government and local authority operating businesses, liberalised the labour market, and sorted out the RMA and the creeping advance of other regulation, we’d be well on the way to catching Australia and other richer OECD countries.

I’m not sure there is single person representative of what I would call the “smart government” school, but it is the sort of thinking that these days seem to pervade places like the OECD, and key domestic government agencies – be it Treasury, MBIE, or even the Productivity Commission.  It is the hunt for a smarter set of interventions –  ones around R&D are popular, but it might include top-down visions as to what cities should look like, granting eminent domain powers to Urban Development Authorities, getting a better class of immigrants going to different regions, getting better data on how best to intervene in individuals’ lives etc.  If this seems like a caricature that is partly because (a) there is no properly developed case made for a set of reforms  along these lines that might transform New Zealand’s prospects, and (b) because in this post I haven’t the space to develop the alternative fully myself. But the gist seems to be that our problem isn’t government interventions, but just that we had the wrong bureaucrats and ministers making the wrong interventions, and if only we adopted this alternative set we’d be fine.     And, of course, there is no doubt plenty of regulation/law required in a modern market economy, and we should always be trying to improve it.

My stance is much closer to the Kerr end of the spectrum.  In particular, I think it is a safe observation that governments, and government interventions, are more often the source of a country’s economic problems than the answer to them.  Of course, governments don’t exist in a vacuum, and so government policies are often a reflection of the societies they govern, and the problems and dysfunctions in those societies.  But the problems often manifest in misplaced economic interventions.  On the other hand, “culture” matters too: keeping taxes low, regulation light, markets open, and property rights secure wouldn’t transform Zambia, say, into an OECD success story, at least not in a single lifetime.

But in thinking about New Zealand, we have some advantages. These include:

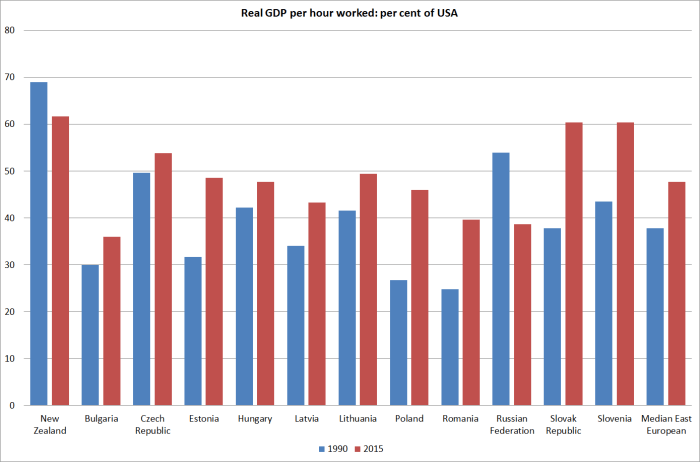
  • we were already rich (high GDP per capita or per hour worked) for a long time,
  • we shared a culture (broadly speaking) with most of the richest and most successful countries in the world (Anglo and Northern European)
  • as part of that, we share key institutions such as the rule of law and reasonable protections of private property rights.

That should help us narrow down our search for answers.  We can try to think, in a reasonably structured way, about similarities and differences between New Zealand and these other (typically much richer, higher levels of productivity) countries.

On the similarities side, it is worth bearing mind that the overall size of government isn’t that different than in these other countries (be it spending share, ownership of assets, or regulation), and actually on one of those dimensions –  government spending as a share of GDP – there is quite a wide range of experiences among successful countries, and we are towards the middle of the pack.  But if government spending as share of GDP was perhaps 55 per cent, there might be a good case for seeing pulling back the size of government spending (and hence overall tax rates) as key element in any package of reforms (a putative list of Top 5 Reforms).

House price problems are pretty similar too.  Scandalous here and in most of those countries too, but not a prima facie reason to think distorted housing supply markets might be at the heart of our productivity and economic performance failures.

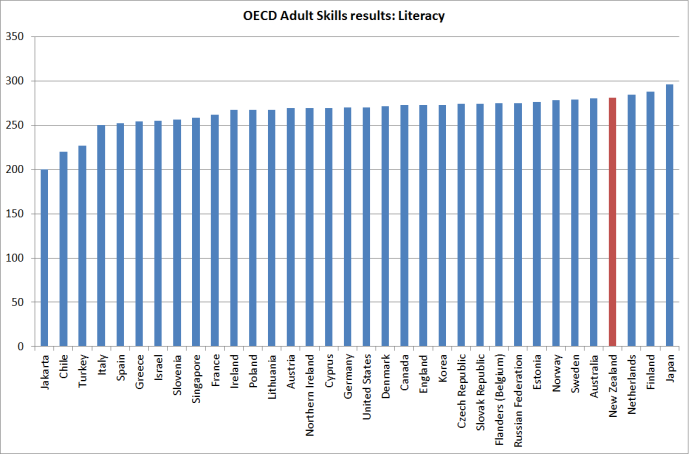
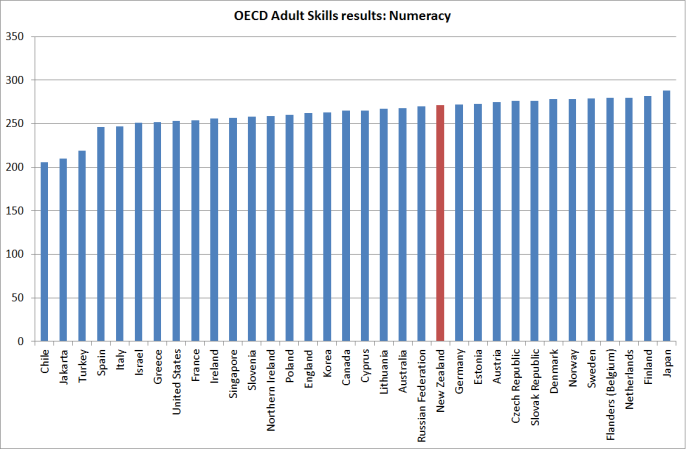
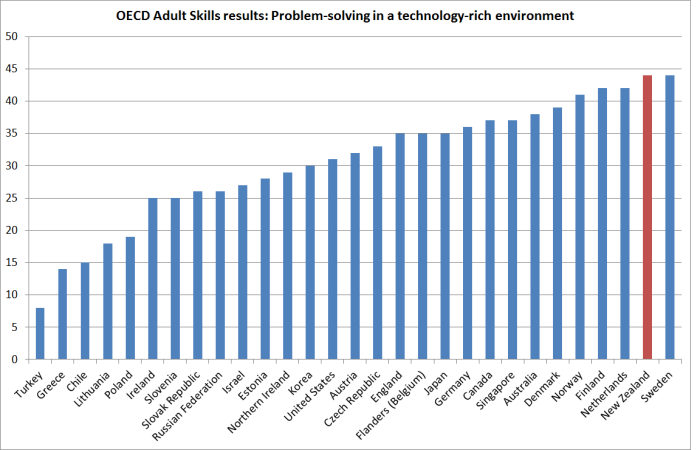
For all the opportunities there might be to improve our schools and universities, “skills” doesn’t really look like a credible huge difference.  We used to have quite a low rate of participation in tertiary education, but even that has change in recent decades.  I’d also tend to emphasise the similarities, more than the differences, between our welfare system and those in the successful advanced economies – in some areas, ours might be less of a “tax” on growth and economic performance (eg NZS deters labour market participation less, and in some more so, but overall the differences don’t look decisive.

What are some potentially significant differences:

  • we are small (but not extremely so, cf Ireland, Denmark, Finland, Iceland),
  • we are remote (though on typical measures) similar to Australia),
  • we’ve had persistently low rates of business investment (including in R&D) going back decades, even more obviously once one allows for population growth differentials (countries with faster-growing populations,
  • we remain heavily natural resource dependent (like Australia and, to a lesser extent, Canada),
  • we have had, for decades, the highest real interest rates in the OECD,
  • despite our substantial and sustained deterioration in economic performance, our real exchange rate has not adjusted downwards,
  • we have had very little growth in exports as a share of GDP, such that our export share is now very low for such a small country (small countries typically do more foreign trade than large ones)
  • we’ve had a lower national savings rate than many of these countries,
  • we have typically had the largest negative NIIP position (per cent of GDP) of any of these countries,
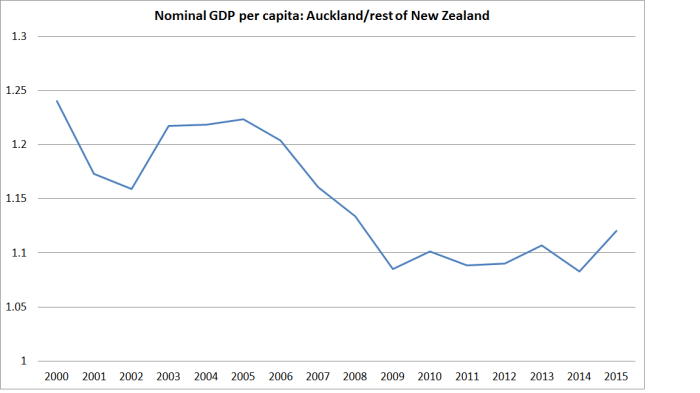
  • our single moderately large city has been an economic laggard (GDP per capita) in recent decades, unlike the typical advanced country experience,
  • we’ve had a very large, decades-long, net outflow of our own citizens (unlike most successful countries, although similar to what Ireland had for decades)
  • we have an unusually large target level of non-citizen immigration
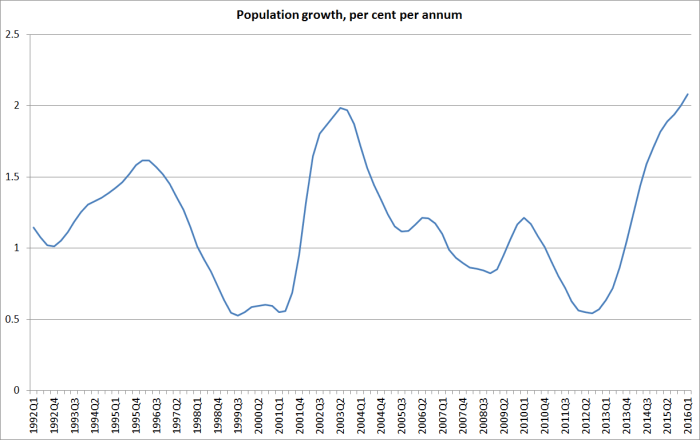
  • over the decades since our economic deterioration became evident, we have had  faster population growth than many, but not all, these countries.

I suspect that most of those who think about the challenges of New Zealand’s economic underperformance would grant most of those stylized facts.  I’ve tried to write them in a way that doesn’t overstate any of them individually.  Perhaps some will think I’ve left out some key stylized facts, and if so I’d happily consider them.  Stories and explanations, and policy prescriptions, need to be fitted to the stylized facts.  But equally, everyone starts with a “model”, and some implicit assumptions about what facts matter. But we can all have blind spots.

My story has developed to try to take account of the sorts of similarities and differences I’ve listed above.  I start by looking around the policy interventions that might be messing things up (recall that my underlying model is that firms invest and generate prosperity in countries with sound basic institutions unless government interventions materially distort those prospects).

Plenty of people worry about New Zealand’s savings rate, but when one looks across time and across countries it isn’t obvious that our government policy settings around savings (ie differences from those abroad) can explain different savings outcomes.  That was the somewhat-reluctant conclusion of a Treasury exercise I had some involvement with a few years ago.  Perhaps an alternative explanation might see relatively modest savings rates as an endogenous response to whatever makes the business investment environment here sufficiently unattractive to generate those low rates of investment. After all, business depreciation and retained earnings (to take advantage of great business opportunities) are a large, and often neglected, component of national savings.   And it isn’t as if government is running large deficits either.

And low business investment must also be related –  common causal factors – to the very low rate of growth of exports (most of the potential market for many firms is the wider world), which in turn must be related to the persistently high exchange rate.  Some people try to argue that our interest rates have been high because we have so much debt, and markets “punish” us for it, but actually our debt (NIIP) has been large for 25 years  –  plenty of time for people to adjust their behavior and see any “risk premium” dissipate.  Perhaps as importantly, high risk premia are simply inconsistent with persistently high exchange rates –  when markets are really jittery, asset prices are typically weak, not persistently surprisingly strong.

Low business investment (as a share of GDP) might also be related to a relative lack of profitable opportunities here –  even if the exchange rate was lower.  There is a lot of resistance to this idea, but the resistance typically does not take seriously economic geography.  People repeatedly focus on the places where there are lots of people (in the advanced world) and hardly at all on the places where there are not lots of people –  presumably because profitable opportunities are just not there (in Nebraska, as opposed say to San Francisco).  People leave –  or don’t go to –  those places when they have better alternatives.  New Zealanders, for example, move to Australia.

So I’m driven towards a story that emphasizes the combination of the limited high-returning economic opportunities that our location/distance seems to have offered, the role of excess aggregate demand (which has given us persistently high interest rates, despite the apparently poor opportunities, and a high real exchange rate), and at the same time a population that is still growing rapidly (trend basis, not just the last year) largely now as a result of immigration policy.  And –  to revert to the point about looking for government interventions that, however well-intentioned, are messing things up  –  we have an unusually large non-citizen immigration programme, especially for such an unusually underperforming country.  Among the government’s economic policy interventions, it is large and distinctive.

For quite a few years, I believed the rhetoric that it was all “good quality” migration, but as I looked into it I found – as others have, including The Treasury –  that actually, it really isn’t such good quality migration after all (better than some countries’ experiences, but just not really that skills-focused).  Perhaps really able, highly-skilled, people don’t want to come in large numbers to a small, remote, underperforming country, that doesn’t seem to be able to support lots of highly profitable outward-oriented industries dependent on things other than the (essentially) fixed quantity of natural resources?

I could write lots more, but this post has already got rather long.  My point was not, in a single post, to make a comprehensive case for every strand of my argument.  Thinking about it this morning, I realized that I laid some of the foundations – especially around the interest rate/exchange rate/investment nexus –  in a series of posts a year ago.  But readership has increased very substantially since then (and my impression was that most readers back then knew me, and had some past exposure to my arguments, which is no longer the case).  I may dig out some of that material and re-run some updated posts in coming weeks.

And having got to the end I still don’t want to leave the impression that other  potential reforms don’t have a place.  A standard line  –  the 2025 Taskforce used it –  is that distance/location aren’t things we can do much about, so we just need to make sure we run really good policies to offset the disadvantages.  I have quite a lot of sympathy with that view –  and good policy is always better than poor policy –  but as a general proposition it can be a distraction from identifying any key areas in which ill-judged policy interventions (even ones that might make sense for other countries in other circumstances) might actually be working us against making the most, in per capita GDP terms for New Zealanders, of what we have and where we are. I think our highly unusual –  in context –  immigration policy is a prime example of that.
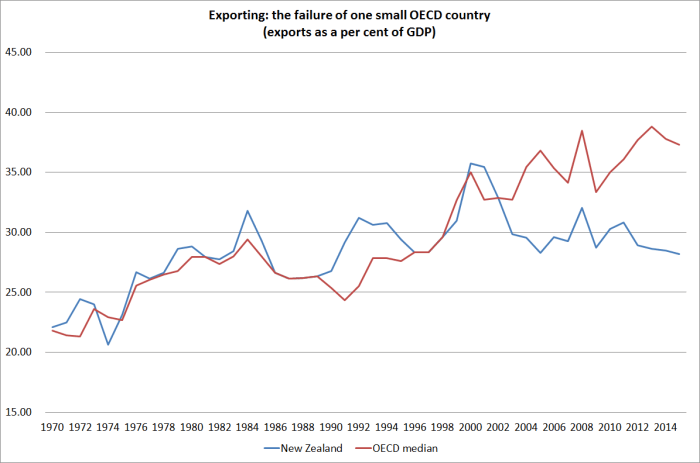
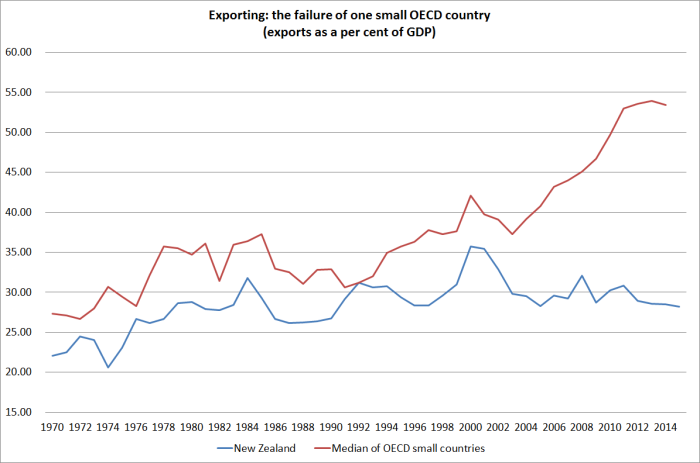
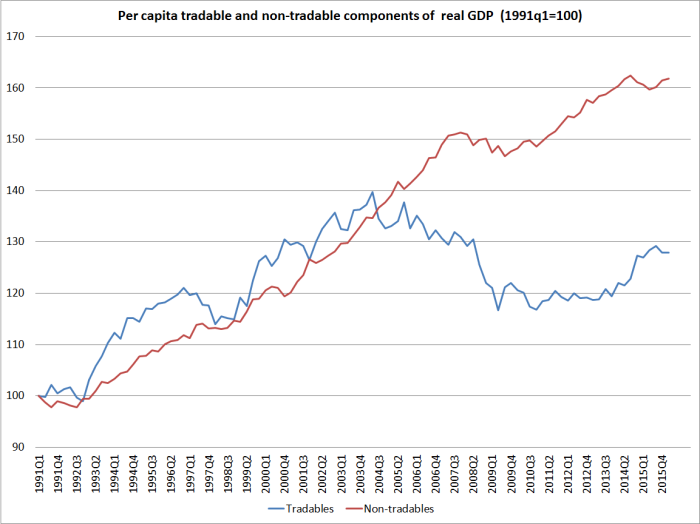
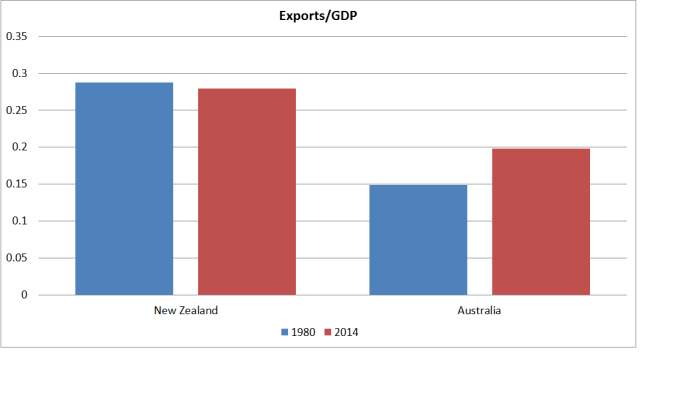


Underperformance: still fossicking in the the GDP numbers

As everyone knows, our current population growth rate is extraordinarily high at present.  We only have an official census every five years or so, but SNZ produces quarterly population estimates using births and deaths data and information on migration flows.  Here is the estimated annual growth rate of New Zealand’s population for the full period since the official estimates begin in 1991.

nz popn

By international standards, New Zealand’s population growth rate is highly variable.  Most of the short-term variability in the series is not about discretionary New Zealand policy choices.  The (large) target for the number of residence approvals has been the same for 15 years or more, and most of the shorter-term variability is a reflection of fluctuations in the net number of New Zealanders leaving –  in turn, much influenced by perceived prospects in Australia.  Incomes are higher there, but that isn’t much use if one can’t get and keep a job, given that most New Zealand migrants to Australia are not eligible for most elements of the Australian welfare safety net.  But New Zealand policy choices do make some difference –  for example, allowing foreign students to work while they are here, appears to have materially increased the number of those living here.

As I illustrated yesterday, productivity growth in New Zealand in recent years has been almost non-existent.  To restate the obvious, it isn’t some fundamental reassessment of New Zealand’s fortunes and productivity prospects that seems to be boosting our population.

But some of the other trends in the data are interesting too.  For example, here is a chart of per capita growth in real consumption.  I’ve shown two lines –  one for private consumption, and one for total consumption (ie including government consumption).

consumption

Private consumption growth per capita – the red line –  was averaging around 4 per cent annum over 2002 to 2005, the last huge population surge.  Those growth rates hadn’t been much lower in the mid 1990s.  In the last year, private consumption per capita has grown by only 0.6 per cent.   And remember that when the population is growing fast, one might reasonably expected recorded consumption to be growing even faster –  after all, those new people all need tables and chairs, washing machines, fridges and other consumer durables (that might actually be used over many years, but are measured as consumption at the point of purchase).

And for all the talk of “wealth effects” from rising house prices –  even though higher house prices only redistribute wealth, they don’t make New Zealanders as a whole better off –  there isn’t much sign of it here.  I’ve run previously the chart of (nominal) consumption as a share of GDP, which has been largely stable for 30 years, despite the repeated surges upwards in the level of house prices.

What about investment?  Over a long period of time, New Zealand has tended to devote a surprisingly small share of its GDP to investment, even though our population growth rate has been well above average, and larger populations need a larger stock of capital.   Among the IMF “advanced economies”, the median country devoted 23.6 per cent of GDP to investment over the period 1980 to 2015.  By contrast, New Zealand devoted 22.7 per cent of GDP to investment –  even though our population increased by around 50 per cent over that period, and the median advanced country’s population increased by around 30 per cent.     When the population surges, a country typically needs to see quite a lot more investment taking place if growth in per capita living standards is to keep pace with that in countries with slower growing populations.

investment weo

Right at the moment, total investment as a share of GDP in New Zealand is a bit larger than in the typical advanced economy.  But in the last year, our population has increased by 2 per cent, and the median advanced economy has had population growth of around 0.5 per cent.  And our investment numbers are boosted by the Christchurch rebuild and repair process, replacing capacity destroyed by a natural disaster.     To maintain the ratios of capital to output typical of a modern successful economy (around 3:1), in the face of such large population growth differentials, one might have hoped to see investment as a share of GDP here perhaps  4 percentage points higher than in other advanced economies.  The actual margin is less than 2 percentage points, and even that margin includes the substantial rebuild spending.

What about our own national accounts data?

non-housing I

Here is non-housing investment spending as a share of GDP.  Even though population growth is now exceeding even that in the early 2000s, the non-housing investment share of GDP has recovered very little since the recession.  When we finally  get the annual capital stock data, we are likely to see very growth in the non-housing per capita capital stock at all.  When even entirely orthodox bodies such as the Productivity Commission produce modelling results in which immigration comes at a modest cost to the recipient country, while the sending country gains a little –  and that was the modelling (of the trans-Tasman flow) that the Australian and New Zealand Productivity Commissions jointly reported a couple of years ago –  the mechanism in the model is typically through a sluggish adjustment of the capital stock.    Ours just has not kept up with the rapid growth in our population.  Some of that is probably about government infrastructure, but mostly it will be because firms have not found sufficiently attractive investment opportunities.

And much of that must be about the unattractiveness/uneconomic nature of expanding exports rapidly from New Zealand. Here is the chart of exports to GDP.

exports to gdp 2016

I wouldn’t focus too much on the 2000 spike –  it was the outcome of a rare combination of events in which our commodity prices were quite high, and our exchange rate was very low –  the latter as much about events in the US as here.  But with very few exceptions, countries –  and especially small countries –  don’t prosper  –  and catch up with the best in the world – if their firms can’t find ways to profitably sell more, better, and more valuable stuff in competition with international producers.  Despite our booming (subsidized) export education sector, and our booming tourism sector, exports as a share of GDP last quarter were largely unchanged from a level first reached 25 years earlier.  Yes, there is some variability in the series, but the peaks haven’t been getting any higher for a long time now.  And this is the series that government policy is supposedly set to get to around 40 per cent…….

The outcomes shouldn’t really be very surprising.  The highest real interest rates in the OECD, a real exchange rate that has never sustainably adjusted to reflect our economic decline, and the perils of a location that make it difficult anyway to build internationally competitive firms relying on anything other than location-specific natural resources.  And yet our policymakers for some reason think that even more people is part of solving the problem.  If anything, it looks to have been make things worse –  making it harder to overcome our natural disadvantages.  Our per capita capital stock adjusts at best sluggishly, and the  per capita stock of natural capital just keeps falling (ie no more natural resources are being made).

Just to illustrate quite how unusual what is going on with our population is, in international terms, here is a chart I ran a few weeks ago showing annual population growth rates back to the 1950s, for New Zealand, the world (ie mostly the emerging/developing/poorer bits), and what the UN terms the “more developed regions”.

un popn chart

Population growth rates have been tailing off for decades, in advanced countries and in the world as whole.  But this year, New Zealand’s population growth rate (see very first chart) will be similar to those we saw in the 1950s.    Our productivity performance was already tailing off then, but at least we still had among the highest material living standards anywhere.  Quite why our politicians and their advisers think that such rapid population growth –  policy-induced population growth –  relative to the rest of the advanced world makes sense now, when our people are already so much poorer than most of those in the rest of the advanced world –  is one of the questions we really deserve a serious and considered answer to.


A question for The Treasury

One thing I like about the Reserve Bank is that it has largely stayed clear of Twitter.  They use it –  you can find them here – but there was a deliberate decision made a few years ago to use it only to highlight new Reserve Bank releases; links to articles, research papers, press releases etc.  I’ve always been sceptical of a medium for expressing ideas in 140 characters or fewer.

The Treasury is a bit more adventurous in their use of Twitter (here), offering editorial perspectives at times, and enthusiastically retweeting things from other people and organisations  (here and abroad) who either endorse something Treasury has done or said, or that Treasury agrees with or endorses.

This Treasury retweet of something from a British academic caught my eye the other day.


Jun 1

Distance matters (still): Trade volume with UK vs distance of trading partner from the UK.  

It is quite a nice chart from The Economist that illustrates a now fairly well-known point.  Firms and people do much more trade, all else equal, with firms and people in countries close to them that with those in countries far away. I don’t think this particular version of the chart is wholly compelling: it uses the total value of trade between countries, but population numbers matter as well, and it might have been better to illustrate the point using per capita trade values instead.  Doing so in this chart would move both Ireland and New Zealand a long way up relative to the other –  mostly much larger –  countries that are highlighted.  But the key point holds: distance matters, a lot.  Not just in terms of who one trades with, but in terms of how much total foreign trade is done at all.  For small countries even more than for large countries, the ability to successfully sell more and better stuff to the rest of the world is a vital part of improving a country’s long-term economic fortunes.

In retweeting it, presumably official Treasury was keen to remind us that distance matters to New Zealand too.    There is no way Australia, for example, would be the largest trading partner for New Zealand firms if, for example, these islands were set in the Bay of Biscay.

Treasury has made a useful contribution over the years in reminding us of this point.  They developed the useful line 15 of so years ago that drawing a circle with a 1000 km radius around Wellington would encompass 4.5 million people and lots and lots of seagulls. while a comparable circle around Vienna or Seoul would encompass hundreds of millions of people.  Sadly, seagulls aren’t a terribly promising market.

Treasury also included this chart in their Holding On and Letting Go document, which formed part of their 2014 Post-election Briefing to the Minister of Finance

Figure 8: New Zealand’s geographic challenge
Selected countries distance from world markets and populationFigure 8: New Zealand's geographic challenge   . Note: The x axis is scaled so that each marker is ten times the magnitude of the previous one.
Source:  World Bank: World Development Indicators, ITC: Trade Map, CEPII

Among OECD and major emerging economies, New Zealand is more distant from markets than any other country.  Chile and Australia are almost as distant.  Chile is a much poorer country, and Australia –  while wealthier –  is very fortunate in the scale of its usable natural resources, but when one looks at the productivity data it is no longer in the top tier of countries.

Treasury also produced an interesting piece of formal empirical research a couple of years ago  using cross-country data to look at the various barriers to foreign trade that New Zealand faces.  In the modelling they report, distance shows up as a highly statistically significant factor influencing (negatively) the volume of foreign trade a country does.

Distance  –  and trade – isn’t mostly about land, it is about people.  Our islands are really remote, but much of what counts is the people living here, who have to find ways of making and selling stuff abroad, especially if we are to have any chance of offering top tier incomes and material living standards to those people.

And so it puzzles me that Treasury never seems to consider population size –  and especially the role of immigration policy in changing population size over time – when they discuss the implications of distance.  4.5 million or so of us face the (quite substantial) penalty of distance.  What leads Treasury to think that exposing ever more people to that “tax” –  not as a result of New Zealanders’ private fertility choices, but as a direct result of government policy –  makes sense.  As I’ve pointed before, in none of Treasury’s writing on immigration policy in recent years has there been any sense of evidence that a large scale (notionally skills -focused) immigration policy has been doing anything useful to lift the overall productivity performance of New Zealand, and the income prospects of New Zealanders.  If anything, we’ve continued to lose ground relative to other advanced countries.

For some time it has surprised me that Holding On and Letting Go had scarcely any mention of immigration policy, and most of the (few) references to immigration were simply to the cyclical pressures, rather than the medium-term issues, even though (for better or worse) it is one of the larger government policy interventions in the New Zealand economy.

Treasury argues that “geography isn’t destiny”, and there is clearly an element of truth in that.  But I don’t think they have yet taken seriously enough the nature of the geographic constraint.  Yes, New Zealand did have top tier incomes for decades, but it did so by exporting natural resource based products deploying/supporting a very small population.  There are no more natural resources here than there were 100 years ago,  the overwhelming bulk of our exports are still natural resource based (not just the obvious farm products, but fish, wine, gold, oil, the electricity that produces aluminium, and tourism) and yet we now have four times as many people as we had in 1916.  Some countries make the transition from natural resources.  When Captain Cook got to New Zealand, Britain’s exports were about 95 per cent based on Britain’s own natural resources.  These days, very little of her exports are.  We have shown very little sign of being able to make that transition.

That isn’t because we don’t have smart, able, innovative people, or good institutions, it seems to be largely because places this remote don’t successfully support many non-natural resource based businesses.  There aren’t any other examples of places that successfully do –  the other even more remote islands are too insignificant to even get on Treasury’s chart.   Internationally-oriented non natural resource based businesses might start here, but mostly the business will be worth more if, in time, it comes to be based somewhere a lot nearer markets.  In some cases, proprietors will like to live here, and will sacrifice growth to keep the business here –  but it is a sacrifice, and in that sacrifice is a measure of the limitations of this place  as a (remunerative) home for too many people.  As one person who runs a small global business here recently put it to me, face to face contact still matters a lot, and if air travel is a bit cheaper than it was 50 years ago, it is no less physically draining or time-consuming.

So my question for Treasury is something along the lines of, why not take seriously (a) the lack of hard evidence that New Zealanders have had economic benefits from immigration, combined with (b) your own recognition that distance matters a lot, and (c) the fact that New Zealand remains a heavily natural resource based economy, with few signs that that is really changing, with no more natural resources being made (and increasing environmental concerns/constraints),  and then think harder about whether a government policy to drive up New Zealand’s population –  even as New Zealanders have kept on leaving –  really makes much economic sense at all.  Treasury has recently asked some good questions about the skill mix of our actual migrants, but they need to think harder about whether there are really top tier income-earning opportunities here for very many people, even if we could somewhat improve the average skills level of those who come.

Distance and location really do seem to matter, a lot.  Policymaking hasn’t really taken that seriously.

Thinking about changing immigration policy

I was going to write about the Reserve Bank’s forthcoming Monetary Policy Statement, but discussion around immigration policy continues in the media, so I thought the topic might be worth one more post.

There are all sorts of different numbers tossed around when immigration and net migration are debated.  Different numbers are relevant for different purposes, and things aren’t greatly helped by the fact that MBIE does not release regular monthly numbers on visa approvals, and so the month to month discussion is often dominated by SNZ’s permanent and long-term (PLT) migration numbers.

The centerpiece of our medium-term immigration policy is the residence approvals target: 45000 to 50000 people per annum.  That target hasn’t been changed for a long time –  it was the previous government’s target and the current government’s.  It is a large number by international standards: as I noted yesterday, in per capita terms it is around three times the number of green cards the US issues each year.  Actual approvals fluctuate a little from year to year –  I showed the chart in yesterday’s post –  but not very much, and the rules and points are tweaked a bit over time to keep near the target.  Debates about the medium-term implications of immigration, whether for population or economic performance, should really concentrate on the appropriate target level (and composition) of residence approvals.   It is important to appreciate that these days the bulk of people getting a residence approval are already in New Zealand (around 70 per cent) –  having arrived on, for example, a student or (temporary) work visa.  In most cases, granting a residence approval changes the legal status of the individual, and does not involve a new border crossing.

But, as I noted, the PLT numbers dominate the headlines.  PLT numbers (which importantly include New Zealand citizens –  not a matter of immigration policy) are only estimates.  We know exactly how many people come across our border (in and out) each month, but the split between permanent and long-term on the one hand, and short-term on the other, relies entirely on the self-reported intentions of those filling in the arrivals and departure cards.  Plans change.  As I’ve highlighted previously, Statistics New Zealand themselves have done useful work showing that at times the reported PLT numbers have been quite substantially different from the actual numbers who have come or gone for more than 12 months (I discussed this work here .  It is a great shame that SNZ is not adequately funded to produce these refined estimates on a regular basis.

Using the PLT data, one can look at either total arrivals or the net flow.

Here is total (self-reported) PLT arrivals by visa type for the last decade or so (the period SNZ provides the data for).

plt arrivals

Among other things, this chart illustrates my point above about residence visas.  About 43000 residence approvals were granted in the last year, but when people crossed the border to enter New Zealand only around 14000 arrived in the country already holding residence visas.  In granting residence approvals, policy now puts a high weight on people already having a job and being established in New Zealand, so most people who get residence approvals come first on student or work visas.  Even over this decade, one can see the rising share of these temporary visas.  Of course, not all these people stay permanently (or would want to).

And it is also worth highlighting the “not applicable” category, which captures New Zealand and Australian citizens who don’t need a visa to come and live here.  Over these 11 years, that number has fluctuated between 28000 and 36000 per annum –  not huge variation.  There is much more variation in the departures of New Zealand citizens: over the same period that total has fluctuated between 34000 and 62000 per annum.

Total PLT arrivals probably could probably be managed, more or less, with a policy target.  But it wouldn’t be very sensible to do so.  If our universities really do offer a great tertiary education there is no obvious reason why we’d want to put a policy cap on the numbers coming.  It is just another export industry.  The policy focus should be on the number, and composition, of the people (non New Zealanders) we allow to live here permanently.

What about net PLT flows?  They fluctuate enormously.  Here is the chart of annual flows since 1921.

net plt flow

Bear in mind (a) that the population is much bigger now than it was in earlier decades, and (b) that SNZ work suggesting that self-reported PLT flows don’t always accurate represent true permanent and long-term inflows. Importantly, using that analysis, the 2002/03 boom at peak was larger, as a share of population, than the current net inflow.

The average PLT inflow over the last 25 years has been just under 15000 –  a large outflow of New Zealand citizens, and a much larger inflow of non New Zealand citizens.  Perhaps this is the sort of number Winston Peters has in mind when talking about a target inflow of 7000 to 15000?

The net PLT flow cannot be managed by policy at least over short to medium-term horizons.  Cutting the residence approvals target, as I have proposed, would markedly reduced the average net inflow over time, but the cycles in net PLT would probably be about as large as ever –  just cycling around a lower mean.    Much of the variation is the change in the number of New Zealanders leaving (see above).  As I noted yesterday, when politicians talk of short-term caps or (as I heard Andrew Little call for this morning) “more agile” management of the system, it isn’t likely to be a recipe for more stability in PLT flows, but a risk of creating more (pro-cyclical) instability.   Forecasters of the net PLT flow 12 to 18 months ahead have a shocking track record.

Export education services have been flavour of the month in this debate for a while now, and I heard Steven Joyce on the radio this morning talking about how any serious cutback to immigration could put tens of thousands of jobs at risk in the export education sector.

To the extent that people are coming to study in New Zealand for the quality of educational products New Zealand firms and institutions have to offer, the Minister’s comments are almost entirely wrong.  People choose to study at Harvard or Stanford or Oxford because they are top-notch universities.

But that doesn’t look like the New Zealand story.  Here is a chart of student visas by the type of institution the student is studying at.  Unfortunately MBIE provides this data only back to 2005/06.

student vsias by type

All the growth in recent years has been in the polytech and private training establishment sectors.  I’m sure there are some excellent institutions in that sector, offering really high quality educational services rivalling the best in the world.  But one might also suspect that the stories of people using study here mostly as a way of being better positioned to get a residence visa, financed by the recent change of policy allowing students and partners to undertake a lot of paid work while they are here, has more than an element of truth to it.  If so, it isn’t that our export education industry is hugely competitive and successful, it is just another case of “export incentives” at work.  We dish out cash to the film industry, and in this industry a leg up on the residence approvals process is the subsidy.  Subsidised export industries certainly get a benefit themselves, and perhaps that benefits the people working for them.  They rarely benefit New Zealand in the long haul.  We should have learned that lessons decades ago.

Again, if our education sector was attracting real top-notch people, and encouraging them to apply for residence, there might be a net gain for New Zealand (lifting the average quality of the people we decide to let stay).  But as Treasury has noted, we aren’t doing that well at attracting really highly-skilled people.  The recent Fry and Glass book reported that we are doing less well on that score than either Australia or Canada.  And, as a reminder, these were the top five occupations for the skilled migrants last year.

Chef
Registered Nurse (Aged Care)
Retail Manager (General)
Cafe or Restaurant Manager
ICT Customer Support Officer

Those five occupations alone made up 25 per cent of the skilled migration approvals.  And skilled migrant approvals made up only around 60 per cent of the total residence approvals –  others, presumably, were not even reaching that standard.

If we were to look at changing our target level of residence approvals there are some significant questions to address.

One is how fast to make any change.  I’ve argued for pulling the target down from 45000 to 50000 per annum to 10000 to 15000 per annum, but haven’t taken a strong view on a transition path.  The housing market stresses, and long-term productivity underperformance, are sufficiently serious that there is probably a reasonably case for making the change in one step.  I wouldn’t favour a very gradual adjustment –  say, pulling the target down 5000 a year –  partly because it would be too hard to distinguish the effects of the policy change from all the other stuff going on. A middle ground might be to, say, halve the residence approvals target for five years, with a full review of the costs and benefits of that approach to be undertaken at the end of the period.

The other key question is what the composition of a lower approvals target might be.

Here is a chart showing the breakdown of residence approvals, using MBIE data.

res approvals by category.png

It would be very easy to simply squeeze out skilled migrants (and their spouses and children).  Personally, I think that if we are serious about immigration serving an economic role we would need to think hard about some of the other categories.  For example, in the most recent year, around 10 per cent of residence approvals went to parents (presumably generally quite elderly) of people now living here, with a few hundred additional approvals for adult children and siblings.  There is little or no prospect of economic gain to New Zealand from this migration –  and no obvious humanitarian case either –  and a pretty good chance that (unlike most skilled migration) the net fiscal cost of these migrants will be quite substantial.

We also approved residence for 1500 people under two Pacific Island access categories.  These are presumably people who would not have qualified as skilled migrants.  Perhaps one can accommodate those sorts of numbers within a 45000 to 50000 annual target, for historical or foreign policy reasons.  Much harder questions would have to be asked if we brought our overall immigration numbers more into line with international practice.

I don’t have a particular view on appropriate refugee numbers.  If anything, at present, there is a push to increase that quota at present.  That is a legitimate choice for a country to make, but most probably to do so would further reduce the chances of the immigration programme making a meaningful economic contribution to New Zealanders.  Then again,  I read the evidence as suggesting that immigration mostly benefits the migrant, and that countries are fooling themselves if they treat large scale immigration as (as MBIE does) some sort of “economic lever” to lift medium term domestic economic performance.

There is a lot of talk about how disruptive a cut in the immigration (residence approvals) target could be. No doubt that is true for firms and sectors that are focused on meeting the needs of a rapidly rising population – be it builders or whatever (furniture and carpet shops). But a lot of that argument is built on the fallacy the immigration eases overall labour shortages. If anything, it exacerbates them: the short-term demand effects of immigration outweigh the supply effects.

Let’s say, as a deliberately extreme example, that my preferred policy – cutting the residence approvals target to 10000 to 15000 per annum was adopted tomorrow. What might we see over the following few years?

I noted yesterday that we would see house and urban land prices a lot lower, especially in places that have experienced considerable population pressure in recent years.

We’d also see a lot less building activity – across all types of construction. We’ve seen this before – when net migration was very low in the late 1970s and early 1980s the construction share of GDP was much lower than it had been before or since. Quite possibly, the PTE component of the export education industry would take a hit.

But all of these pressures would be recognised in the Reserve Bank’s economic forecasts, and monetary policy would adjust to take account of the weaker demand pressures. In fact, markets would be likely to adjust even before the Bank, so long as the policy change was well-signalled and treated as credible. Real interest rates would fall, and so would the real exchange rate. Our exchange rate stays high only because New Zealand pretty consistently offers a yield premium over those on offer in other currencies. We’d see a classic case of resource-switching. The cost of capital to firms developing businesses here would be lower, and the lower real exchange rate would be particularly attractive to firms looking at opening, or expanding, in the tradables sector. Recall, that per capita sector production has not increased for 15 years. This policy change would help reverse that shocking record. It seems likely that regions outside Auckland – in many cases, much more export focused, would get a particularly substantial boost.

What about the labour market? As I’ve already noted, high levels of immigration don’t ease overall labour market pressures, they exacerbate them in the short term. So, all else equal, a lower rate of residence approvals (not simply offset with more work visas approvals) would ease labour market pressures to some extent (offset, of course, by the easier monetary policy). Perhaps some sectors might still find it difficult to get the right people. That is what the price mechanism is supposed to deal with: higher wage rates for particular skills or sectors will, over time, draw people into those occupations. There is a price at which New Zealanders will be aged care workers or dairy hands. For firms in the non-tradables sectors, that higher price might be difficult to absorb. In a sense that is part of the point: reorienting the economy towards the tradables sectors puts pressure back on the non-tradables sectors. For firms in the tradables sectors, the lower exchange rate provides a margin that can accommodate any wage pressures that might develop in individual sectors. But I’d be surprised if those pressures were large or systematic: after all, many of the people who have been employed in sectors responding to the rapidly rising population have to find some other place to work.

Over five years, I’d expect we’d start to see material gains for New Zealanders as a whole. More affordable house prices, a larger share of the economy selling to the rest of the world, reduced pressure on unskilled New Zealanders, and so on. Successful economies typically succeed by finding ways of selling more and better stuff to the rest of the world. We’ve failed on that count (in per capita terms) for decades, but we can turn it around. I’d expect that five years after such a policy was adopted we’d have started to see our productivity performance markedly improving relative to those in other advanced countries. If global productivity performance was still weak, ours might still not be all that we’d like, but we’d almost certainly be doing less badly than our peers. The gaps between productivity levels in New Zealand and those abroad are so large that it will take decades to reverse them. But as we do, we might even find ourselves in the position the Irish finally found themselves in last decade – the huge diaspora finally started to come home.


Immigration: some follow-up points

Yesterday’s Q&A discussions on immigration seem to have attracted quite a bit of coverage.

Of course, most of that focused on the comments made by Winston Peters, and I don’t have anything much to say about those except to note two things.

First, I was interested to hear him talk of targeting 7000 to 15000 annual migrants, which was quite similar to my suggested target for residence approvals of perhaps 10000 to 15000 per annum.  The United States issues around 1 million green cards a year, and as the US had about 70 times our population that is about the same rate of per capita immigration as would be implied by my 10000 to 15000 annual range.  It isn’t a level that amounts to shutting the door.

Second, Peters has twice before been a senior minister and has never made the rate of permanent immigration a central issue in negotiations to form a government. Perhaps this time will be different.

Of my comments, most of the coverage has been around the suggestion that if the residence approvals target was cut as I suggested, house prices might be 25 per cent lower in a couple of years.  It wasn’t intended as a precise estimate, more an indication that population growth (and especially unexpected changes) make a material difference to house prices in markets where the supply response to impaired by the thicket of land use and building regulations.  However, it is quite a plausible estimate, consistent with some past empirical research on the link between population change and New Zealand house prices.

A decade ago, Coleman and Landon-Lane, in work done at the Reserve Bank, estimated that a 1 per cent shock to the population would shift house prices by 10 per cent, and more recently Chris McDonald’s Reserve Bank work produced not-dissimilar   estimates (especially for non New Zealand migrants).   Adopting my proposal to cut the residence target by 35000 per annum would, all else equal, lower the population by 1.5 per cent in the first two years.  But, more importantly, it would materially lower the expected future population, and asset markets (such as the urban land market) work on the basis of expectations.  Over a decade, again all else equal, the population would be around 7.5 per cent lower on my proposed policy than on current policy.  All else equal, urban land prices would be much lower.  Of course, all else is never equal, and with less population pressure some of the pressure to liberalise housing supply would dissipate.  But the direction of the effect on house prices is pretty clear, and the magnitude would almost certainly be quite large.

Perhaps one thing that disappointed me a little about yesterday’s programme was that discussion tended to focus on the immediate cyclical pressures, and especially those on Auckland house prices.  I guess those issues are most immediately salient, especially in Auckland, and perhaps most easily accessible to a lay audience.  My own arguments have tried to focus (a) not on the cycles in net migration, much of which are about New Zealanders coming and going, but on the trend target level of residence approvals, and (b) on the impact of New Zealand’s disappointing overall economic performance (ie the continued trend decline, over many decades, in our relative productivity).  We could fix up the land supply market –  and should –  and many of those questions and issues would, almost certainly, remain outstanding.  That said, when the advocates of the current policy can show so little evidence suggesting real economic gains to New Zealanders (as a whole) from our really large scale immigration policy (repeat, policy – the target level of residence approvals) then the appalling house price situation cries out for winding back the level of migration approvals, as one way of mitigating the adverse effects of the land use restrictions.    One could envisage an alternative world in which the real economic benefits of large scale immigration were large, clear, and demonstrable, and yet the housing market was still severely dysfunctional.  In that world, there would be some nasty potential tradeoffs if reform of land supply couldn’t be achieved.  But we aren’t in that world.  Here, it looks as though winding back migration approvals might well improve productivity prospects and improve housing affordability.   There would, and will, always be cycles in net measured migration, but the policy component is relatively easy to adjust, and to maintain at a different target level (lower or higher) than we’ve had for the past 15 years.

I was pleasantly surprised at the moderate and reasoned approach the Q&A panel took to the immigration segment.  They recognized that there are some real issues that need rational and thoughtful debate.  Nonetheless, they all still seemed in the thrall of the idea that “skill shortages mean we need migration, just perhaps a “better quality” of migrant”.   There are really just two points that need to be made in response.  The first is that empirical research suggests –  and historical casual empiricism does too –  that an influx of migrants adds more to demand rather than to supply in the short-term.  People who live in a modern economy need lots of real physical capital, and it doesn’t build itself.  So although an individual migrant might ease an individual employer’s problem, in aggregate high immigration simply further exacerbates any existing excess demand for labour (skilled or not).  Economists have recognized that for decades.  It doesn’t, of itself, make immigration a bad thing –  long term gains might still make it worthwhile –  but immigration isn’t a way of dealing with systematic skill shortages.    By contrast, a flexible domestic labour market is quite a good way: changing wage rates should signal difficulties in attracting people to particular roles/regions.  It doesn’t work overnight, and it doesn’t work in aggregate if the economy is overheating, but it works when given the chance.

The panellists also seemed taken with the idea that more should be done to get more of the migrants who do come to go to regions other than Auckland.  That seems, at least in part, to reflect a sense that something is wrong about things in Auckland (whether short term or long term) and perhaps a sense that a more successful New Zealand is likely to be one less strongly skewed away from the regions. But it risks leading to even more wrongheaded policies.  We’ve already seen that last year, when the government amended the rules to give additional bonus points to people with job offers in the regions.  Unfortunately that has the effect of lowering the average quality of the migrants who get in.  The residence approvals target is largely fixed, and the changes in the scheme rewards those who can get to particular locations, not either (a) the most highly-skilled migrants, or (b) the most rewarding and productive New Zealand jobs.  Auckland’s economic performance has been quite disappointing, suggesting it isn’t a natural place to funnel ever more people into.  But that doesn’t suggest that the solution is to funnel more people to other places instead.  It suggests focusing on the whole economy –  in particular, getting the real exchange rate sustainably down –  and letting a rather smaller number of total permanent migrants locate where the jobs and rewards are best.  In that sort of world, Auckland’s population might be materially smaller than it would be on current policy, but the population of the regions might not be much larger.  But the share of the regions in overall economic activity would be larger than it is now.  Better to cut the overall residence approvals target, and focus in on a modest number of really highly-skilled people.  The regions aren’t short of people, but Auckland seems to be awash in them (relative to the high-returning opportunities that seem to exist in Auckland).

As a final observation on the Q&A discussion, I was interested in Andrew Little’s response to questions about immigration.  He continues to toy with the idea of some sort of short-term cap on migration. I don’t think that is particularly sensible or meaningful.  No one can accurately forecast short-term fluctuations in net migration (ie the combination of New Zealanders and foreigners) and if those fluctuations can’t be forecast, one can’t run meaningful short-term caps. In the nature of things, and well-intentioned as they might be, they would simply risk exacerbating the short-term cycles in net migration: pull back approvals when net migration was at a cyclical peak, and by the time those changes took effect, often enough the natural cycle would have turned down anyway.  And vice versa when net migration is at a trough.  We are much better to run a stable and predictable programme of residence approvals, and live with the natural variation that results mostly from New Zealanders coming and going.    In my view, the target level of approvals should be lowered quite substantially, but wherever it is set it shouldn’t be messed around with –  up or down –  in response to short-term cyclical pressures.

But my concern about Little’s comments was more about the underlying message.  Twice in the space of thirty seconds, he repeated the line that “New Zealand has always been a country dependent on bringing in skills from abroad”, stressing that he would never want to change that.  It is simply a mistaken model of growth.  The prosperity of any country depends primarily on some combination of the natural resources it has and, most importantly, on the skills and talents of its own people, and the institutions (political and economic) that those people nurture.    That was true of the United Kingdom or Holland centuries ago, it was true of the United States century or more ago, it was true of twentieth century New Zealand, and it is true of every advanced successful country today.  Of course, every country draws on ideas and technologies developed in other countries. In some cases,. immigration may even have helped the recipient country a bit –  but any such gains look to be quite small – but prosperity depends mostly on a country’s own people and own institutions.  The line Little is running is certainly consistent with the implicit stance of the New Zealand elite, across the main parties, but there is little or no empirical foundation for it.  Indeed, it risks sounding like a cargo-cult mentality –  waiting for just the right people from over the water to come and bring us prosperity.  Things simply don’t work like that.  It is a shame that our political leaders aren’t willing to put more faith in the skills, talents, and energies of our own people and firms, rather than (so it seems) wanting to “trade us in” for some better group of people.  Countries don’t get successful by bringing in better people: rather, successful countries can afford to bring in more people, if they choose.

In this morning’s Herald, the other key prominent academic in the liberally-funded (by MBIE) CaDDANZ project, Professor Paul Spoonley of Massey, has an op-ed championing the current immigration policy.  It probably warrants a post of its own, but his bottom line seemed to be “keep the faith”.

Spoonley starts with this:

The International Labour Organisation estimates a 1 per cent increase in population expands GDP by between 1.25 and 1.50 per cent.

I’m not sure the source of this estimate, but it is a huge effect.  Stop and think about what it means for New Zealand, if it were true over the medium-term.  We’ve had one of the fastest population growth rates in the OECD in recent decades, and yet one of the worst productivity growth performances.  So perhaps the really rapid migration-fuelled population growth has been really really good for us, and everyone else has gone really really badly, to explain our overall disappointing performance. But where is evidence –  the telling statistics that suggest that that is really what has gone on? Professor Spoonley knows about the disappointing New Zealand economic performance, so it is a shame that he didn’t try to relate his general claim to the specific experience of New Zealand.

Spoonley then argues

Auckland gains from the effects of agglomeration. Population growth and immigration is associated with economic growth and diversity. For example, Auckland and Canterbury between them accounted for almost all the new jobs growth in New Zealand last year.

Immigration is key to this as skilled immigrants add to the human talent pool that is available to employers. They also establish new businesses and contribute to demand, including for education. Regions and cities that are not attracting immigrants are losing out on this current windfall.

It is fine theory. It just bears no relationship to  the experience of New Zealand, and Auckland in particular, in recent decades.

I’ve shown this chart before

ngdp akld ronz

No one disputes – Spoonley doesn’t –  that Auckland’s population growth is largely migrant-driven.  And yet Auckland’s per capita GDP has been trending down relative to the rest of the country’s over 15 years.  And the margin of Auckland’s GDP over that of the rest of New Zealand was already low relative to what we see in most other advanced economies.

Perhaps Professor Spoonley and the other New Zealand pro-immigration advocates (many of them taxpayer funded) are right about the benefits to New Zealanders of this really large scale intervention.  But even if so, surely we deserve much more evidence of those benefits than we get when leading academics simply assert over again that, whatever the short-term stresses, the Think Big programme is really working out just fine?

And to end a long post, just a simple chart.  It shows residence approvals for each year since 1997/98.

residence approvals

The data are only available annually, but they are hard data on the number of people MBIE has given residence visas to.  This isn’t SNZ arrivals and departures data, it is the policy core of the immigration programme –  aiming at 45000 to 50000 approvals per annum.  One of my commenters keeps trying to distract from this issue by citing PLT data. Those data are often interesting and useful (and in other ways quite limited) for various other analytical purposes, but if we want to think about the implications of the annual flow of residence approvals this is where the focus should be.  Annual approvals under this programme are not very cyclical, and haven’t varied much across the last two governments.  They are simply very high by international standard (per capita) –  three times the US level.  And on the (lack of) evidence to date of economic benefit to New Zealanders, the annual target should be wound back quite considerably.


Convergence…and not

I’ve been under the weather with a bad cold and wasn’t going to write anything today.  But pottering around various websites, I discovered that the Conference Board had last week released its annual update of labour productivity estimates, in PPP terms, for a wide range of countries.

Since my involvement with the 2025 Report some years ago I’ve been intrigued by developments in the eastern European countries, which laboured under Communist rule for decades until around 1990.  By 2009  when we wrote that report, the first ex-communist country had almost caught up to New Zealand’s real GDP per capita.

Older readers will recall the line Bob Jones made much of in the 1984 election campaign, in which he compared New Zealand’s economy in 1984 to a Polish shipyard.  The implication, of course, was that it was the heavy burden of protection and controls that were accounting for New Zealand’s disappointing economic performance.

Of course, for all that was wrong with economic policy in New Zealand in the decades from the 1930s to 1980s, our economy was not remotely as distorted as those of the east European countries.    But in a sense the narratives were similar in the two countries: open up the economies to more international competition, and liberalise domestic markets in a context of secure property rights, and stabilize macro policy imbalances, and one should expect to see a lot of convergence, catching-up with the more successful market economies.  Here is an illustration of the sort of thing that was expected in New Zealand –  a 1989 photo (reproduced in the Herald a few years ago) of then Finance Minister David Caygill’s expectations/aspirations.

caygill 1989 expectations

How have the eastern European countries got on?  The Conference Board has GDP per hour worked data for 11 eastern European countries back to 1990.  Here is how each of them has done relative to New Zealand in the 25 years from 1990 to 2015.

east europe convergence to NZ

The median eastern European country had GDP per hour worked 55 per cent of New Zealand’s in 1990, and that had increased to 77 per cent last year.  All except Russia gained material ground on New Zealand.

That might look unsurprising.  After all, these were very  badly distorted economies during the Communist era.

But, in fact, this chart materially flatters the extent of eastern European catch-up.  Here is the same chart showing these eastern European countries and New Zealand relative to US productivity levels.

east europe cf USA

In 25 years since the fall of Communist rule in eastern Europe, the median country of those 11 had increased labour productivity from only 38 per cent to 48 per cent of US levels.  Russia had lost ground relative to the US.  And so –  less dramatically –  has New Zealand.   (And the picture is much the same if one uses France and Germany as a benchmark, rather than the US.)

They were daft and damaging protectionist/statist policies we had in place during those decades – 20 TV factories indeed –  but they don’t look to have been a big part of the story in our relative decline.