A puzzle

The Reserve Bank’s Monetary Policy Statement yesterday seems to have caught the market on the hop. Such things would be less likely if (a) we had a better MPC, and (b) they actually communicated (speeches and the like). A steady flow of supporting empirical research might help as well. But immediate market surprises aren’t really my prime focus or interest.

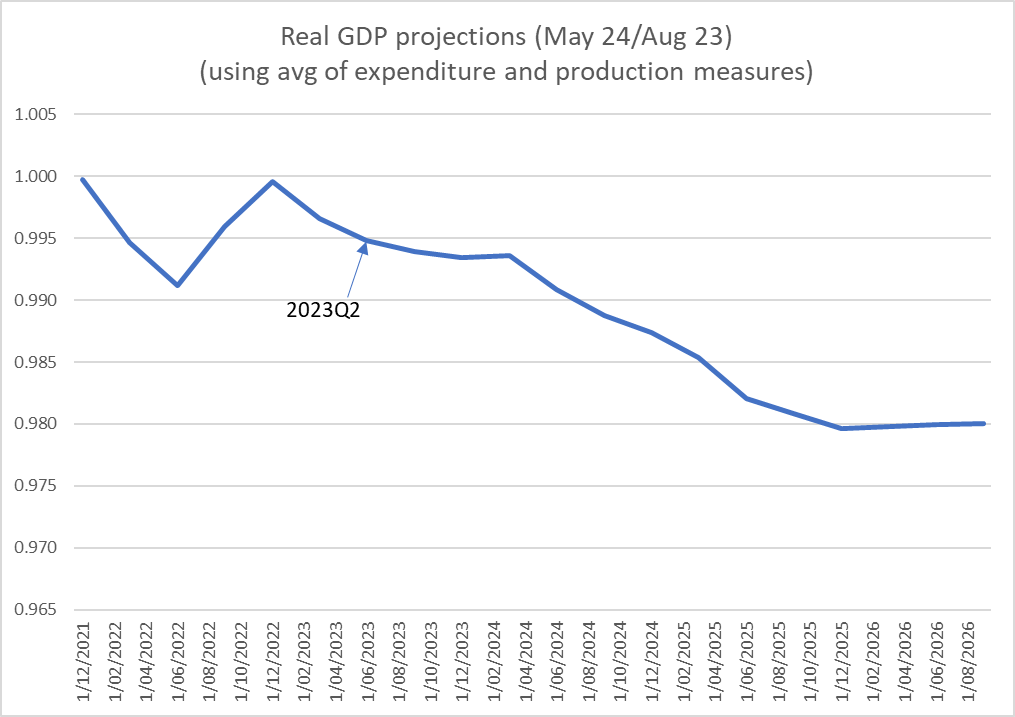
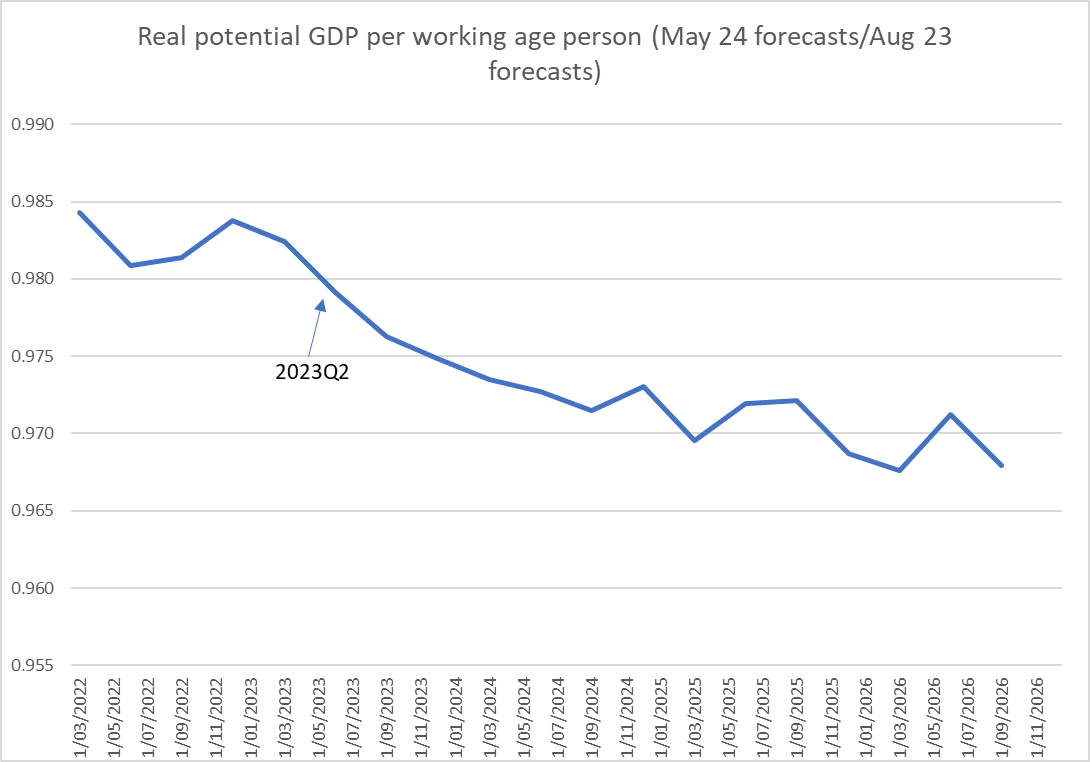
My interest is more in things like this, showing (all using RB forecast data)

  • the real OCR (OCR less annual CPI inflation to that particular quarter)
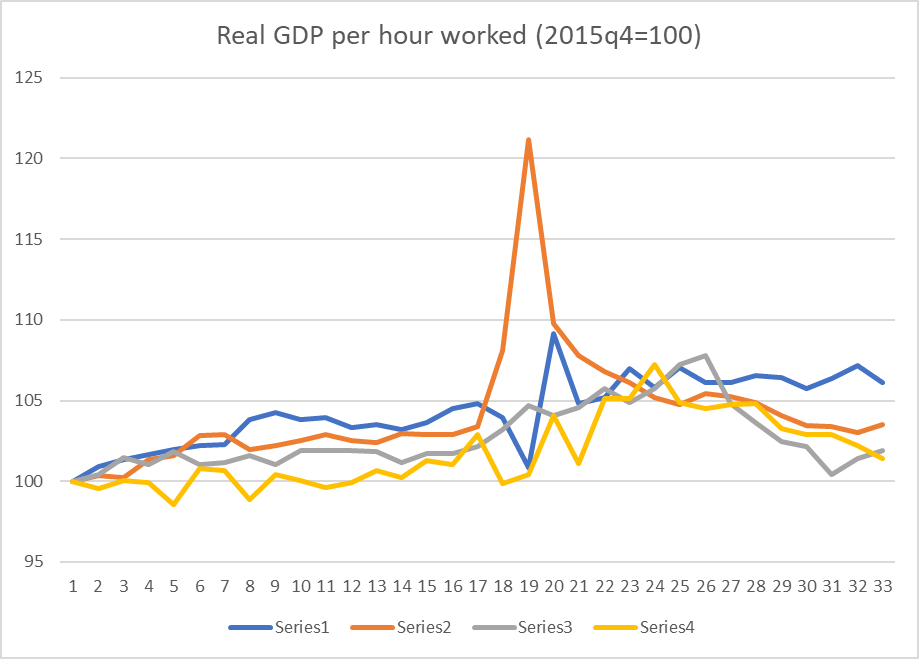
  • real GDP growth per working age population person (the RB doesn’t provide total population forecasts, so this is a proxy for per capita GDP growth). I’ve shown the actual data in red and the forecast data in blue

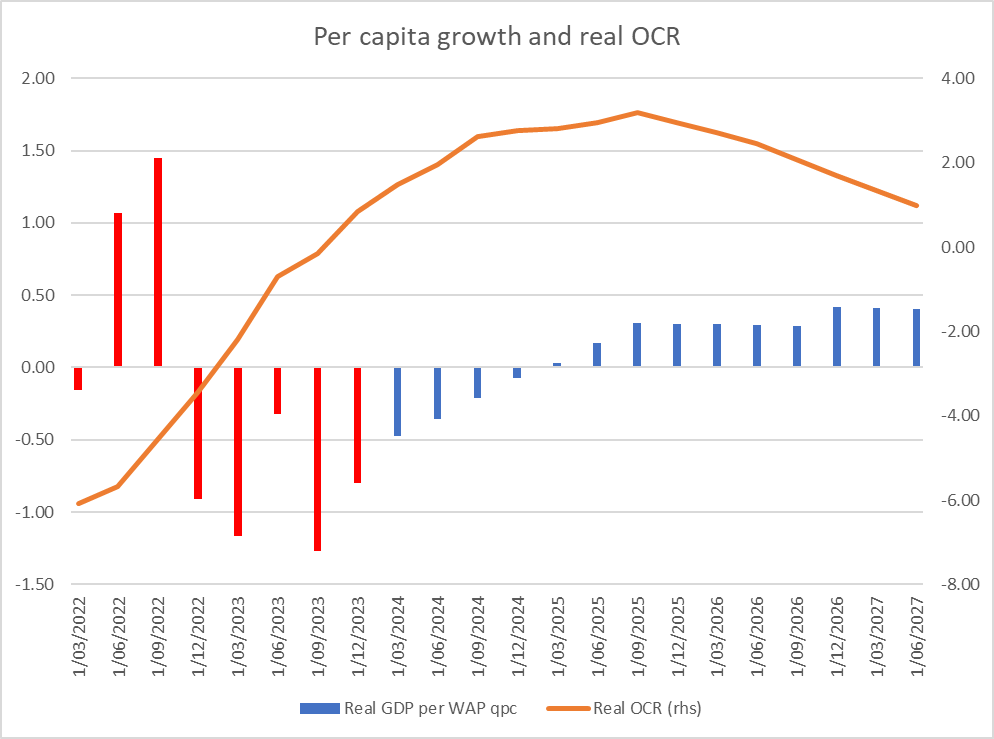
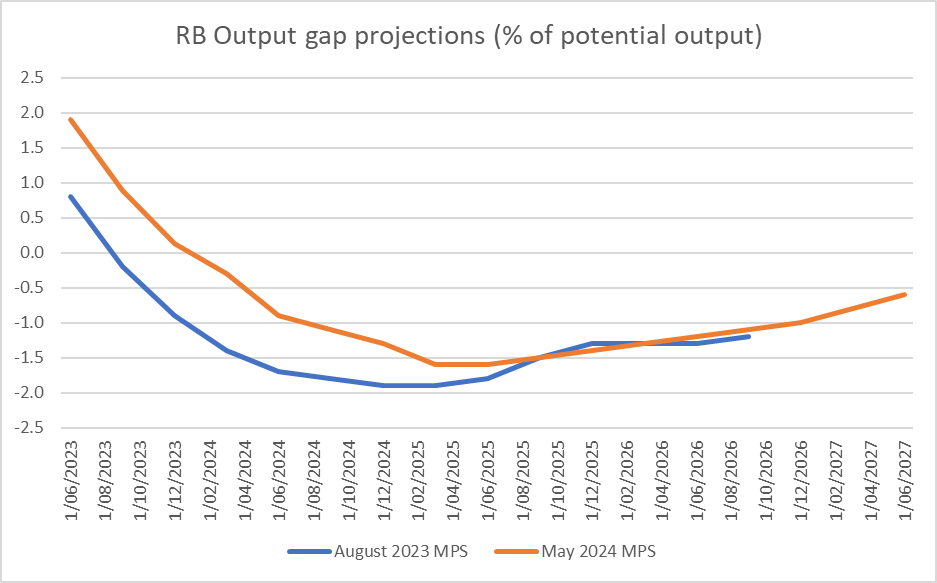
On the Reserve Bank’s projections, the OCR itself does not begin to be cut until the September quarter of next year (these forecasts once again push out any easing by another quarter or so). So even in nominal terms there is no monetary policy relief for another 15 months (and the exchange rate isn’t forecast to change either). Getting a good sense of real rates isn’t so easy. Inflation expectations never got as high as headline inflation, so those really deeply negative numbers on the left of my chart might be a little misleading. But….for the last year or so both inflation and measures of inflation expectations have been falling while the OCR has not: unquestionably, the real OCR has been rising further. On the Reserve Bank’s own numbers real interest rates seem set to increase further over the next 12-15 months (after all, most inflation expectations measures are influenced somewhat by recent experiences of inflation data).

So, real interest rates keep rising, and yet on the Reserve Bank’s telling the economy starts recovering, and by next September quarter is already back to generating real growth per WAP person of 0.3 per cent per quarter (annualised rate of about 1.2 per cent, which is hardly stellar but in an economy with basically no productivity growth in recent years certainly isn’t to be sniffed at – after all in the most recent year this measure of real GDP per capita has fallen by about 3.5 per cent)¹.

Where, you might wonder, is all this recovery in growth, to not-unrespectable levels, coming from? It is a good question. It isn’t from a stronger world economy (the assumptions the Bank is using there don’t show much change in growth rates), it isn’t going to be from looser fiscal policy (and certainly not on the dated numbers the Bank has to use, pending next week’s Budget), and as I noted it isn’t going to be from monetary policy (on the Bank’s numbers: rising real interest rates and an unchanged exchange rate). Fans of the government might mention its reform agenda etc etc, but…..there doesn’t seem to be much of one, and (more importantly here) the Bank doesn’t mention one as any sort of explanation. If anything, business confidence etc is weakening, with no sign of some contagious outbreak of animal spirits and associated entrepreneurship and investment. Oh, and the impulse to demand from the unexpected and very large surge in immigration isn’t going to be repeated (again on RB forecasts). The Bank’s forecasts have net migration halving from the rate experienced in the second half of last year.

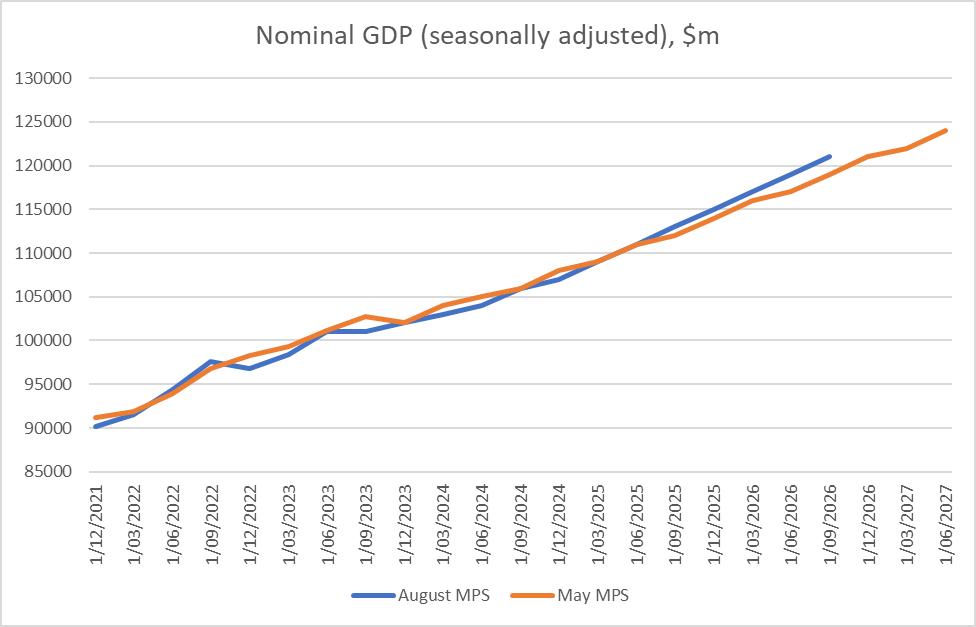
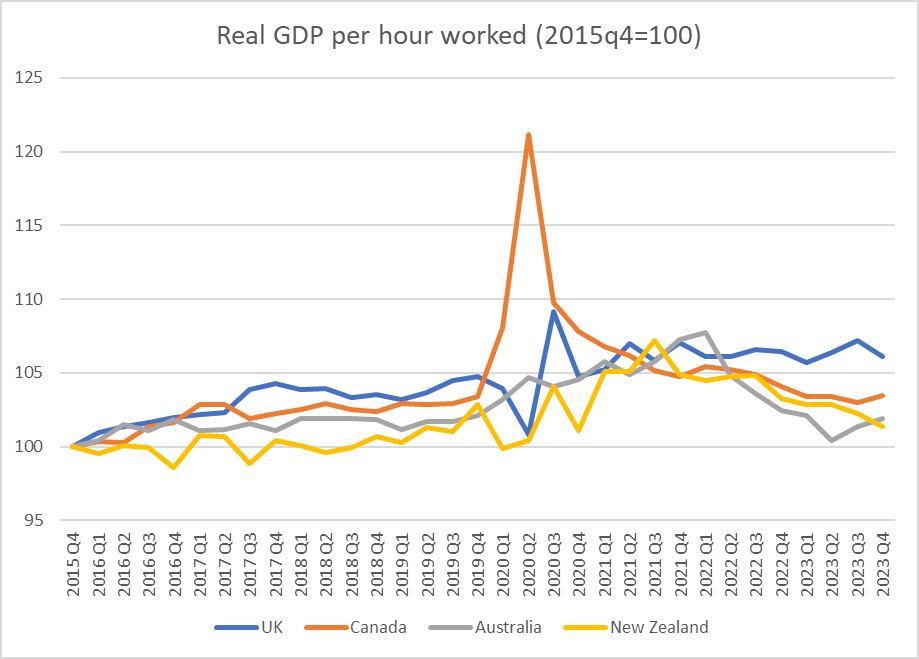
The story just doesn’t ring true. I don’t think anyone doubts that the big increase in interest rates over the period to May last year (when the OCR got to the current 5.5 per cent) has played a significant part in the very weak economic performance of the New Zealand economy over the last 18 months (see chart). And we know – and the Reserve Bank often tells people – that there are non-trivial lags: monetary policy does not have its full effect on real economic activity anything like instantly, and a lag of perhaps 18 months is often cited. And although there is an argument that unexpected changes in interest rates might matter, no one really doubts that a persistent period of interest rates at any particular level (away from some conception of neutral, and these rates are above neutral on the Bank’s own telling) is going to have material economic impacts. So what is it that leads the Reserve Bank to think that we are now through the worst (of the GDP per capita contractions) and are on our way back to growth? I read the (very short) Economic Projections chapter in the Monetary Policy Statement and there was no hint of an explanation there either.

And then when the OCR does finally come down (in their projections) there isn’t much sign of a robust economic response to that either – unless the Bank thinks the lags are so long those effects won’t be seen until after mid-2027. But in that case, we’d be right back to the question: why do they think the economy is now about to pick itself up quite a lot from the deeply negative per capita GDP growth experience?

The story simply doesn’t seem to make a lot of sense. I’ve seen a few comments suggesting that the MPC is simply trying to bluff the markets – they don’t want to cut the OCR, and just needed some vaguely plausible headline numbers to back that preference. I’d be rather surprised if that was the real story, but when we have this immaculate recovery – even as monetary policy remains hostile, forecast immigration trends remain hostile, and fiscal policy is hardly supportive either – it is really hard to know quite what is going on.

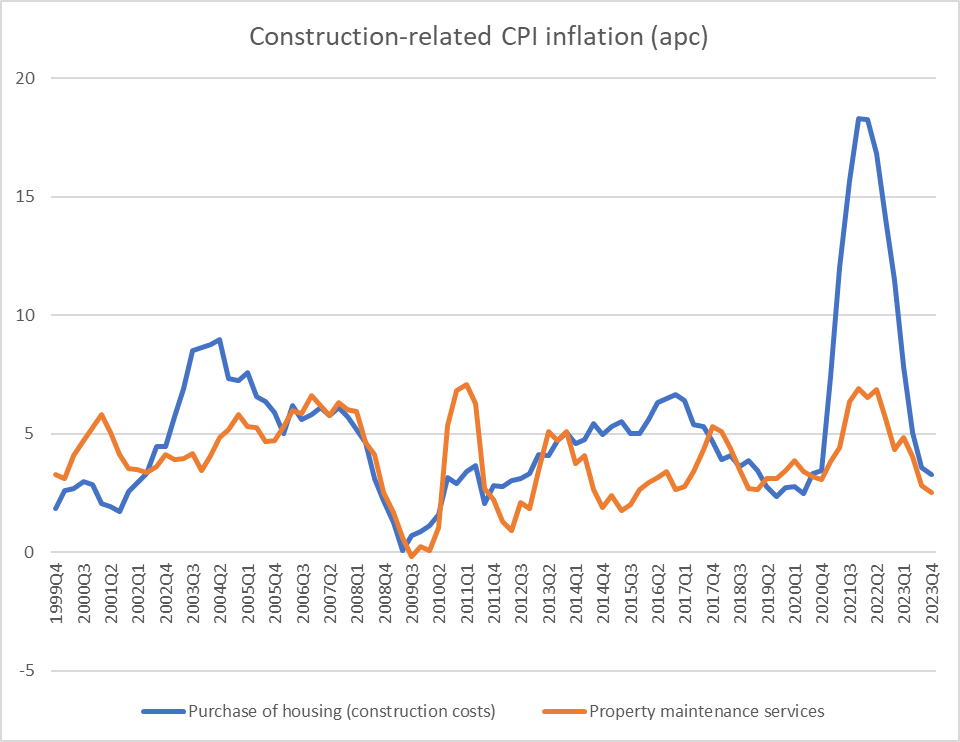
As for the inflation outlook itself, I’m not really persuaded it is quite as worrying as the Reserve Bank suggests. As a couple of straws in the wind recall that construction costs are among the most cyclical (and labour intensive) parts of the CPI, and residential construction activity is probably the most cyclically variable part of the economy. With inflation in those sectors now running below historical averages, it probably bodes well for inflation in other service sectors.

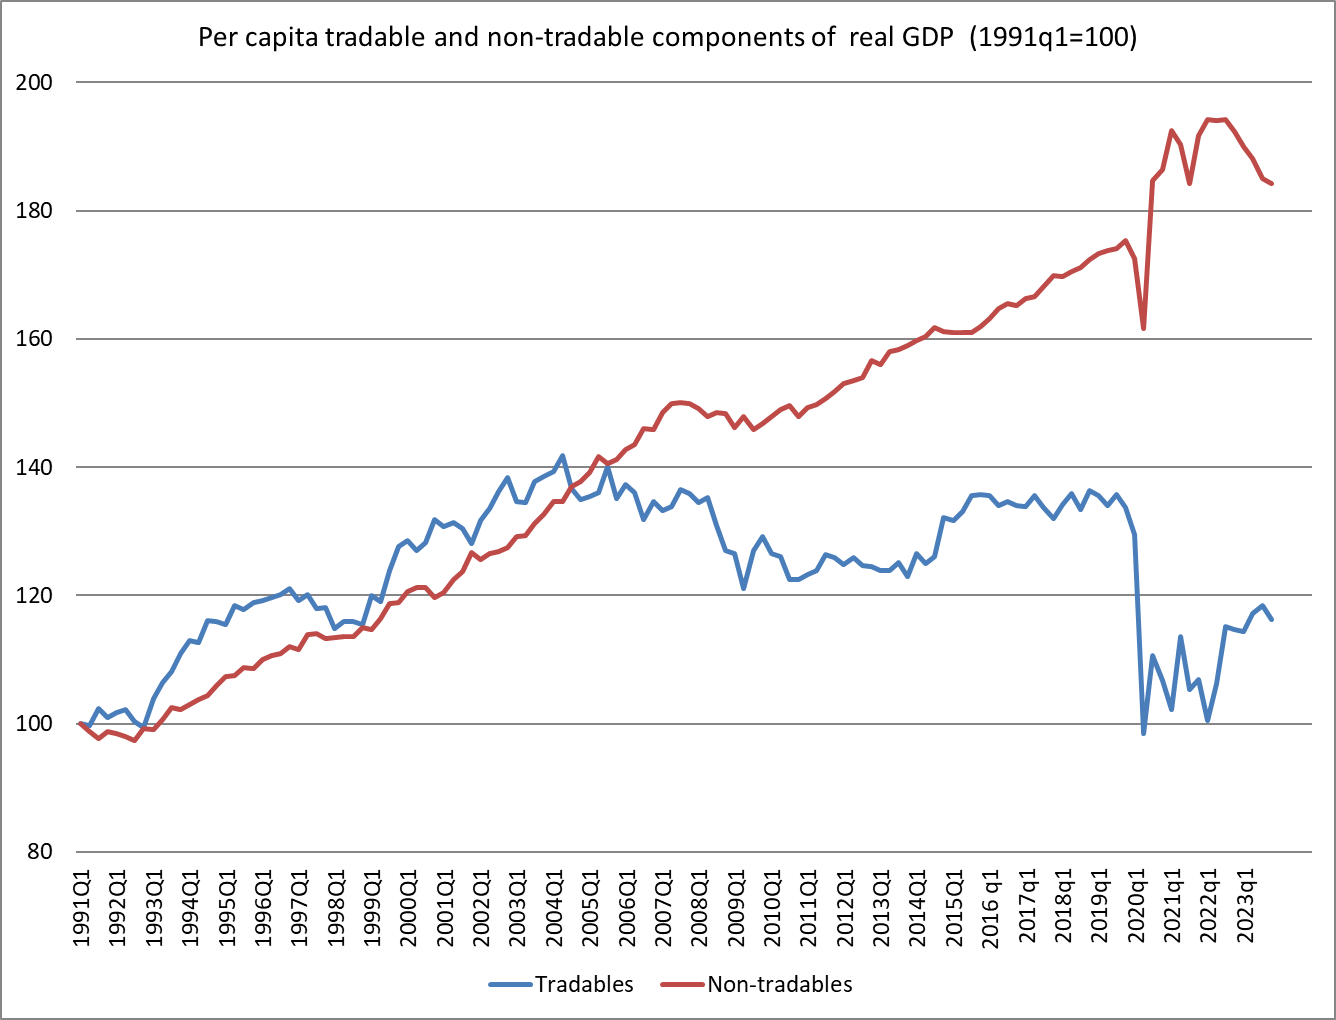
Perhaps the Bank is right to worry, but it would be more persuasive in doing so if (a) they had a more compelling economic story (see above), and b) they offered more analysis and forecasting of inflation in core or underlying terms. A fair bit of the discussion in New Zealand proceeds around a tradables vs non-tradables split (and in my time, decades ago, as forecasting manager at the RB I actually introduced the first such breakdown) but…it is very uncommon internationally, has had some use when (as in times past) the New Zealand exchange rate was very volatile, but may not shed much light especially when – as at present – the adverse idiosyncratic shocks (that monetary policy might reasonably look through) are very much concentrated in the so-called non-tradables sector. Here, I’m not thinking of relatively strong rent increases, which are clearly a function of domestic demand and supply pressures, but of local authority rates increases (which have many of the characteristics of any indirect tax shock) and of insurance increases, which seem to have only a limited amount to do with anything domestic at all (and not to domestic pressure on real resources) and much more to do with adverse shocks to global risk-bearing capacity etc. They are real hits to consumer purchasing power, but would almost certainly be filtered out in any forecast of, say, trimmed mean inflation. It is quite a curious gap in the Bank’s projections that they make no attempt to do such forecasts (by contrast, and for example, the RBA does).

¹  Over the last full economic cycle (2007Q4 to 2019Q4) real GDP per working age person increased at a median annual rate of 1.1 per cent.

Reading the MPS numbers thinking about the fiscal situation

The Reserve Bank doesn’t do independent fiscal forecasts so there is no news in the fiscal numbers in today’s Monetary Policy Statement themselves. The last official Treasury forecasts don’t take account of whatever the government is planning in next week’s Budget, and as the Bank notes they will need to update their assessment in light of whatever the spending and tax plans prove to be.

So I was more interested in the Bank’s numbers for the things they do forecast independently, and which in turn have implications for both the tax revenue the government could expect to collect on any given set of tax rates and for the likely expenditure pressures (from things like population growth and inflation).

One of the lines the Minister of Finance has repeatedly sought to use over her time in office is something about how much worse the economy was than they had appreciated (or had been clear) pre-election, to soften us up (it appeared) for yet more delay in getting back to fiscal surplus (see, we can’t really help it, it was done to us, and no one told us). It has always been an unsatisfactory argument (to say the least) since the previous projections (say, those in the PREFU and those in National’s fiscal plan) weren’t for a return to surplus for a couple more years anyway (2026/27) and by then whatever the forecast fiscal outcome, it is purely a matter of policy choice.

Now, the Budget numbers out next week will use The Treasury’s forecasts as their base. But here are the nominal GDP projections the Reserve Bank was making (a) at the August 2023 Monetary Policy Statement (ie the last set of forecasts pre-election), and b) today. Nominal activity is what gets taxed.

There is a slightly larger gap opening up a couple of years out (when, of course, who knows; both sets of numbers are just anyone’s guess out there) but as late as the June quarter next year the two observations are exactly the same, as they are (a 0.1% difference) for the last pre-PREFU quarter, 2023Q2.

Ah, perhaps you are thinking, but what about inflation. If there is more inflation than was previously forecast the revenue just won’t go as far.

But there isn’t anything much in that sort of story either.

There were some historical revisions late last year to the estimated level of real GDP. Those revisions don’t have any material implications for anything much, since life had already been lived through that period, and (in any case) it is nominal GDP that more closely approximates the tax base.

But in this chart I’ve shown the ratio of the RB’s latest forecasts for real GDP to those it did last August, and it is certainly true that over the full forecast period the latest forecasts are a couple of per cent weaker than last August’s forecasts.

Here is a slightly more obscure chart: the same sort of ratio but this time for the Bank’s estimates of real potential GDP per working age population. Things worsen there by about 1 per cent relative to the position thought to have prevailed just prior to the election.

And if weaker GDP per person implies some loss of productivity (some things the government might be purchasing won’t be getting relatively cheaper), it also suggests that (eg) public service wage pressures and NZS adjustments should be less than they might otherwise be.

The key point? At least on the Reserve Bank’s telling – and they could of course have a very different view than the Treasury – there just isn’t that much there. We are set to be less well-off per person than the Bank thought just prior to the election, but nominal GDP and the CPI forecasts have barely changed, and even the real output changes aren’t particularly large in the scheme of things (nothing at all like the extent of the revisions that followed in the wake of the 2008 recession). What we have, on the Bank’s numbers, is a recession and a protracted period of excess capacity (slack) that is not quite as deep, but quite as protracted, as the Bank suggested to any and all readers (Opposition politicians included) just prior to the election.

Some old documents (of no immediate interest)

This is really just a quick information post.

The Reserve Bank’s website has a complete set of Monetary Policy Statements from and including December 1996 onwards, but for some reason they have not put online the first few years of Monetary Policy Statements (which began being published, under the provisions of the Reserve Bank of New Zealand Act 1989, in April 1990). New Zealand’s inflation targeting regime (origins and early development here) took formal shape (with attendant legal obligations) when that Act came into effect, and the first Policy Targets Agreement between the Governor and the Minister of Finance was signed on 2 March 1990.

In the early years of inflation targeting there were (as the law required) only two Monetary Policy Statements a year. At the start, these documents were very light on specific forecast content. The Monetary Policy Statements were complemented by published Economic Forecasts documents, which had been released twice a year for some years (but which then had little impact on anything, and were once – in a meeting with the Minister of Finance I was attending – memorably disowned by the Bank’s Deputy Governor as “just the Economics Department’s view”). With the commencement of formal inflation targeting, and a growing recognition of the crucial importance of inflation forecasts in an inflation-targeting regime, the Economic Forecasts document took on a somewhat greater degree of prominence. For some years (until 1997) the Bank published both documents, in time on a schedule of alternating quarters (before eventually moving to the still-current model of four Monetary Policy Statements a year).

The Economic Forecasts documents for the period 1990 to 1997 are thus potentially of use to anyone seeking to study the entire New Zealand inflation targeting experience, and particularly the experience in the early years when we pathbreaking to some extent (often more like “groping in the murk”), and running a monetary policy implementation approach that was idiosyncratic to say the least. Neither they nor the early Monetary Policy Statements have been readily available.

I had had in my own files hard copies of some of these publications (with bits and pieces stuffed in them, including the September 1992 forecasts for which I was responsible and which the then Opposition Finance spokesman had described as “looking as though a public relations firm had written it” – on this occasion reality (notably fiscal reality) turned out better than the numbers he hadn’t liked)

But this complete set became available through the efforts of my son, who is doing an honours thesis in 2024 on some technical aspects of New Zealand monetary policy in recent decades. He requested the documents from the Bank and was provided with the full set from 1990 to 1997 (and my understanding is that it took a bit of work from the Bank, for which thanks). With his permission I am posting them here as a more permanent record and to make them generally available to anyone interested.

There is a full page, with a link on the front of this website, with links to all these documents

Two central banks

I got curious yesterday about how the Australia/New Zealand real exchange rate had changed over the last decade, and so dug out the data on the changes in the two countries’ CPIs. Over the 10 years from March 2014 to March 2024, New Zealand’s CPI had risen by 30.3 per cent and Australia’s CPI had risen by 30.4 per cent.

And that piqued my interest because the two countries have different inflation targets: New Zealand’s centred on 2 per cent per annum and Australia’s centred on 2.5 per cent.

So I drew myself this chart

Over the full 10 years, the two CPIs have increased by almost exactly the same amount, but they haven’t kept pace with each other steadily over that full period. Up to just prior to Covid, the Australian CPI had been increasing faster than New Zealand’s, as one might have expected given that the RBA had been given a higher inflation target than the RBNZ.

Now, before anyone objects, I should get in and note that in neither country is there a price level target. But if economies are subject to fairly similar shocks over a period of time one should normally expect a country with a higher inflation target to have experienced a higher cumulative price level increase than a country with a lower target.

Over the 10 years here is Australia’s CPI relative to the price level that would have been implied by being consistently at target midpoint

and the same chart for New Zealand

And in this chart I’ve put it all together

Over the half-decade or so to the end of 2019, the RBA and the RBNZ had both ended up undershooting (on average) their targets by about the same extent. If you look closely, the RBNZ was undershooting more earlier, and the RBA more towards the end of the decade, but there wasn’t a great deal in the difference.

But where the difference really becomes apparent is in the years (four of them) since Covid hit. Over that period, the RBNZ has generated/tolerated much more of an increase in the price level, in excess of what is implied by their target, than the RBA did. (And for those – like Orr – who like to try distraction with things like oil shocks, wars and rumours of wars, and supply chain disruptions, Australia faced all those too.)

There is a lot of focus in Australia – and apparently reasonably enough – on whether the RBA has yet done enough with monetary policy. It has certainly been puzzling that they reckoned they could get away with materially lower policy rates than in other Anglo countries, in the face of (still) near-record low rates of unemployment and a quite stimulatory fiscal policy. But so far, and overall, they’ve done a bit less badly than the Reserve Bank of New Zealand through the last four years taken together.

It remains somewhat remarkable how little serious accountability there has been for serious Reserve Bank policy errors, for which now pretty much everyone (except them) is paying the price. in one form or another.

(By the way, for anyone interested, the NZD/AUD exchange rate averaged 0.933 in the March 2014 quarter and 0.932 in the March 2024 quarter, so over that particular 10 year period there was no change in the real exchange rate at all.)

Words and (in)actions

When I wrote yesterday morning’s post, highlighting how poorly both New Zealand and its Anglo peer countries have been doing in respect of productivity in recent times (ie, in the case of New Zealand, Australia, and Canada even worse than usual), little did I know that the Prime Minister was about to announce a bold new economic performance goal. I wasn’t even aware he was giving a pre-Budget speech yesterday.

But there it was

Now, read it carefully. If it were just the first sentence in 1. it would be largely devoid of content. Even pessimists, with long experience of the underperforming New Zealand economy, probably reckon that the average level of productivity in the New Zealand economy will be higher in 2040 than it is now (these are the sorts of lines that go up over decades, under all but the most adverse circumstances). But the Prime Minister doesn’t stop there. The second sentence is clearly a statement about relative performance: the Prime Minister’s “vision” is for a New Zealand where there is a net return of New Zealanders (after 50-60 years of trend (often large) outflows), because they can have a “better life” here and aren’t driven to move abroad by the lure of “higher incomes” there. His “vision” seems to be that economic growth in New Zealand over the next 16 years will be so strong that we’ll have matched – perhaps even exceeded – what is on offer abroad. As we all know, by far the largest net outflow of New Zealanders is to Australia. The “vision” seems to be to catch Australia.

Wouldn’t that be great? Australia is far from being a leading-edge economy but it is the easiest exit option for most New Zealanders, and has done much better than New Zealand for decades now. For those who are into trans-Tasman rivalries, it must be quite embarrassing for our country to have done so much worse than them, when for many decades we pretty much level-pegged.

As for the PM, he reminded us of his firm focus (“resolutely and unapologetically”) on “delivery”

So having set out a bold vision what is the Prime Minister offering as a policy programme to achieve it? It isn’t, after all, a small ambition. (By my reckoning, using IMF data, catching Australia’s GDP per capita by 2040 would require New Zealand’s per capita real growth rate to exceed Australia’s by about 1.45 percentage points each and every on average for 17 years – so if Australia managed 1 per cent average per capita real GDP growth, we’d have to average almost 2.5 per cent year in year out. Over the last 17 years we’ve managed about 1 per cent per capita real growth.)

The Prime Minister does lay out some substance on the early days

Personally, I’d give a tick to almost all those (but not too keen on allowing small panels of Cabinet ministers to decide which private sector projects get favoured treatment). It is mostly good stuff. But to a first approximation what it mostly does is undo stuff the previous government did and restore something like the policy set of 2017. But if productivity growth in the years up to 2017 was less bad than it has been here – and in Australia and Canada – more recently, we weren’t making any progress then either in closing gaps to the rest of the advanced world. And where it is still mostly prospective (“charting out a course of systematic RMA reform”), it is welcome, and sounds good, but…..we’ve heard lines about fixing the RMA before, including from the previous National government.

And that was sort of the problem with the entire economic strand of his 2040 vision. It brought to mind this

I hadn’t previously noticed the transition from “concrete goal” to “vision”, but whatever the language, it all made no difference whatsoever.

The Taskforce that was set up to advise on meeting the 2025 goal noted at the start of its first report that there had been a lot of talk over the years.

(I don’t suppose the Taskforce really believed that last couple of sentences, but…..the Prime Minister himself had been party to setting a “concrete goal” so he might as well be treated as taking it seriously.)

Of course, it all came to nothing and nothing about the goal (whether “concrete goal” or “vision”) was achieved. (I had some part in assisting the 2025 Taskforce, but the substantive issue is not the Taskforce, but the goal – which is what would greatly have benefited New Zealanders had it been seriously pursued. It wasn’t.)

Here is the summary chart, comparing GDP per capita (in PPP terms) between the two countries since 2007 (just prior to the severe recession on 2008/09). There are two different measures, but they both tell the story: no progress at all has been made in the intervening years to closing the gap in real GDP per capita to Australia.

In the short-term governments (government policy settings) can’t do much about the terms of trade, but generally Australia’s have been stronger than ours.

Productivity is more amenable to policy settings. If anything the gap has widened over the period covered by the original 2025 goal (these lines are indexed to a common value at the start of the period. Using annual OECD data, in PPP terms, the average level of labour productivity in Australia is about 28 per cent higher than that in New Zealand, larger than the gap in real GDP for capita (the latter also reflecting the higher employment rate in New Zealand).

Who knows if Mr Luxon is any more serious about his “vision” – laudable on its own terms – than John Key was about the 2025 goal. No doubt both of them would be quite happy if things happened to have turned out that way (wouldn’t we all) but Key and his government did nothing even close to being equal to the task to make it happen. There seems little basis – whether in PM’s speech, his campaigning last year, or anything about what his government is and isn’t doing now – for believing it will be any different this time. Most likely, it is just another positive-sounding rhetorical line that will disappear, even from prime ministerial speeches, almost as soon as it appeared.

It would be great to be proved wrong on that, because the people who pay the price of empty political aspirational rhetoric never matched by policy seriously equal to the task aren’t Prime Ministers, who eventually move on to gilded retirements, but the children and grandchildren of ordinary New Zealanders.

If, as he should be, the Prime Minister is serious about that aspiration of New Zealanders (net) coming home not just because mountains and beaches make it a nice place for many to live, but because economic performance means you don’t have to leave for a higher income, the concrete policies need to start matching the rhetoric. In the PM’s own words, delivery matters.

UPDATE: As if to reinforce my scepticism I came across this in a Stuff article

On the assumption that his answer has been fairly reported, really what can one say. It is just devoid of any substance whatever, and meanwhile his government in practice shows no sign of ending the corporate welfare handouts (which are what reinforce any sense of dependency, at least among the favoured firms).

Productivity growth: 4 Anglos

In my post last week on The Treasury’s recent note on productivity, I highlighted that the weak labour productivity growth evident in New Zealand over the last decade wasn’t something we’d shared with the OECD countries that were around our level of average productivity. This chart was from that post.

But as I also noted, it might have been worth Treasury having a look at Australia and Canada (richer and more productive than us, but with some important structural similarities, and neither in recent decades having been productivity growth star performers).

For many countries it is quite difficult to get whole-economy quarterly labour productivity data. But Australia, Canada and the UK publish such series, and I’ve done so for New Zealand (using the average of the two real GDP series and HLFS hours data). The data are all available to 2023Q4, although in all cases no doubt with the caveat of being subject to revision as fuller data emerge for the most recent periods.

First, a quick quiz. Which of the four Anglo countries do you think is which in this chart (I went back to end of 2015 to start from before the Brexit referendum)? Note that none of the lockdown period numbers are likely to be very reliable, and may just reflect differing assumptions the various statistical agencies made. But in all four countries, lockdowns are now well in the past.

The answer? And somewhat to my surprise…..best of a poorly performing bunch of countries over this eight year period was the UK, Brexit and all.

And how about the period since just prior to Covid (there is some noise in the quarterly data so I’ve used the 2019 average as the base)?

I’d usually highlight New Zealand in a different colour, but….it is hard to highlight (exceedingly close to) zero.

Given the potential for revisions I wouldn’t put much weight on it, but……for what the data are worth…..there is no reason to doubt that the recent productivity performances of New Zealand, Australia, and Canada have been rather similarly poor, and especially so since Covid.

It is worth making these comparisons for various reasons, but including because it is all too easy for partisans to highlight their own country’s experience, blaming everything on the rhetorical predilections and headline choices of whoever happens to have held office in this period. Over the full Covid period (in the chart just above), we had a Labour government, Canada had a government that seemed similarly “left wing”, but then for much of the period Australia had a centre-right Coalition government, and the UK…. has had the Tories (who sometimes appeared very similar to Ardern, but are notionally at least of the centre-right).

But lest you are tempted again by thought that everyone is just as bad as each other and global forces mean productivity growth was just impossible over this period, consider the US

They don’t produce whole-economy real GDP per hour worked data, and you’d expect the business sector to do better than the economy as a whole (ie including government). But I had look at how large the differences might be (using the annual US GDP per hour worked estimates from the OECD) and it is pretty clear that the US economy as a whole – an economy very much closer to the productivity frontier – has managed materially faster labour productivity growth over recent years than the 4 Anglos focused on in this post.

Countries can still manage robust productivity growth. Perhaps especially countries that are well behind the productivity frontier (see first chart in this post), but….apparently not with the policy mixes of the New Zealand, Australian, and Canadian governments.

The Treasury and productivity

Late last week The Treasury released a new 40 page report on “The productivity slowdown: implications for the Treasury’s forecasts and projections” (productivity forecasts and projections that is, rather than any possible fiscal implications – the latter will, I guess, be articulated in the Budget documents). In short, if (as it has) productivity growth has slowed down a lot then it makes sense not to rely on optimistic assumptions about rebounds in productivity growth based on not much more than hopeful thinking. Fortunately, “wouldn’t it be nice if productivity were to grow faster” does not seem to be The Treasury’s style.

It was a slightly puzzling document though. The global (frontier) productivity growth slowdown has been around for a couple of decades now, and so is hardly news. There isn’t much (if anything) new in what The Treasury writes about that. But there also isn’t much new on New Zealand, and although there are a few interesting charts in the paper, there is very little attempt to get behind them and think about the fundamental economic factors that might be influencing those trends in the data. As an example, we are told “increasing business R&D raises the prospect of productivity benefits”, but there is little sign of any analysis of what it is that leads firms to choose (or not) to undertaken R&D spending (or spending now classified as R&D) in New Zealand. Much the same goes for business investment more generally. The decline in foreign trade as a share of GDP is noted, but it seems to be treated as some sort of exogenous event that just happened, with no attempt to offer an economic (or economic policy) interpretation. More generally, it was striking that neither the nominal nor real exchange rate gets even a single mention in the entire document.

Treasury seems to have been at pains to point out that this 40 page paper wasn’t intended as a policy document, or to address at all the much bigger issue of the huge and decades-long gap between New Zealand’s average labour productivity and that leading and highly productive economies. But they are, as they like to boast, the government’s premier economic advisers. And although they refer readers to their recent Briefing for Incoming Ministers, suggesting that “The Treasury’s Briefing to the Incoming Finance Minister outlines the Treasury’s strategic advice on the opportunities to lift productivity”, it is thin pickings there too. I hadn’t previously read the BIM (low expectations of such documents these days) but when I checked it, the main substantive document amounted to fewer than 30 pages (including lots of charts and full page headers) covering all areas of policy. There was, I think, two pages on productivity. Perhaps they tailored their product to the perceived interest of the customer (few recent governments have shown any serious interest in addressing the productivity failure) or perhaps the premier economic advisory agency just had little of substance to say.

One of my favourite (if depressing) charts over the years has been this one (where tradables here is primary and manufacturing components of GDP plus exports of services). It is doubly depressing because when I first saw it – devised by a visiting IMF mission – was in about 2005, when per capita tradables output had only just started going sideways.

This increased inward-looking nature of the New Zealand economy – across successive governments – gets very little attention in The Treasury’s document.

But perhaps what struck me most – and prompted me to write this post – was the near-complete absence of any discussion about productivity performance in those advanced economies that weren’t at the frontier (there is plenty of international discussion about the frontier, since the countries concerned are the US and a bunch of EU countries) but were or are about New Zealand’s level of average productivity. In fact, I suspect the impression a casual reader would get from Treasury’s document is that everyone has experienced slower productivity growth together.

And that is really, at best, only part of the story.

I put this chart on Twitter a couple of weeks ago

These were the group of OECD countries that had moderately close average levels of labour productivity to that of New Zealand at either the start or the end of the period. The period itself was simply a round number: the most recent decade for which there is complete OECD data.

And New Zealand has done really badly over that decade, so badly in fact that of these far-from-frontier economies, only Greece did worse than New Zealand. And these were all countries that, being far from the frontier, had – in principle – significant catch-up or convergence opportunities. More than a few of them realised those opportunities. New Zealand languished.

(Nor is there any mention/discussion of how the experience of Australia and Canada – both richer than us, but otherwise with some similarities around policy experiments and economic structures – have also had woefully bad productivity performance in the last five or so years. Perhaps there are lessons to be learned, insights to be gained?)

I’m not really sure what The Treasury’s purpose was in writing and publishing the productivity document was. But we – and I include ministers here – deserve better from the government’s premier economic advisory agency. The government having – sensibly in the circumstances – scrapped the Productivity Commission, we really need more than ever a high-performing Treasury. It isn’t obvious that we have one, or that it is being led by someone with the interest in or capacity to deliver excellence. Her term expires shortly

Tougher than that

Thomas Coughlan has a column in the Herald this morning, under the heading “Nicola Willis is just the right amount of Tory”. To this centre-right voter it isn’t obvious Willis is (or sees herself) as any type of Tory, but what Coughlan seems to be suggesting is she is just right if the aim is to hold office, and never mind the large structural fiscal deficit the government inherited from Labour.

It isn’t an uninteresting column, and this post is just about one snippet where I don’t think the author is quite right. Here it is

The simple maths looks about right: $3.5 billion is 25 per cent higher than $2.8 billion and the CPI has increased by about 25 per cent since Budget 2018 (depends a little on your precise reference point). But that isn’t the right way to look at things: it misunderstands how the operating allowances work. And it doesn’t come even close to meaning that Willis is splashing the cash just like Grant Robertson was doing in his first Budget.

There are two things Coughlan seems to have overlooked. First, a big part of what the operating allowances cover is cost pressures on existing government spending programmes. Some increases, eg to welfare benefit rates, are done automatically by statute, and so don’t count against the operating allowance. But most other things do – new programmes of course, but also many of the spending implications of population growth (very rapid at present) and general inflation.

One way of looking at this is to compare the two operating allowances (2018 and 2023) with the total government (core Crown) operating expenses in the year just ending at the time of each Budget.

Grant Robertson gave himself an operating allowance of $2.8 billion in 2018 against an estimated final level of operating spending then for the year to June 2018 of $81.7 billion (3.5 per cent of that spending). Willis by contrast talks of an operating allowance of (probably just under) $3.5 billion against estimated (at HYEFU) spending in the year to June 2024 of $140.3 billion (or 2.5 per cent of that total). National was very vocal about the increases in spending under Robertson, but they went into the campaign not promising to get rid of many programmes (and needing most of their spending savings to finance promised tax cuts). The programmes still cost, inflation is still a thing, and the population keeps growing.

But this year’s story is even tighter than that simple comparison might suggest. Inflation is not something under control of the Minister of Finance – we have the autonomous Reserve Bank for that – and so from any one year’s Budget perspective inflation (as forecast by Treasury) is just one of those things the Minister of Finance is stuck with. In the early 2010s, one thing that made Bill English’s zero operating allowances less extreme than they might have seemed was that inflation was very very (and surprisingly) low. In the 2018 Budget – Robertson’s first – Treasury forecast CPI inflation for the year to June 2019 at a mere 1.5 per cent. By contrast, at least in the HYEFU the Treasury forecast for inflation in the year to June 2025 was 2.5 per cent (and in the BPS last week that forecast was still 2.2 per cent). Willis faces more cost pressures just from inflation than Robertson did in his first year, and that chews up not inconsiderable amounts of the operating allowance.

So it seems quite unlikely that the room she has given herself (all nominal) will do anything close to justifying Coughlan’s claim that this Budget will be “one of the more generous right wing Governments in New Zealand history”. Core Crown expenses as a share of GDP will almost certainly be dropping.

I’m no fan of this government’s fiscal policy – and the apparent indifference to the deficit, and the spooky scare stories about not being Ruth Richardson or Tony Abbott (both mentioned in the article) – but on the numbers the minister has given herself and the general inflation pressure Treasury is forecasting it hardly looks like being all that generous, even by National Party standards (one could make a case for not in effect being that much different than Steven Joyce’s Budget in 2017). That is neither surprising nor inappropriate coming off the back of six years of very large increases in government spending. And after all in 2018 (fairly or not) Robertson and Ardern were banging on about making up for “9 years of underfunding”, a very different narrative to Willis’s now. But the big difference from Steven Joyce in 2017 is that he was running surpluses, and Luxon/Willis apparently are content to keep running deficits.

But….there is the nagging question of what specifically are ministers deciding they don’t want to spend money on that Labour was spending it on (over and above the savings they are now exacting from departments, but on which the promised tax cuts have first claim). We don’t know. Do they?

Not very bothered by deficits

I was away last week so have been rather late in getting to the Budget Policy Statement and associated material released last Wednesday. It does not make for pleasant reading, at least if one cares at all about governments not borrowing to pay for the groceries.

Once upon a time – still not that long ago – New Zealand had a fairly enviable fiscal record. This chart, comparing New Zealand and the median advanced country, draws from data published in the IMF’s last World Economic Outlook

We used to have smaller deficits or larger surpluses than the typical other advanced countries (consistent with that our net public debt as a share of GDP was materially lower than the median advanced country). But no longer.

Using data from the same WEO (which, incidentally, was published before our election in October), on the IMF’s estimates we had one of the very largest structural fiscal deficits of any of the advanced countries.

Structural deficits – by definition – do not go away of their own accord as the cyclical position of the economy improves. They are removed only by conscious and deliberate choices by governments, and – by the same token – if they are left to linger that is a conscious and deliberate choice by a government.

There wasn’t even a hint of this starting position in any of the material released last week (although they did mention an international comparison of the increase in net debt over the Covid period). And consistent with that, there is very little about eliminating the structural deficit or getting back to operating balance/surplus. In her BPS the Minister outlines several priorities for the coming Budget, but none of them involves any priority or emphasis on getting the structural deficit down. The current government inherited the deficit, but if they choose to continue to run structural deficits – which aren’t about the cyclical state of the economy – the responsibility is on them, quite as much as it was on their predecessors when they chose to continue to run structural deficits once the heavy Covid spending was behind them. If it was pretty irresponsible then, it isn’t much better now.

Consistent with this overall approach, the Prime Minister has this morning released an “action plan” for the next three months, a period which includes the Budget. There is not even a vague suggestion in that list that closing the deficit is any sort of priority for the government.

Under the previous government the forecast date for a return to surplus kept getting pushed back. And this government now seems to be engaged in the same game – the fiscal version of the old line from St Augustine (“grant me chastity and continence but not yet”) – and whatever numbers finally emerge in the Budget projections should probably be accorded no more weight than when the Treasury produced (eventual) surplus forecasts under Labour. It might be nice to be back to surplus by whatever the next published horizon is but….don’t hold us to it. Much more important to keep funding the baubles that both Labour and National competed to offer last year.

Much of the Minister of Finance’s rhetoric in recent months has seem designed to convey a sense that structural deficits are things that just happen and that ministers can affect only at the margin. That wasn’t so under Labour – when Grant Robertson chose to run substantial structural deficits – and it is no more so under the current government. It is simply a policy choice, and a bad one, especially when there is no particular besetting crisis. She talks about the difficulty on the projections of getting back to surplus by a particular date, but the issue isn’t projections – especially when the economy operates fairly close to capacity – but choices, political choices. It might be particularly challenging for a government to take the budget from substantial deficit to balance in its first year, but over a two or three year horizon it really is pure choice. If we still run structural deficits by, say, 2025/26 that is purely a policy choice by the current government, for which responsibility will rest wholly on them.

The Minister appears to attempt to cover herself from this sort of critique using this line, which I saw twice in the documents she released: “International evidence is that reducing deficits is best done over the course of several years by focusing on structural reforms to expenditure and revenue settings”.

Which might sound good but (a) there are no footnotes or references to support this claim of “international evidence”, and (b) there isn’t anything much specific about these “structural reforms” (at present the focus of fiscal policy seems to be on finding enough spending savings to fund tax cuts and other giveaways, rather than on a actually reducing the deficit). I’m rather sceptical of the claim. It might have a little merit in an economy in a deep recession with monetary policy constrained by the effective lower bound on nominal interest rates, but…..that very much isn’t the world New Zealand fiscal authorities now face. Instead, the line just feels like an unsupported excuse for a few more years of deficits (“they had them so why shouldn’t we?”).

The Minister has also been making quite a play of a story that it has all gotten so much harder than she had envisaged because the economy has been deteriorating. At present, that seems a dramatically overblown story, designed to distract more than to enlighten.

Much is made of the revisions downwards late last year in the level of real GDP (and thus the level of labour productivity). But that is mostly distraction, because before those numbers came out Treasury and IRD already knew how much tax revenue the economy had been generating, all they didn’t know was the latest macroeconomic estimates of the size of GDP itself. That matters for, eg, nice charts of tax/GDP ratios but not very obviously for making sense of the fiscal situation and its challenges.

Some weeks ago I showed this graph on Twitter, showing the Reserve Bank’s latest nominal GDP forecasts against those the Bank produced in August last year (ie the last projections before the election).

The Reserve Bank reckoned in February that if anything nominal GDP would be a little higher than they’d thought just prior to the election. And while nominal GDP tends not to be a big point of focus for the RB in putting together its forecasts, the Secretary to the Treasury (or her senior delegate) does actually sit on the MPC.

What about real GDP? Well, as we know, there were some downward revisions to the historical data, so in this chart we will focus on forecast real GDP growth, using as the base date the March quarter of last year (the latest actual data the RB had when it did its last pre-election projections)

Those are pretty tiny differences. And, after all, the Reserve Bank had been telling everyone – including the then Opposition – that the economy was going through a tough patch as part of getting inflation back down.

Among the material released last week was a four page Treasury note on the economic and tax outlook. It contains some preliminary high level forecasts, but can’t be directly lined up against the Reserve Bank numbers because there is no quarterly track for nominal GDP (the best proxy for the tax base). It appears from Treasury’s annual forecasts that they are running with a lower nominal GDP track than the Reserve Bank has (perhaps by around 2 per cent), although it isn’t clear quite why (and although the documents note a revision downwards in inflation forecasts, the Treasury inflation forecasts for the first year or so still seem higher than those of the Reserve Bank).

In terms of spinning a story around the deficit this is perhaps the paragraph the Minister will have been most keen to have readers pay attention to.

You are meant to take away from this that it is going to be so much harder than the current government had thought last year when they were in Opposition, to get back to balance by 2026/27 (recall, a date already pushed out under Labour). But there are a few crucial words in that excerpt: “all else equal”.

And they aren’t (of course). When the size of the nominal economy is smaller than previously expected – but still operating at around capacity (and the Treasury preliminary forecasts have unemployment by 2025/26 and beyond around their estimate of the NAIRU) – it isn’t just revenue projections that need to change. So will many spending obligations – both statutory things like indexed benefits (remember, Treasury has revised down its inflation forecasts since late last year) but also expected wage inflation (in the private sector but also in the public sector). Economies with a dreadful productivity growth record – and the productivity assumptions in these forecasts seem likely to be very weak indeed – tend not to support large wage increases. Of course, there are other items in government spending where there are no semi-automatic savings, but the weak productivity story doesn’t seem to be just a New Zealand phenomenon at present. (More generally, of course, all medium-term economic forecasts – RB, Treasury, IMF, or whoever – are subject to huge margins of error, and not worth a lot more than the paper they are printed on.

Being in surplus two to three years hence (or not) is purely a political policy choice. Not to be is a bad choice. (Of course, in the meantime some really bad event could hit – earthquakes, deep global recessions or whatever – but since no one can or does pick the timing of those we can worry about them when and if they hit. At the moment, planning proceeds on the basis of an economy developing fairly routinely (if underwhelmingly).

I’m old enough to remember when a National government and Minister of Finance first got New Zealand back to operating surplus in the mid 1990s. I’ve told stories about what seemed to have been bipartisan commitment to get back to surplus fairly promptly when occasional nasty shocks happened (although in truth it was really tested only once). It is disheartening now to see little sign that National (and their coalition government) is any more bothered about deficits – borrowing to pay for the groceries – than their Labour predecessors were. (The new debt target enunciated in the BPS is no more encouraging, with the new government seemingly willing to settle for higher levels of (net) debt than New Zealand has averaged over the last 25 years, with no evidence of strong potential productivity growth that might compellingly justify such debt.)

UPDATE: Incidentally, I saw in the weekend papers (page 3 of Saturday’s Post) one academic economist defending the government’s fiscal approach as classic supply-side economics. I don’t find that claim at all persuasive. There are certainly elements in the fiscal grab-bag that might fit that bill (one could think of restoring interest deductibility to rental property owners, on the same basis as any other business in New Zealand). In the abstract, lower income tax rates might, were it not for the fact the starting position is one of a deficit. Savings from cuts to spending can be used to cut the deficit or for tax cuts, but tax cuts today with a structural deficit – all else equal – just mean either further cuts to spending or higher taxes in the future. And some of National’s policies are distinctly retrograde even with a supply-side focus in mind – one could think, for example, of the policy both they and Labour campaigned on, the elimination of depreciation for tax purposes in respect of commercial buildings (office, factories, warehouses). Simply a freshly distortionary revenue grab. And meanwhile we run one of the highest company tax rates in the OECD with not even a suggestion the government is interested in addressing that.

A government agency planning more nice-to-haves

Almost all government agencies are in cost-cutting mode at present, under instructions from the incoming government. All sorts of things they, or the previous government, thought were nice to have and some things perhaps they thought were really rather useful indeed seem to be going by the wayside.

But at the Reserve Bank they are planning a new nice-to-have.

The Bank has a consultation process open at present on a proposal to “invest in” (that is public sector for “spend”) a new survey of business people, asking about their specific numerical expectations for a subset of macroeconomic variables. What is striking, in this climate of general public sector austerity, is the utter absence of any analysis of what gaps this survey is designed to fill and how material they might be for monetary policymakers. That was one thing in the era of bloat and lavish increases in public spending – in which the Bank fully participated over the last few years – but it really shouldn’t be acceptable at present.

On the substance, I’m sceptical of asking specific numerical questions to a wide range of businesses about specific macroeconomic variables (up, down, or the same questions just might be useful) and of whether there are really information gaps at all. I put in a fairly short submission, as follows:

Submission to the Reserve Bank on proposed Business Expectations Survey

Michael Reddell

23 March 2024

This is my personal submission in response to the Reserve Bank’s consultation document on the proposed Business Expectations Survey.  I have been a long-term user of business and household surveys, was involved in various refinement to the existing (and now) expert survey of expectations the Bank runs, and was a user of such material for several decades as a senior monetary policy adviser in the (former) OCR Advisory Group.   I am now also a monetary policymaker in another country, so am very much attuned to the perspectives and interests of policymakers.

There appears to be no prior background document referred to, so I am working on the assumption that the current document is all the information/analysis that the Bank is choosing to provide.

On that basis, it is quite astonishing that there is no analysis of the case for (or against) a survey of the sort the Reserve Bank proposes to spend additional public money on.   As you will be well aware, there is a plethora of surveys in existence (which wasn’t the case several decades ago), including the monthly ANZBO, the monthly BNZ PMI and PSI, the quarterly QSBO, and of course the Bank’s own survey of (now) expert expectations –  to name just the more-prominent of the business surveys.   The Bank used to be a large funder of the QSBO, and I assume that that is still the case  (and I used to, and would still, champion the case for some slight extensions to the QSBO, notably around wages).

The survey you propose is of a subset of macroeconomic variables.  You will no doubt be aware that the existing Survey of Expectations began with a much larger range of respondents, including business and union people, and was eventually slimmed down towards its current form in part as it was realised that many of the business respondents had no particular reason to have formed specific expectations for many macroeconomic variables, or even in some case to be aware of the specific measures being asked about.   I am aware, of course, that your current proposal is for a more-limited subset of questions, and in the case of near-term inflation it is a fairly commonly asked question even of households.  But do you really believe that many business respondents are likely to have well-developed thoughts on what the inflation rate might be in 10 years’ time (or even that they have risen or need to have even implicit views given that very few nominal contracts exist)?  Similarly, how many of your respondents will be familiar with the details of the specific wage series you ask about, or will recognise a difference between annual GDP growth and annual average GDP growth (let alone know the numbers).  

It is much more common for surveys of the wider business community to use tendency questions and focus reporting on net balance results.  Absent any compelling analysis or evidence from abroad, I’d have thought that was likely to be a much better way to go, if you really believe there is value to the MPC in yet another business survey (typical targeted respondents seem much more likely to have some sense as to whether growth or wage inflation might speed up or slow down over the period ahead than to have meaningful numerical expectations.  In respect of labour market slack existing questions in other survey (“difficulty of finding labour”) seem to cover the ground these sorts of respondents could typically generally offer (few will, by contrast, have particular to care what the specific HLFS definition of unemployment is).

But, more generally, where is the evidence of gaps in the (survey) data that the MPC needs to make good monetary policy?   This is posed as a serious question.  I’m not aware of such gaps, but perhaps you are and could have elaborated on this point for submitters.  Material monetary policy mistakes have (and no doubt will again, in the nature of imperfect individuals and institutions) be made, but is there really any evidence that it is (a subset of) business expectations of macroeconomic variables that is lacking, or which led the MPC astray in the last few year?  I’d be surprised, but am certainly open to evidence.

It was perhaps surprising that there was no indication in the consultation document of the cost of (a) developing and (b) administering the proposed survey, which makes it even more difficult to assess whether it is plausible that there will be net benefit for taxpayers (as ultimate funders of the Bank).

On a couple of specific items in your document:

  • It was rather surprising to see several references to “respondent burden”, including to justify leaving out very small businesses from the possible sample base.   It is a highly relevant consideration when the state uses the coercive powers SNZ in particular has to insist on private firms and citizens completing surveys, but as you note this proposed survey will be quite as voluntary as any of the other business surveys, and it isn’t obvious that –  to the extent you are likely to get any useful data from this survey – businesses with 5 employees will have anything less to offer than those with (say) 15, again bearing in mind that it is macroeconomic variables you are asking about.  Moreover, since you propose to revolve the panel, no one potential respondent would be asked for response all that often or for that long.    More generally, I note the very low response rate you expect (“10-20%”) and given the severe selection bias that probably introduces one is again left wondering about the strength of the case for the survey at all.
  • I’m also unpersuaded by the (very sketchy) case made for the exclusion of primary industry firms.  It might be common to exclude such firms, but (as you recognise) this is an economy in which the primary sector is of some considerable importance, and (again) these are macroeconomic questions you are proposing to ask, and it isn’t obvious why primary industry respondents would be any less equipped to answer such questions than other firms their size. I note that you say that primary industry firms are not generally price-setters, but it is a galaxy of macro questions you are proposing to ask, not ones about price-setting intentions (and primary sector firms employ, borrow, fx hedge (or not), and so on).

Finally, and while I recognise that the Reserve Bank’s current funding agreement does not run out until next year, in the current climate in which government agencies pretty much across the board are being expected to exercise considerable spending restraint, often cutting established functions and activities, it seems extraordinary (but consistent with a longstanding culture of Reserve Bank exceptionalism –  and yes, I used to share and even champion it) for the Bank to be proposing a new ongoing spending commitment on what is, at best, a nice-to-have, supported by no serious underlying analysis of the need for this new survey, or even of the Bank’s ability to continue to fund it (against other priority claims) if and when the Minister of Finance finally catches up with the Bank and adjusts its authorised spending levels.