In the government’s Budget, the Treasury projects that on current policies the government will be running an operating deficit for six straight years (while in the 7th the surplus is so tiny that even if it were not for Eric Crampton’s point about tobacco excise revenue we might as well just call it a coin toss as to whether, if the economy played out as Treasury projects we’d see a surplus or a deficit that year).
People have from time to time pointed out that under the previous National government there was also a spell of six straight years of deficits. In fact, here is a chart. The blue lines shows actual fiscal balances from the last surplus (year to June 2008) to the first surplus again (year to June 2015), while the orange line shows actual and Treasury forecasts from the year to June 2019 (last surplus) to the first (tiny) projected surplus (year to June 2026)
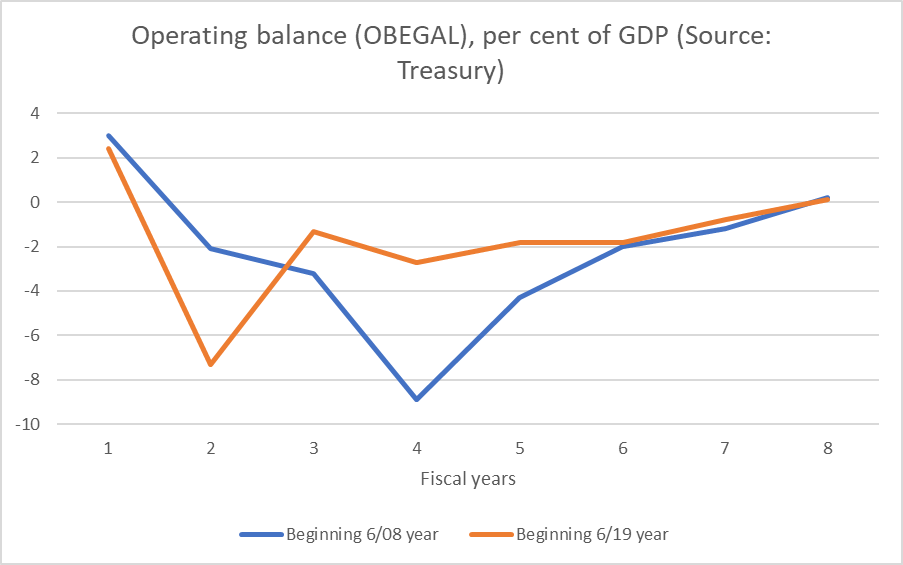
In each period, there was one really really large deficit year. In the earlier period that was the year to June 2011, which captured much of the cost to the Crown resulting from the Canterbury earthquakes. In the more recent period, the peak deficit was the year to June 2020, the period encompassing the first and longest Covid lockdown (huge wage subsidy outlays and all).
If these forecasts come to pass we”ll have had an operating surplus (or balance) in five of the last seventeen years.
What about context? In both periods there was a very big exogenous event: earthquakes in the one period and Covid (lockdowns) in the other. Both were, almost necessarily, very expensive for the government. Few people have much problem with meeting many of the direct costs as fiscal obligations.
But….there was a really important difference between the two periods. In the first, the economy headed straight into a fairly deep recession (partly domestically-sourced – our inflation rate had got above the top of the target band – and partly the global downturn associated with the 2008 financial crisis. It was all aggravated by the fact that the 2008 Budget was very expansionary – and yes, that was extravagant and it was election year, but the Treasury advised them that such an approach would not push the budget into deficit over the forecast horizon. It wasn’t one of Treasury’s better calls.
By contrast, at the end of 2019, the unemployment rate was low and, notwithstanding the brief but severe interruption to output around the lockdowns, has mostly remained very low since. When there isn’t excess capacity in the economy, tax revenue tends to come flooding in.
Here is a comparative chart of the unemployment rates in the two periods.
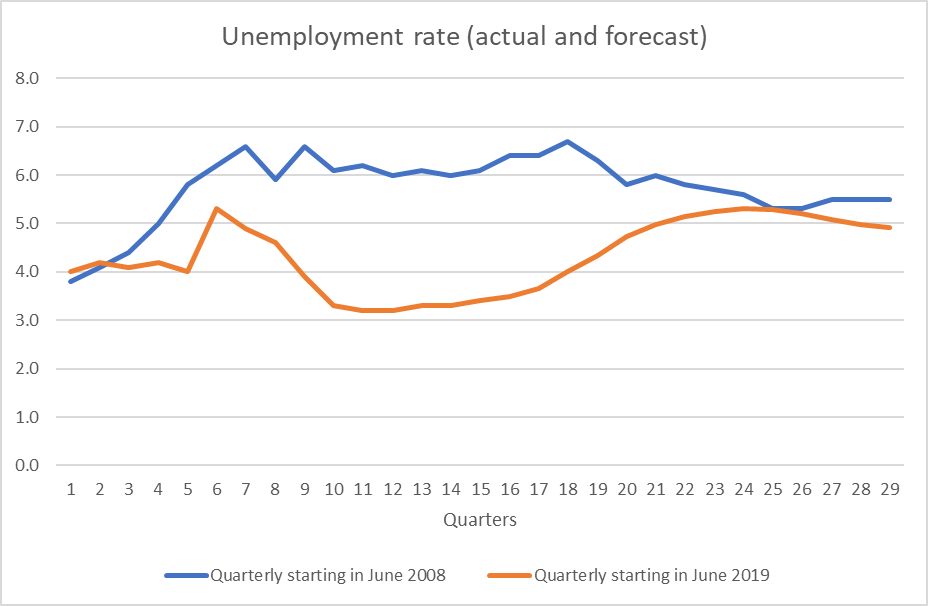
That difference in the unemployment rates makes quite a big difference to the fiscal outcomes, for any set of spending choices. You might criticise the previous government for doing nothing about a Reserve Bank that let unemployment linger well above the NAIRU for so long, as you might criticise the current government for doing nothing about a Reserve Bank that had the economy so overheated for so long. But the economic backdrops to those paths of fiscal deficits were simply very different: with an overheated economy and lots (and lots) of fiscal drag, the revenue was flooding into Treasury over recent years. There was simply no good macroeconomic reason for having operating fiscal deficits at all in an overheated economy, especially once the big direct Covid spending had come to an end (which it had a year ago). By contrast, the earlier government presided over a very sluggish recovery – and so weak, relative to target, was inflation that there was barely any fiscal drag. Even if the Budget was structurally balanced, cyclical factors would have left a small deficit (on Treasury and Reserve Bank numbers there was a negative output gap every year through to 2016).
If the unemployment rates and output gaps give a sense of the cyclical slack (or overheating), labour force participation rates are also valuable context
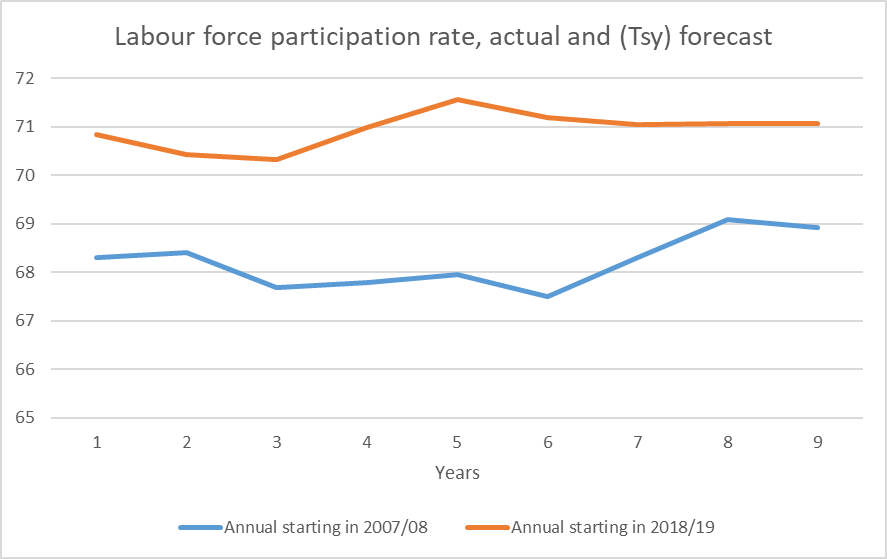
A materially larger share of the population is now in the labour force now than in the period of that previous run of deficits (and given that unemployment rates have been lower this time, the difference in employment rates is even larger. Revenue has been abundant.
I’m not really convinced there was an overly strong case for the previous government having continued to run operating deficits in the last couple of years of their stretch of six. Had the Reserve Bank been doing its job better, perhaps they wouldn’t have (the economy would have been more fully employed and inflation would have been nearer the target).
But I’m quite convinced there has been no good economic case at all for operating deficits in 22/23. 23/24, or 24/25. Take 22/23 (the year just ending) as an example: on Treasury estimates there has been a positive output gap, and the unemployment will have averaged about 3.5 per cent (well below anyone’s estimate of NAIRU). And with 6-7% inflation, fiscal drag has been a big revenue raiser. And if there has been any residual direct Covid spending (a few vaccinations?), the amounts involved must have been vestigial indeed. So cyclically the revenue was flooding in, but they still ran a deficit: it was pure choice to undertake routine operational spending without the honesty to go to the electorate and raise the taxes to pay for that spending.
The cyclical position is less favourable over the next couple of years – the recesssion (as indicated by the 2 percentage point rise in the unemployment rate) required to get inflation back down again – but the government has chosen to adopt discretionary new giveaways with borrowed money.
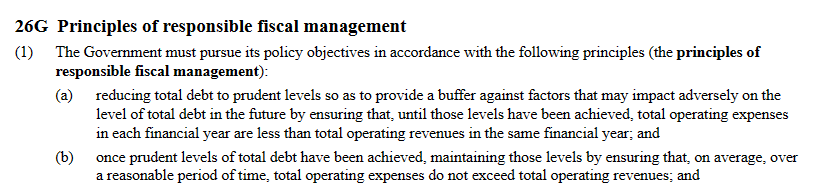
It isn’t just some idiosyncratic Reddell view that operating budgets should be balanced (none of this is about capital spending or arguments about infrastructure). It is there in the Public Finance Act
Now, if I was writing the Public Finance Act, I wouldn’t word things quite that way. But……the Public Finance Act is something both main parties have signed up to. It may make sense to borrow to fund useful longer-term investment, but it makes no sense to be borrowing to pay the groceries, especially in times when income has been more abundant than usual.
Just two more Budget charts. The first is one I showed on Twitter yesterday
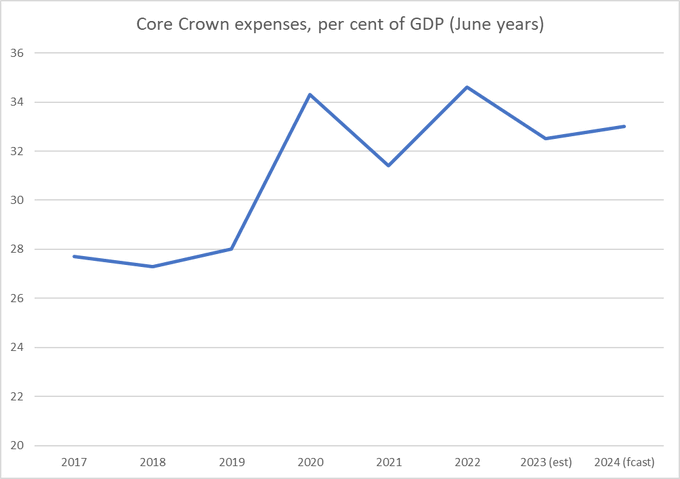
Now, there is plenty of scope for political argument about the appropriate size of government spending, and left-wing parties will typically be keener on higher numbers than right-wing parties. My own interest here is more about fiscal balances, but it is worth being conscious of just how much larger a share of the economy is now represented by Crown operating spending than was the case even five or six years ago. Those were the days of the pre-election Labour/Greens budget responsibility rules
Next year’s spending at 33 per cent of GDP is not quite at the previous peaks (Covid and the earthquake years) but nor might one really have expected it to be. But there is an election to win I guess.
And finally, inflation. Treasury doesn’t run monetary policy but (a) the Secretary sits as a non-voting MPC member, and (b) Treasury are the Minister’s advisers on the Bank’s performance, so they aren’t just any forecaster. On the Treasury numbers, it isn’t until the year to June 2027 that CPI inflation gets back to the middle of the target range (the 2 per cent midpoint the MPC is supposed to focus on).
This chart uses Treasury’s annual numbers to illustrate what a difference the monetary policy mistake has made, and is making, to the price level
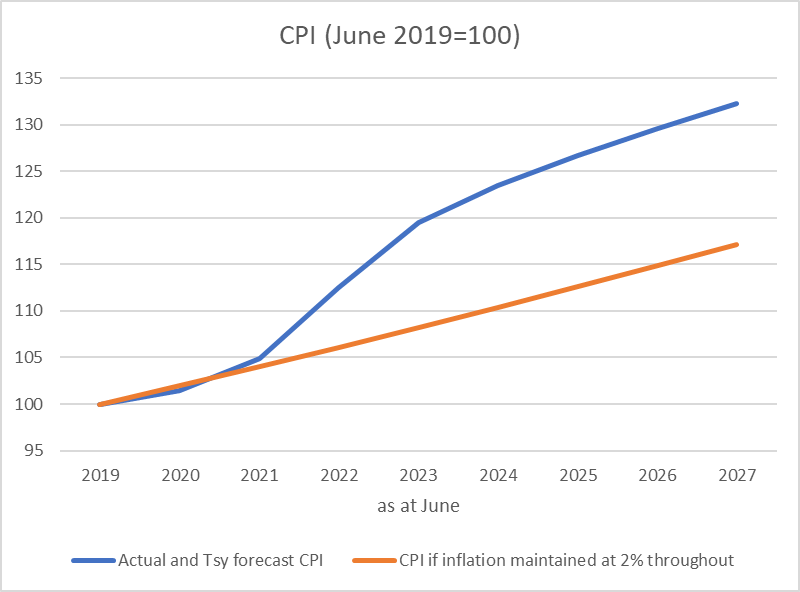
The blue line is the actual (annual) data and the Treasury forecasts. The orange line is what the price level would have looked like in a stylised scenario in which the MPC had delivered 2 per cent inflation each year over this period. The difference is substantial: the price level in the blue line is almost 13 per cent higher than in the orange line by the end of the period. The Minister of Finance appears to be quite happy for the current gap (about 10 per cent) to keep widening for the next five years. He shouldn’t be.
We do not run a price level targeting regime. That means bygones are treated as bygones and we don’t attempt to pull the actual inflation rate back down to the orange line having once made the policy mistake that pushed it so far above. It does not – or should not – mean indifference to the arbitrary redistributions that big unexpected changes in the price level impose, strongly favouring borrowers (especially those with nominal debt and long-term fixed interest rates) and heavily penalising financial savers (holders of real assets can be largely indifferent over time). Inflation – and especially unexpected inflation – is deeply damaging, and there were good reasons for reorienting monetary policy to deliver medium-term price stability. But now the powers that be appear unbothered by 7 years in succession of inflation above the target midpoint. It seems about on a par with being happy to set out to deliver six successive years of operating deficits. Poor fiscal policy, poor monetary policy, poor performance from both the Governor and MPC and the Minister of Finance (the latter not only having direct responsibility for fiscal policy, but overall responsibility for monetary policy and the people he appoints to conduct it). It will be interesting to compare the Reserve Bank (considerably more up to date) forecasts next week.
I’m going to be away for the next couple of weeks so there won’t be any new posts here until after King’s Birthday.
