There have been various posts here over the last couple of years about the losses to the taxpayer resulting from the Reserve Bank’s Large Scale Asset Purchase (LSAP) programme. Some of these have been more about explaining than excoriating (the latest such explanatory post is here).
As I noted in that most recent post, in the early days of the LSAP the line item on the Reserve Bank balance sheet for the claim on the Crown indemnity was a rough but reasonable estimate of the total losses, based on market prices as at the successive balance dates. It became an increasingly inadequate indicator as the LSAP programme started to be unwound, with the longest-dated bonds being sold back to Treasury, losses being realised, and payments being made from the Treasury to the Reserve Bank under the indemnity.
But the amounts of those indemnity payments were not being routinely disclosed (eg the RB does not publish a monthly income statement) and analysts were reduced to picking up snippets of information from OIAed documents. It wasn’t exactly transparent.
Anyway, in an OIA request to the Treasury and in a conversation with someone from the Bank I suggested it would be helpful if the monthly indemnity payment amounts by Treasury were to be routinely disclosed. That way, whatever debates we might want to have about the merits or otherwise of the LSAP programme, at least we would all be working with the same numbers.
And thus it has come to be, and this morning a new spreadsheet on the Bank’s website went live with monthly updates on payments and receipts under the LSAP indemnity. The link to it is about half-way down this page.
Here are the two components

Here is the Bank’s own description of the numbers in the blue line
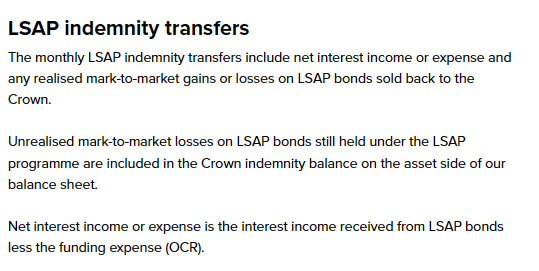
There were net transfers to Treasury for a while because the coupon rates the Reserve Bank was receiving were higher than the (OCR) funding cost.
And here is the chart showing total losses, realised and unrealised.
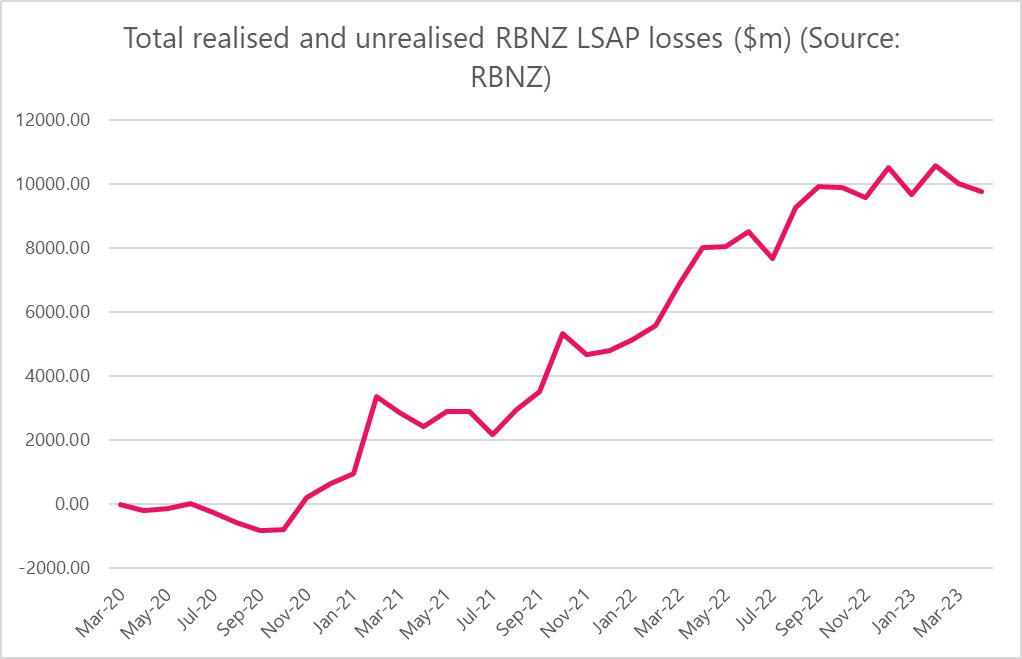
The total will keep fluctuating a bit from month to month as market rates change, but the variability will gradually diminish as (a) the size of the remaining LSAP portfolio continues to steadily shrink, and (b) the longest-dated bonds have been sold back first. But for at least the last eight months, something around $10bn in total losses has been the best (market price) guess.
There were two points to this post. The first was to use the new data to illustrate better than has been possible until now with hard numbers just what has happened with the LSAP gains and losses over time. And the second was to acknowledge the Bank and thank them for making the data available. The losses probably aren’t something the Bank is really comfortable with, but one shouldn’t be hiding from the hard numbers, and in publishing them regularly now the Bank apparently is not. And that is welcome.
$10 billion is, however, a lot of taxpayers’ money to have lost.

Tut Tut….a rare grammatical lapse, you’ve put the full stop in the wrong place:
“$10 billion is, however, a lot of taxpayers’ money to have lost, for no “net benefit”.
…there, fixed it for you.
LikeLike
And here I was, for a few hours anyway, trying to be minimally argumentative……
LikeLike
[…] to fail (systemically important). Recently, the RBNZ engaged in large-scale asset purchases, which resulted in billion-dollar losses and appeared to primarily benefit foreign-owned […]
LikeLike
Michael any further up date on Lsap loses please .
I tried to look for that graph on rbnz website but no luck.
Need the figures if possible for petition appllication.
LikeLike
Another well formulated informative article.
Thank you.
I was wondering if you had up to date figures on the lsap loss figures please.
I checked the rbnz website but could not find the graph.
Many thanks Finlay
LikeLike