Here is a chart of current 10 year (nominal) government bond yields for a selection of advanced economies

The median yield across those bonds/countries is about 0.4 per cent. For two of the three largest economies, long-term yields are negative. Only Greece – which defaulted (or had its debt written down) only a few years ago and still has a huge load of debt – is yielding (just over) 2 per cent, closely followed by highly-indebted Italy, which could be the epicentre of the next euro-area crisis.
Of course, you can still find higher (nominal) yields in other countries – on the table I drew these yields from, Brazil, Mexico and India were each around 7 per cent – but for your typical advanced country, nominal interest rates are now very low. One could show a similar chart for policy rates: the US policy rate is around 2 per cent, but that is now materially higher than the policy rates applying in every other country on the chart.
For a long time there was a narrative – perhaps especially relevant in New Zealand – about lower interest rates being some sort of return to more normal levels. Plenty of people can still remember the (brief) period in the late 1980s when term deposit rates were 18 per cent, and floating first mortgage rates were 20 per cent. Those were high rates even in real (inflation-adjusted) terms: the Reserve Bank’s survey of expectations then (1987) had medium-term inflation expectations at around 8 per cent.
Even almost a decade later, when low inflation had become an entrenched feature, 90 day bank bill rates (the main rate policy focused on then) peaked at around 10 per cent in mid 1996. And the newly-issued 20 year inflation indexed bonds peaked at 6.01 per cent (I recall an economist turned funds manager who regularly reminded me years afterwards of his prescience in buying at 6 per cent).
But 90 day bank bill rates are now a touch over 1 per cent, and a 21 year inflation-indexed bond was yielding 0.53 per cent (real) on Friday.
So, yes, interest rates were extraordinarily high for a fairly protracted period, and – once inflation was firmly under control – needed to fall a long way. But by any standards what we are seeing now is extraordinary, quite out of line with anything ever seen before, not just here but globally, not just in the last 50 or 100 years but in the last 4000.
A History of Interest Rates: 2000BC to the Present, by Sidney Homer (a partner at Salomon Brothers), was first published in 1963, and has been updated on various occasions since then (I have the 1977 edition in front of me). It is the standard reference work for anyone wanting information on interest rates from times past. It is, of course, rather light on time series for the first 3700 years or so, and it is western-focused (Sumeria, Babylon, Egypt, Greece, Roman and on via the rest of Europe to the wider world). But it is a wonderful resource. And you probably get the picture of the ancient world with this table – the individual numbers might be hard to read, but (a) none of them involves 1 per cent interest rates, and (b) none of them involves negative interest rates,
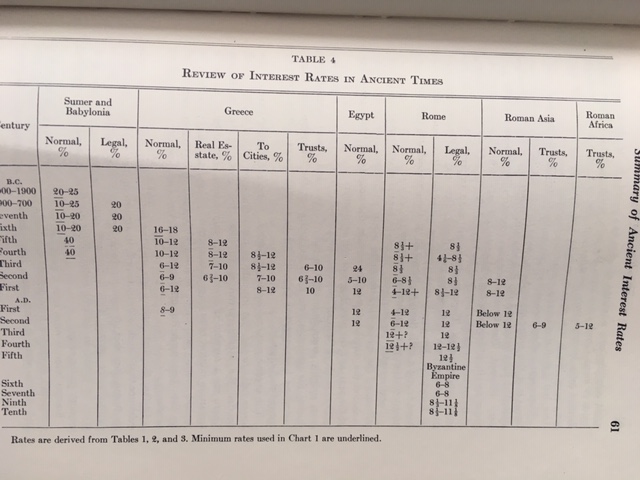
(This brief summary covers much of the same ground.)
All these are nominal interest rates. But, mostly, the distinction between nominal and real rates was one that made no difference. There were, at times, periods of inflation in the ancient world due to systematic currency debasement, and price levels rose and fell as economic conditions and commodity prices fluctuated, but the idea of a trend rise in the price level as something to be taken into account in assessing the general level of interest rates generally wasn’t a thing, in a world that didn’t use fiat money systems. In England for example, where researchers have constructed a very long-term retail price index series, the general level of prices in 1500 was about the same as that in 1300. In the 16th century – lots of political disruption and New World silver – English prices increased at an average of about 1 per cent per annum (“the great inflation” some may recall from studying Tudor history).
But what about the last few hundred years when economies and institutions begin to become more recognisably similar to our own? I included this chart in a post the other day (as you’ll see, the people who put it together also drew on Homer)

How about some specific rates?
Here is the Bank of England’s “policy” rate – key short-term rate is a better description for most of the period (more than 300 years).

And here is several hundred years of yields on UK government consols (perpetual bonds)

And here – from an old Goldman Sachs research paper I found wedged in my copy of Homer – US short-term rates

Harder to read, but just to make the point, a long-term chart of French yields

The lowest horizontal gridline is 3 per cent.
And, in case you were wondering about New Zealand, here is a chart from one of my earliest posts, comparing consol yields (see above) with those on NSW and New Zealand government debt for 20 years or so around the turn of the 20th century (through much of this period, the Australian economy was deeply depressed, following a severe financial crisis)
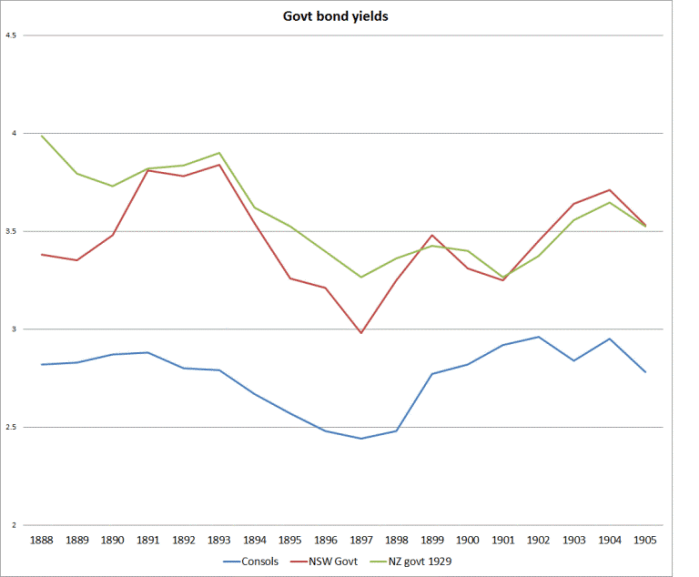
UK nominal yields briefly dipped below 2.5 per cent (and systematic inflation was so much not a thing that UK prices were a touch lower in 1914 than they had been in 1800). In an ex ante sense, nominal yields were real yields.
And in case you were wondering what non-government borrowers were paying, the New Zealand data on average interest rates on new mortgages starts in 1913: borrowers on average were paying 5.75 per cent (again, in a climate of no systematically-expected inflation). That may not seem so much higher than the 5.19 per cent the ANZ is offering today but (a) New Zealand rates are still quite high by global standards (UK tracker mortgages are under 3 per cent, and (b) the Reserve Bank keeps assuring us that inflation expectations here are around 2 per cent, not the zero that would have prevailed 100 years ago.
As a final chart for now, here is another one from the old Goldman Sachs research note
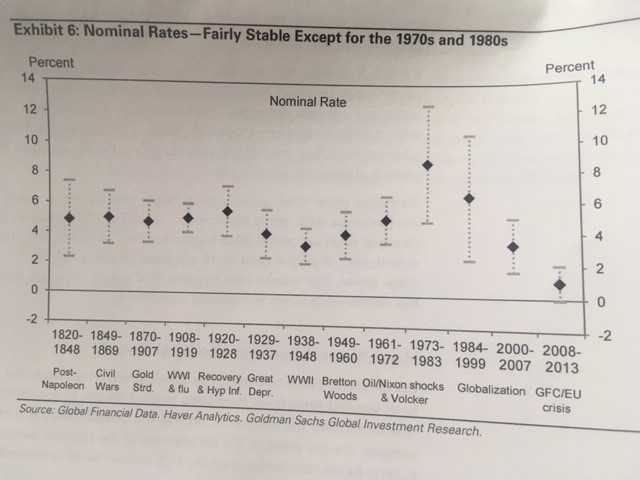
In this chart, the authors aggregated data on 20 countries. Through all the ups and downs of the 19th century and the first half of the 20th century – when expected inflation mostly wasn’t a thing – nominal interest rates across this wide range of countries averaged well above what we experience in almost every advanced country now.
Systematic inflation started to become more a feature after World War Two, but even then it took quite a while for people to become accustomed to the new reality. And in the United States, for example, as late as 1965 the price level wasn’t even quite double that of 1925 – the sharp falls in the price level in the early 1930s were still then a fresher memory than (say) the high inflation of late 1970s/early 1980s New Zealand is now. Here, Homer reports average New Zealand long-term bond yields of 3.74 per cent for the 1930s, 3.18 per cent for the 1940s, and 4.13 per cent for the 1950s (1.1 per cent this morning).
Partly as a result of financial repression (regulation etc) and partly because of a new, hard to comprehend, era, we went through periods when real interest rates were zero or negative in the period of high inflation – but, of course, nominal interest rates were always then quite high.
I’d thought all this was pretty well understood: not so much the causes, but the facts that nominal interest rates and expected real interest rates across the advanced world (now including New Zealand, even though our forward are still among the highest in the advanced world) are now extraordinarily low by any historical standard – going back not just hundreds, but thousands of years. Term mortgages rates in Switzerland, for example, are now under 1 per cent – and rates which have been low for years are, if anything, moving lower. And all of this when most advanced economies now have something reasonably close to full employment (NAIRU concept) and have exhausted most of their spare capacity.
It is an extraordinary development, and one for which central banks deserve very little of the credit or blame: real interest rates are real phenomena, about the willing supply of savings and the willing demand for (real) investment at any given interest rate. Across an increasingly wide range of countries more new savings (household, business, government) is available at any ‘normal’ interest rate than the willingness to invest at that ‘normal’ interest rate, and so actual rate settle materially lower. I don’t have a satisfactory integrated story for what is going on. Sure, there are cyclical factors at play – which together with “trade wars” – get the day to day headlines. But the noise around those simply masks the deeper underlying puzzle, about something that is going on in so many economies (it isn’t just that we all get given “the world rate”). No doubt demography is part of the story, perhaps declining productivity opportunities, perhaps change in the nature of business capital (needing less real resources, and less physical investment, and there must be other bits to the story. I find it very difficult to believe that where we are now can be the permanent new state of affairs – 5000 years of history, reflecting human institutions and human nature (including compensation for delaying consumption) looks as though it should count for something. But can we rule out this state of affairs lasting for another 20 or 30 years? I can’t see why not (especially when no one has a fully convincing story of quite what is going on).
Thus central banks have to operate on the basis of the world as they find it, not as they might (a) like it to be, or (b) think it must be in the longer-run. There is the old line in markets that the market can stay wrong longer than you can remain solvent, and a variant has to apply to central banks. For much of the last decade, central banks kept organising their thinking and actions around those old ‘normal’ interest rates and that, in part, contributed to the sluggish recovery in many places and the weak inflation we now experience (relative to official targets). They need now to recognise that where we are now isn’t just some sort of return to normal from the pre-inflation era, but that we are in uncharted territory.
My impression is that most central banks are still no more than halfway there. Most seem to recognise that something extraordinary is going on, even if there is a distinct lack of energy evident in (a) getting to the bottom of the story, and (b) shaping responses to prepare for the next serious economic downturn.
Late last week I had thought that the Reserve Bank of New Zealand had got the picture. Whatever one made of the specific 50 basis point cut – my view remains that 1 per cent was the right place to get to, but that doing it in one leap, without any obvious circumstances demanding urgency or any preparation of the ground, only created a lot of unnecessary angst – I was struck by the way the Governor talked repeatedly at the press conference of having to adjust to living in a very low interest rate world. As I noted in a post on Thursday, that was very welcome.
And so, when I saw what comes next, I could hardly believe it. I’d still like to discover that the Governor was misreported, because his reported comments seem so extraordinarily wrong and unexpectedly complacent. Over the weekend, I came across an account of the Governor’s appearance on Thursday before Parliament’s Finance and Expenditure Committee to talk about the Monetary Policy Statement and the interest rate decision. I can’t quote the record directly, but the account was from a source that I normally count on as highly reliable (many others rely on these accounts). The Governor was reported as suggesting although neutral interest rates had dropped to a very low level, that MPs should be not too concerned as we are now simply back to the levels seen prior to the decades of high inflation in the 1970s and 1980s.
I almost fell off my chair when I read that, and I still struggle to believe that the Governor really said what he is reported to have said. I’m not the Governor’s biggest fan – and he has never displayed any great interest in history – but surely, surely, he knows better than that? He, and/or his advisers, must know better than that, must know about the sorts of numbers and charts that (for example) I’ve shown earlier in this post.
I get the desire not to scare the horses in the short-term (though it might have been wise to have thought of that before surprising everyone with a 50 basis point cut not supported by his own forecasts), and I agree with him that an OCR of 1 per cent does not mean that conventional monetary policy is yet disabled: there is a way to go yet. But what we are seeing, globally and increasingly in New Zealand, is nothing at all like – in interest rate terms – what the world (or New Zealand) experienced prior to the 20th century’s great inflation. Real interest rates are astonishing low – and are expected to remain so in an increasing number of countries for an astonishing long period – and interest rates and credit play a more pervasive role in our societies and economies than was common in centuries past. We all should be very uneasy about quite what is going on, and in questions around how/whether it eventually ends.
And central banks – including our own – should be preparing for the next serious recession with rather more options than those they had to fall back on last time when nominal short-term interest rates then reached their limits. Those limits are almost entirely the creation of governments and central banks. They could, and should, be removed,and could be substantially alleviated quite quickly if central banks and governments had the will to confront the extraordinary position we are now in – late in a sluggish upswing that has run for almost a decade.
