When commenting a couple of weeks ago on the Reserve Bank’s Monetary Policy Statement I observed that
there was some rhetoric from the Governor at his press conference that I quite liked, including the reaffirmation of the effectiveness of monetary policy
I’ve not seen any reason to doubt that monetary policy remains pretty effective for now (although the lower limits of conventional monetary policy are approaching), and if I’ve had a criticism of the Bank over the decade it is that it has been too reluctant to use monetary policy as it should be, transfixed as they long were by outdated views on the level of neutral interest rates and a consequent view (shared by many of their peers abroad) that with interest rates this low, inflation would surely rebound soon. In short, central banks – ours included – materially overestimated the amount of monetary stimulus actually being provided.
In the wake of the Governor’s comments, I was interested to see that last Friday the Reserve Bank released a short Analytical Note reporting the work staff had done to underpin the Governor’s claim about effectiveness. It was good to see, both because public agency transparency is a good thing in itself, and because on several occasions in the past it has turned out that bold claims the Governor had made in press conferences were backed by precisely no supporting analysis.
The summary of the work done in the published note reads as follows
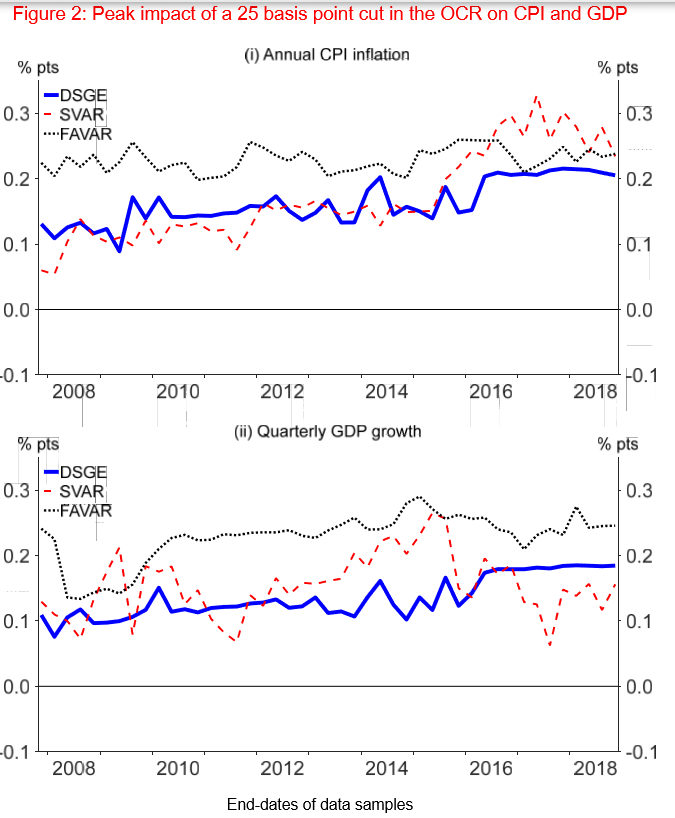
We use three different models to evaluate monetary policy transmission. These models show that a 25 basis point cut in the Official Cash Rate (OCR) leads to an increase in inflation and GDP growth, and that this response is as big today as it was before the GFC. This implies that the recent OCR cuts by the Reserve Bank will lead to – all else equal – higher inflation and GDP growth, and help support maximum sustainable employment (MSE).
Using data since 1993 they estimate models up to the end of 2007 and then add new data quarter by quarter and see if there are any changes in the estimated effect of a monetary policy change on inflation and GDP growth. The short answer – on these measures – is “not much”. Here is their chart.
In this exercise they are using the 90 day bill rate as the instrument of monetary policy (the OCR wasn’t introduced until 1999). And they recognise that you cannnot simply look at what happens after the 90 day bill rate changes, because the bill rate changes (or OCR changes now) are often reflective of stuff going on in the economy or inflation. Thus, in their words,
In order to disentangle the effect of monetary policy on the economy, our analysis uses modelling devices commonly known as monetary policy ‘shocks’. These shocks help isolate the effect of a move in the OCR that cannot be explained by the state of the economy.
Which is just fine, in principle, but then a great deal depends on how well the authors were able to identify the “shocks”. And we don’t know the answer to that, including because they don’t show us the data (which quarterly changes do the models treat as “shocks”, and to what extent).
The authors note only two limitations to their work. The first is the standard caveat: the models are linear and can’t easily cope with any non-linear behaviour. The second – really a ritual bow to their new statutory mandate – is that they chose not to look at labour market effects, but as they note employment changes are pretty closely correlated to GDP changes so it isn’t much of a limitation at all.
Much as I’m pleased to see the paper published, and am inclined to share the Bank’s judgement about policy effectiveness, I think there several other limitations or caveats that leave me not really that convinced that the reported model results are as persuasive as the Bank would like to believe.
The first caveat is that we simply don’t have much data for the more recent period. Here is a chart of short-term interest rates (data from the RB website) for the period being studied.

There was a great deal of volatility in the first six years of the period (pre-OCR), considerable variability in the subsequent decade, but since the crisis cuts came to end in April 2009, very little variability at all (from April 2009 to earlier this month the OCR had been in a range only 200 basis points wide). The two tightening cycles the Bank inaugurated both had to be reversed in pretty short-order, before anything like the full effects (on inflation and GDP) of those policy changes could be seen.
Now, as I understand these models, you don’t need to have had an OCR change to have had a “monetary policy shock”: sometimes the data will have changed and the OCR will have been left unchanged, and the model will tell you that there is a “shock” there – the OCR wasn’t changed when, in some sense, it perhaps should have been. But that isn’t really very helpful, since almost always when the policymakers left the OCR unchanged they had in mind unchanged policy (as did markets and firms/households), and the empirical exercise is trying to deduce answers from what the models think of as policy mistakes, but policymakers at the time did not. From a policymaker’s perspective, not much was done with monetary policy in the decade after 2009. With a small sample, you simply can’t answer many questions.
The other caveat is that the Bank’s modelling uses the 90 day bill rate (more recently as proxy for the OCR). That is fine – it is very close to the instrument the Bank has direct control over. But that isn’t the rate most people – firms or households – transact at. This chart shows the margins between the 90 day bill rate and the three retail rates for which the Bank publishes long time series.

For most of the pre-recession period – and particularly the first years of the OCR period – the margins were very stable. Through most of the 00s, you could look at monthly changes in floating mortgage rates, term deposit rates, business overdraft rates, the OCR, or 90 day bill rates and get almost exactly the same answer. In that environment, a simple model with only a single interest rate made a lot of sense. But the picture has been quite a bit different since then – not just the levels change in these spreads during the crisis period itself, but even in the subsequent decade. The OCR/90 day rate may still be a significant influence on the exchange rate – not something mentioned in the Bank’s paper at all – but changes in it (including estimated “shocks” to it) seem unlikely to mean the same thing in respect of domestic borrowing, investment etc, as it did in the pre-2008 decade.
To repeat, I’m inclined to agree with the Bank that monetary policy remains pretty effective. Perhaps what the Bank has done is the best that could be done for now. But I’m sceptical that these particular results should provide as much comfort as the Bank would appear to like us to take. The authors end the paper this way
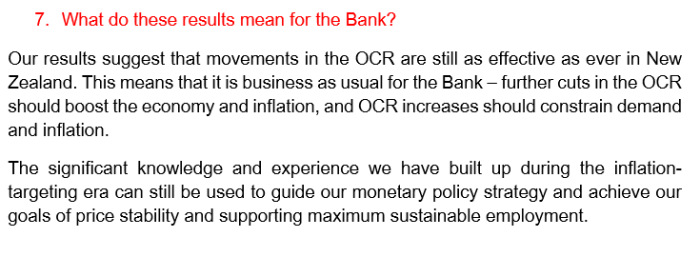
Which, frankly, seems a bit glib and over-confident. It is, after all, now almost a decade since core inflation was as high as 2 per cent – the target midpoint the Bank was charged to focus on. They might well be right about monetary policy being as effective as ever, but if I’d undershot my target for a decade I don’t think I’d be selling my wares under a “business as usual” slogan. The important distinction is that, quite probably, monetary policy is as effective as ever, but using it well depends on the Bank’s understanding of the inflationary processes (ie decent backwards analysis and forecasting). They didn’t do that very well for some considerable time. Whether things have now improved – moving on from “business as usual” – remains at very least an open question.
As it happens, this morning the Bank released the text of a short speech by Assistant Governor, Christian Hawkesby, which also touched briefly on some of these issues. He made reference to the research results in the Analytical Note (see above) but personally I found his less formal remarks resonated more:
Finally, it fits with recent experience that monetary policy does still have bite even in this low interest rate world.
In New Zealand, we lifted the Official Cash Rate by 100 basis points over the course of the first half of 2014 to head off an expected increase in inflationary pressure. When this did not arrive as expected, the tightening in monetary policy ended up being one factor that contributed to the slowing in the economy into 2015. Internationally, we have also seen the US Federal Reserve tighten monetary policy through to 2018, and this is one factor that has contributed to the moderation in US growth and inflationary pressure into 2019. These are ongoing examples of monetary policy continuing to play a key role in inflation dynamics.
To that, I would add the pick-up in New Zealand core inflation following the OCR cuts in 2015 and 2016.
I don’t want to say much else about Hawkesby’s speech, but there was some interesting commentary on the recent decision to cut the OCR by 50 points at once. The bits that really caught my eye were this
As part of the assessment, our discussion also touched on the decline that had occurred in both survey measures of inflation expectations and market-based measures, such as nominal and inflation linked bonds in global markets
This was new: there was no mention of expectations derived from indexed bonds in either the MPC minutes or in the MPS itself – in fact, in discussing inflation expectations over the last five or more years, Bank officials have steadfastly refused to engage with those market-based indicators (currently suggesting 10 year average inflation expectations of about 1 per cent for New Zealand). I hope this isn’t the only time they engage.
And (emphasis added)
A key part of the final consensus decision to cut the OCR by 50 basis points to 1.0 percent was that the larger initial monetary stimulus would best ensure the Committee continues to meet its inflation and employment objectives. In particular, it would demonstrate our ongoing commitment to ensure inflation increases to the mid-point of the target. This commitment would support a lift in inflation expectations and thus an eventual impact on actual inflation.
Which was interesting both because the Bank has spent considerable effort over the last couple of years telling us that inflation expectations were now just fine (“firmly anchored at 2 per cent” became something of a catchphrase). If you are using policy to try to lift inflation expectations – as they should be, among other things – it is a public acknowledgement that things were not quite as they should be.
I really hope that on this matter Hawkesby really is speaking for the MPC as a whole (there is no disclaimer on the speech suggesting they are just personal views). All else equal, if inflation expectations (survey and market measures) don’t rise, it would provide underpinning for further cuts to the OCR, whether or not the local or global economic data deteriorate from here.
