Skimming through the tweets of the chairman of the Productivity Commission – who often includes interesting charts – I spotted this picture.
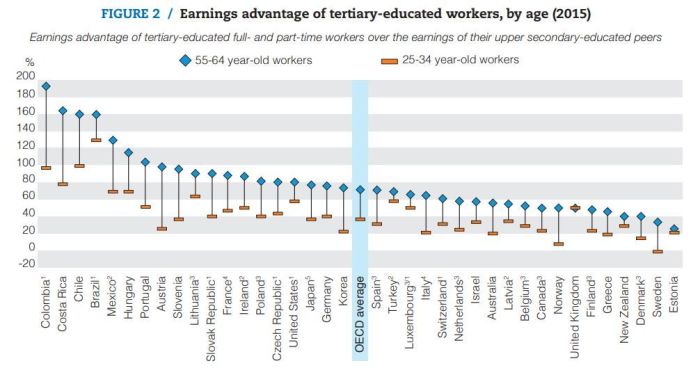
It is an interesting chart on a number of counts. First, in every country shown, except the UK, the earnings advantage to tertiary educated workers is higher – often materially so – for older workers than for younger ones. Second, all the countries at the far left of the chart are among the poorest of all those shown (the sample is OECD countries and “partner countries”). And thirdly, of course, that New Zealand is over towards the far right of the chart, where the earnings advantage to tertiary educated workers is pretty low (and especially so for older workers). The chart is drawn from this short OECD note.
Making sense of the numbers isn’t straightforward. First, note that the chart isn’t claiming to illustrate returns to tertiary education, but the earnings margin of people who have had a tertiary education over those who haven’t. The difference matters – people who undertake tertiary education are different, in various dimensions, to people who don’t. I’m in that older age group, and if I think back to my Auckland high school, only about 10 per cent of those who started in the third form made it to the seventh form. Most of them probably did go on to university, and perhaps a few others did tertiary study later, but it was a cohort that was much more intellectually capable, on average, than the other group. Since university was all but free to attend in those days, there weren’t even obvious financial barriers excluding capable people from poorer families.
These days, of course, a much larger share of young people undertake tertiary education. But that probably means that the intellectual capability of the median tertiary qualifed person today is lower relative to that of the population as a whole than was the case 40 years ago. It isn’t clear that is true if we compare the median of those with tertiary education and those without it (since the median of those without it is now likely to be quite a bit lower relative to that of the population as a whole).
Productivity performance in New Zealand has been poor for a long time, and we now start a long way behind the better-performing OECD countries. If there were a lot of really good opportunities here then all else equal, and given how far behind we start, I might have expected the returns to enchanced skills (not, of course, the same as having a tertiary education) to be higher here than in many other countries. The greater international mobility of people with better educational qualifications might have tended to work in the same direction.
But instead, those with tertiary educations aren’t doing well absolutely (low productivity country) or relative to those without. And so you are left wondering quite why immigration policy is oriented towards recruiting lots of “skilled” migrants – particularly those with New Zealand tertiary education – and why “education” policy is oriented towards encouraging yet larger proportions of people to undertake tertiary education. None of which prevent’s Treasury’s living standards dashboard – which we are told is going to help shape next year’s Budget – including the share of the population with a university degree of one of their “wellbeing indicators”.
(As far as I can tell, this particular chart also doesn’t taken of the fact that getting a tertiary education costs a lot of money – directly (fees and living costs) and indirectly (foregone time in the labour force) and thus, if anything, probably overstates the advantage held by the tertiary educated. There are other estimates of overall lifetime earnings advantages (or otherwise)).
