For several years now I’ve been complaining about the inadequacies of MBIE’s administrative immigration approvals data. It really should have been easy to have this data readily available (including in SNZ’s Infoshare platform) very quickly: we manage it, for example, for building approvals. But it hasn’t been.
For a long time, the public was supposed to be content with the annual Migration Trends and Outlook publication. It had a lot of interesting and useful data but (a) it was only available on an annual basis and (b) the lags were quite long. They also made available gigantic spreadsheets which might have been readily useable for those with programming skills or the right software, but for humbler analysts required a significant investment of time to extract the simplest numbers. And then those spreadsheets themselves were withdrawn – they discovered, belatedly, some privacy issues. They in turn were replaced with big PDF documents in small fonts where you could find some of the data updated each month, but still with an annual focus (thus they report year to date data, rather than monthly data).
There is progress afoot. MBIE has spent a lot of time and resource developing a Migration Trends Dashboard which will, when it finished, finally get us to the point of having timely, useable, monthly data, seasonally adjusted where appropriate. The sort of standard we’ve long expected for other major statistical series. I’ve been invited to a couple of consultation sessions with them as the product has been developed and although the dashboard has not yet been formally launched they’ve told me they have no problem if I run some graphs here from the dashboard. (Because it isn’t yet officially launched, and it doesn’t yet work with all browsers, I won’t link to the dashboard here, but if anyone really wants the link to have a play with the data, email me – address in the “About Michael Reddell’s blog” tab.)
This is the sort of thing that will be readily available: residence approvals by application stream.
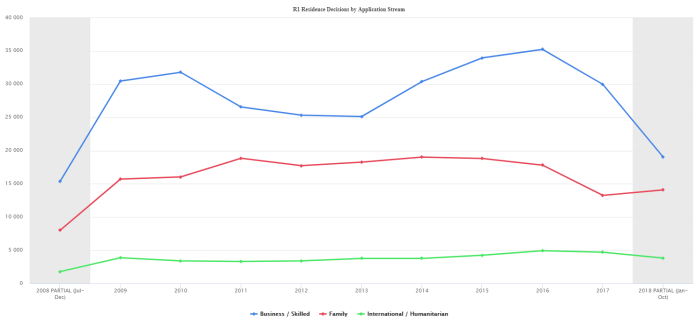
This is calendar year data, so note that the final observations are only for 10 months. But even if you scale those numbers up (by 6/5) what is unmistakeable is how sharp the reduction in the number of residence approvals granted in the business/skilled streams – centrepiece of our economics-focused immigration programme – has been. I wrote first about this development a couple of months ago, somewhat puzzled by quite what is going on – given that there was a small reduction in the residence approvals target last year, but nothing subsequently.
Unfortunately – I guess it is still a prototype – the November numbers haven’t yet been loaded in the Dashboard, so I had to go back to the more timely – if less wieldy – big PDFs, where the data is in financial year (to June) format.

I’ve annualised the five months of data we have for 2018/19 to date. At present approval rates we are on course for a slightly lower rate of approvals in 2018/19 than we had in 2017/18 – both below official announced target (centred on 45000 approvals per annum). Those would be the lowest number of approvals this century to date.
I remain a bit puzzled quite what is going on, and I’d have thought someone should be grilling the Minister of Immigration for answers. There is an official target and it is not even close to being met.
Here is an update of a chart I ran a couple of months ago of the nationalities of those granted residence approvals (again the 2018/19 numbers are annualised).
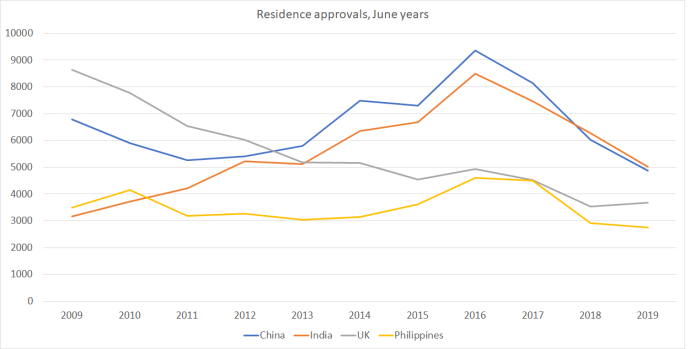
What is striking is the reduction in the number of Indian and (even more so) Chinese approvals.
As I noted in the earlier post
I’m puzzled. And, of course, I’ve spent years calling for a reduction in the residence approvals target, so in one sense I’m not unhappy to see the reduced numbers. But I also strongly favour open and transparent policy, and there has been nothing announced suggesting that we should have been expecting – or that the government was seeking – such a large reduction in the number of residence approvals being granted.
And the number of points required to get residence is supposed to operate as a quasi-price: if too many “good” applicants are applying, the logic is supposed to be that the points threshold is raised, and if not many applications are coming in, the points threshold is supposed to be lowered. But I’m not aware of any steps having been taken – lowering the threshold – this year.
One possibility is that although the government was not willing to openly take steps to reduce the inflow of (permanent) migrants, they (or at least parts of the government) were not unhappy if the inflow declined anyway. And even among those champing at the bit for lots of migrants – one might think of the Prime Minister – perhaps there is some unease that announcing a reduction in the points threshold might reawaken a debate about the relatively low-skilled nature of many of our (notionally) skilled migrants. These, after all, were the top occupations for the skilled migrant principal applicants from the most recent Migration Trends and Outlook.
| Main occupations for Skilled Migrant Category principal applicants, 2016/17 | ||
| Occupation | 2016/17 | |
| Number | % | |
| Chef | 684 | 5.7% |
| Registered Nurse (Aged Care) | 559 | 4.6% |
| Retail Manager (General) | 503 | 4.2% |
| Cafe or Restaurant Manager | 452 | 3.7% |
And finally, a couple of other snippets of what we are better able to see with the new Dashboard. This chart shows the number of first-time student visas granted to people from each of the two largest markets, China and India.
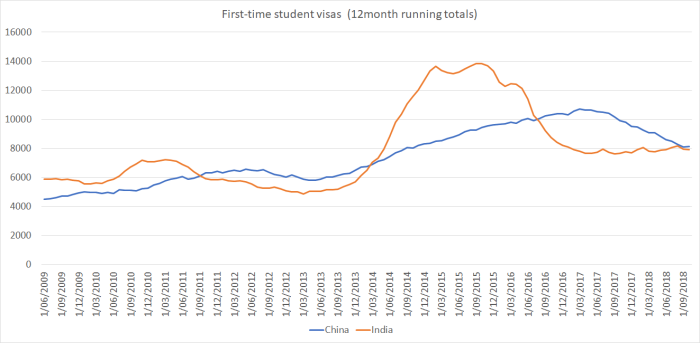
I’d been aware that Indian student numbers had fallen sharply, although the numbers there appear to have stabilised. The China market, however, is much more important for our universities and I hadn’t been aware that the number of first-time visas for PRC students had also been falling away for a couple of years now; so much so in fact that almost the whole of the boom has reversed. No doubt the Vice-Chancellors will be even more concerned to keep pressure on the government not to say or do anything that might upset the regime in Beijing, no matter how egregious it is.
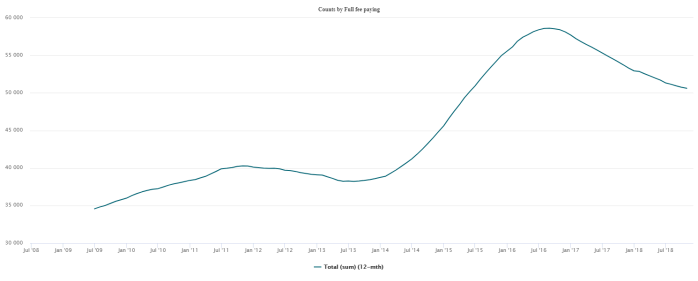
That chart is about flows – first time arrivals. The stock of foreign students takes longer to adjust, but here from the Dashboard is a chart of the stock of full fee paying student visa holders in New Zealand.
And last of all, this is the stock of people in New Zealand with current work visas. Whatever is going on around residence approvals, the number of people with short-term work visas continues rise pretty strongly (although, interestingly, when I dug down a little, the number of people here on working holiday visas has fallen back a bit from peak).

When it is finished, MBIE’s new dashboard will be a significant step forward. Even now we are beginning to get more information, on a more timely and accessible basis. That is welcome. But the better data unables us to pose some as-yet-unanswered questions including (particularly) just what is going on with the centrepiece of our immigration policy, the residence approvals programme.
(And while I’m awarding ticks – well half-ticks anyway – for this data, we shouldn’t lose sight of the loss of the data about the comings and goings of New Zealanders.)
