A couple of months ago I did a post highlighting some little recognised aspects of the New Zealand data on wages and labour income. They suggested that, given the underlying relatively poor performance of the economy, workers hadn’t done badly at all. I was curious how the latest national accounts data had changed the picture.
The first chart that attracted my interest was the labour income (“compensation of employees”) share of GDP. The data are only available annually, but they suggested quite a recovery in the labour share of GDP in the 00s, which had been sustained this decade to date.

That was the picture on the previous iteration of data. Here is the updated version.

The picture is subtly different, and if anything the labour income share looks to have been shrinking gradually this decade, even if it is still well above where it was in 2001/2 (the historical low).
But the other chart, which I found more striking, was one in which I compared growth in nominal wage rates against growth in nominal GDP per hour worked. I used the Statistics New Zealand Analytical Unadjusted Labour Cost Index series. It isn’t widely referred to, but relative to the headline LCI series it is a pure wages series, not one in which SNZ has already tried to adjust for productivity, and relative to the QES, it is much smoother (the way economists typically think of wage-setting behaviour) and produces more sensible and plausible series (some of the problems with the QES were illustrated in the earlier post).
When I did the exercise earlier, on the old data, I found that cumulative wage inflation – particularly that in the private sector – had run quite a bit ahead of productivity (GDP per hour worked) since around 2002. Here is the updated version of the chart.
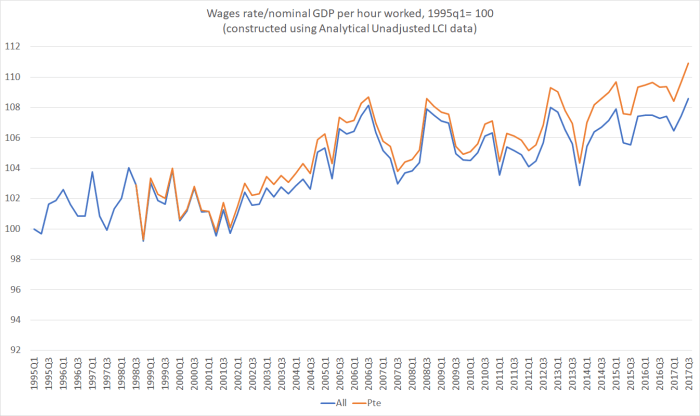
There is a lot of short-term noise in the series – and wages last year were somewhat “artificially” boosted by the pay equity settlement – but if the extent to which wages have moved ahead of productivity is less than it was in the previous iteration of the data (GDP has been revised up, and wage rate data are unchanged), the trend I highlighted last year is still there.
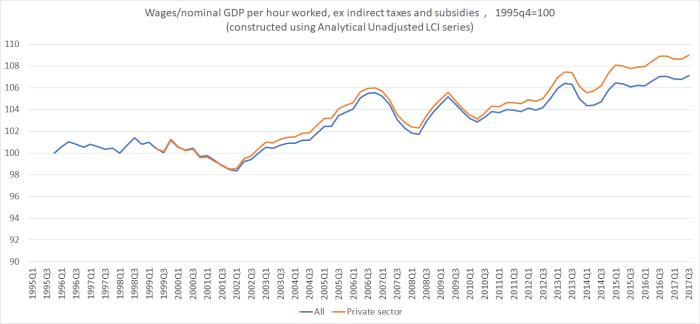
In my earlier post, I noted that this chart had been done using GDP itslf, and that to be more strictly accurate I should have taken account of, eg, the 2010 change in GST (which boosted GDP but shouldn’t have affected wages). Data on indirect taxes and subsidies are only available annually, so here is a smoothed (four quarter moving average) version of the chart, this time comparing wages against nominal GDP per hour worked excluding indirect taxes and subsidies.
What has been going on? One possibility is that the Analytical Unadjusted wages data are just substantially wrong? But they are series that have now been published by SNZ for more than 20 years, and I don’t have specific things I can point to suggesting that they are wrong.
If the data are picking up something real, what then might be the story? Here was what I included in the earlier post.
My explanation is pretty simple: the (real) exchange rate, which stepped up sharply about 15 years ago and has never sustainably come down since. When the exchange rate is high, firms in the tradables sectors make less money than they otherwise would have done. The usual counter to that is that the terms of trade have risen. But the increase in the real exchange rate has been considerably more than the higher terms of trade would warrant, and in any case much of the gains in the terms of trade have come in the form of lower real import prices, rather than higher real export prices.
And why has the exchange rate been so high? Because the economy has been strongly skewed towards the non-tradables sector which – by definition – does not face the test of international competition. Demand for labour in that sector has been strong, on average, over the last 15 years, and it is the non-tradables sector that has, in effect, set the marginal price for labour. For those firms, in aggregate, the lack of productivity growth doesn’t matter much – they pass costs on to customers. But it matters a lot for tradables sector producers, who have to pay the market price for labour, with no ability to pass those costs on (while the exchange rate puts downward pressure on their overall returns). Another definition of the real exchange rate is the price of non-tradables relative to those of tradables. Consistent with this sort of story, in per capita terms real tradables sector GDP peaked back in 2004 (levels that is, not growth rates).
It isn’t, to repeat, a story in which labour has done well absolutely. As I illustrated the other day, over the last five years there has been about 1 per cent real productivity growth in total. For decades, we’ve been slipping backwards relative to other advanced countries. But given the weak overall performance, labour doesn’t look to have done too badly. That isn’t a recommendation for the “economic strategy” the last two governments have pursued. A climate in which firms don’t find investment attractive – perhaps especially investment in the internationally-competitive tradables sector – isn’t likely to be one that conduces to generating sustained high performance and strong medium-term income growth.
And here is the proxy for business investment (total investment less housing and government) as a share of GDP

Despite some of the best terms of trade in decades, business investment has been poor this cycle – following on from several decades when it has typically been well below that of the median OECD country (despite well above median population growth). The notion that “investment has been weak in lots of countries”, even to the extent true, should be no consolation: we started so far behind there was (and is) plenty of scope for us to have caught up, not being so affected by financial crises, euro-area ructions, zero lower bounds or whatever.
It is a fool’s paradise model: non-tradables focused businesses (of which there are many) do just fine, supported by continuing rapid population growth, but there isn’t much net investment at all outside those sectors as New Zealand proves to be an increasingly unfavourable place to build and base internationally competitive businesses. Productivity growth remains weak, perhaps even weakens further. Wages might well outstrip productivity growth, but in the long-run only sustained productivity growth will support high material living standards here. It isn’t a model that need end in crisis, but rather in mediocrity. And New Zealanders could do so much better.
