I’m still enfeebled by the last of a bad cold – three days of Wellington Anniversary Weekend and I didn’t even get out the front door – so there won’t be much here today. But I noticed that Demographia yesterday released their annual report on median prices relative to median incomes in Anglo countries cities (and a few other places).
As three academics from the London School of Economics put it in their introduction
Before we can have useful debates or even give a balanced assessment of the issues we need good measures. Here Demographia has done wonders over the past decade to focus public debate on the inequity of rising house prices relative to incomes. As Oliver Hartwich in his Introduction to the 13th edition last year said “Demographia’s‘ median multiple’ approach…firmly established a benchmark for housing affordability by linking median house prices to median household incomes. It… is not a perfect measure because it does not account for house sizes or build quality. But it is the only index that allows a quick comparison of different housing markets, and it is the best approximation of housing affordability measures we have to date.” We agree.
(The house size point matters when comparing, say, New Zealand or Australian price to income ratios with those in, say, the UK – where the typical house is notoriously small – but much less so for comparisons across, say, the US, Canada, Australia and New Zealand markets.)
The big strength of the report is the collation of the data. But the authors have policy prescriptions in mind too. This is the more “analytical” of the charts in the report – a variant of one they seem to show most years.

No New Zealand city is large enough to feature, but the general point isn’t reliant on a single observation: by and large, cities with high price to income ratios have restrictive land use laws. And no city – in their sample – with liberal land use laws has particularly high price to income ratios.
As so often, the US offers a high degree of in-country variability. There isn’t just a single large city, or a single large fast-growing city. And there are very substantial differences in the land-use restrictions regime. All within a country that has the same currency (and interest rates), the same banking regulations, and much the same tax system.
So here are the median house price to income ratios for the New Zealand cities in the Demographia sample and a selection of US cities.
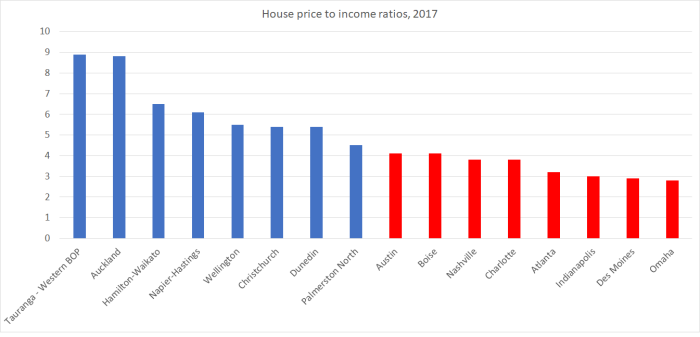
Did I cherry-pick the US cities? Well, yes, in some ways I did. If I’d simply wanted to show what can be done in the US, there are 10 cities with populations over 2 million with price to income ratios of 3 and under. But some of them are cities that haven’t done very well economically, and really depressed places with falling populations can have house prices below replacement costs.
Instead, I picked out a selection of cities – of different size, although all larger than the typical New Zealand city – in a different parts of the country. I don’t know a lot about some of them, but many are regarded as pretty nice places to live – at least if one gets over New Zealand priors in favour of cities by the sea (which, of course, Hamilton and Palmerston North aren’t).
As for population growth, I found some scattered snippets:
- the Charlotte area is estimated to experienced a 15 per cent increase in population from the 2010 census to 2016,
- the Nashville MSA is estimated to have doubled its population in the last 30 years, and had a rate of population increase similar to Charlotte’s in the most recent decade,
- the Boise (Idaho) area has doubled its population since 1990,
- according to the US Census Bureau, Des Moines has recently been the fast-growing city in the mid-west (at around 2 per cent per annum).
As regular readers know, I’m not a fan of government-fuelled population growth. But in the US as a whole, immigration policy isn’t a large contributor to population growth, and so rapid population growth rates in individual cities are mostly about people and firms locating where the opportunities are. And, perhaps, where the housing is affordable.
There seem to be plenty of examples in the United States in particular showing what can be achieved – functioning affordable housing markets – even in areas with fast-growing populations. Perhaps there is something amiss in our construction (and construction products) markets, but there has to be something seriously amiss with our land use laws and regulations when price to income ratios in what is – for now – by some margin our least unaffordable market are materially higher than those in flourishing US cities, such as some of those shown in the chart.
It would be good to see the urgent report the Minister for Housing commissioned before Christmas on the problems around housing in New Zealand highlight some of these simple, but telling, contrasts.
