Making sense of savings behaviour (the bit of flow income not spent) in New Zealand is a bit of a challenge. Perhaps that is true of other countries as well, but I know their individual stories less well. In the New Zealand case, it isn’t helped by the rather limited historical data: we have an official estimate of national savings back only as far as the year to March 1972, we only have a sectoral decomposition of savings (household government, etc) back to 1987, and there is no official quarterly data. Australia, by contrast, has all this data back as far as 1959.
Our sustained period of high inflation didn’t help either. A significant chunk of any interest rate is typically compensation for inflation, and on the other hand in inflationary periods depreciation (typically on a historic cost basis) tends to be understated. Decades ago, the Reserve Bank was pointing out that in that era, inflation was flattering our national savings figures.
Here is the official series of net national savings expressed as a percentage of net national income (“net” in both cases being net of depreciation – or “consumption of fixed capital”, and “national” referring to the income and savings of New Zealand residents, as distinct from “domestic” – as in GDP – being any activity occurring in New Zealand.)
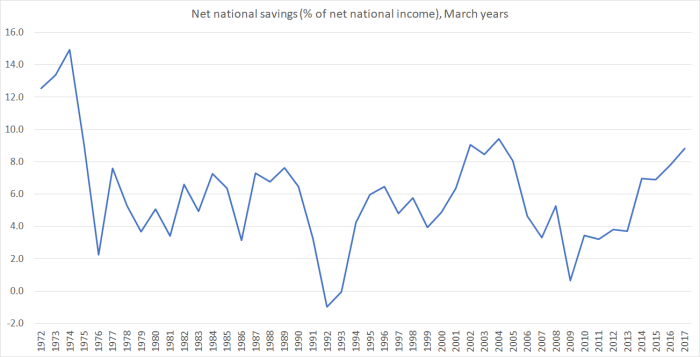
If your eye is anything like mine, you are probably drawn to those last few observations, suggesting quite a significant increase in the net national savings rate in the last few years. It isn’t exceptional by historical standards – the savings rate averaged just a little higher for several years in the early 2000s – but is interesting nonetheless. Of the other potentially interesting observations, I have no good story for why national savings rates were so much higher at the very start of the period (and thus can only lament the absence of a longer run of official data). One thing is clear: the lowest points in the series (years to March 1992 and March 2009) coincide with severe recessions. That probably isn’t too surprising. But there isn’t anything really comparable on the other side: if savings rates have tended to be higher in cyclically stronger periods, the peaks certainly don’t coincide very strongly with cyclical economic peaks. Perhaps the other thing to note is that for the last 40 years there has been no obvious trend in the series: fluctuations have been around a fairly constant average rate of 5 to 6 per cent. Perhaps the reduction in the inflation rate masks an underlying modest trend improvement, but even if so, the high inflation era itself ended 25 years ago.
What about the sectoral breakdown of net national savings? Here is the split between government and private savings.
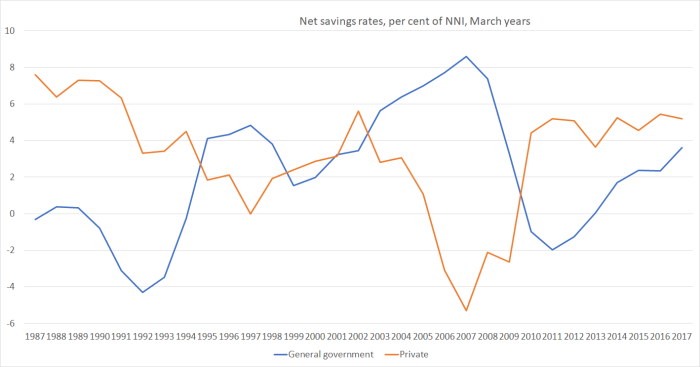
It is pretty well-recognised that there has been an inverse relationship between the two series. Quite what that means, or why it occurs, is another question. Some of it is about the automatic stabilisers built into the tax system (in particular). Government tax revenue tends to increase more than proportionally in economic upswings, and vice versa (eg on the company tax side, many companies record losses in recession, and it may take a few years of a recovery before they start having a tax payment liability again). Some may be about government spending taking the place of private spending: if the government suddenly starts paying for, say, childcare costs, households no longer have to and some of that money might now be saved. Some might be about rational expectations of future fiscal adjustments – not in some very long-term Ricardian sense, but just that political debate tends to compete to spend large surpluses when they do arise, and people may anticipate that they will soon have more money in their pockets (eg from tax cuts). Whatever the reason, the pattern has been there over the last 30 years or so. It is one reason to be a little cautious about the idea sometimes heard that, if raising national savings rates was some sort of national economic priority, it might be enabled by governments simply running larger surpluses. History – here and abroad – suggests that such surpluses aren’t likely to be sustainable, at least when starting from a low debt position, and that the public will relatively quickly recognise that.
Having said that, it is interesting that over the last few years the increase in the national savings rate has been almost wholly reflected in a rise in government savings. The private savings rate, by contrast, has been pretty stable for some years.
But what about the breakdown within the private savings rate. This chart shows household and business savings separately, both as share of NNI.

It is useful to be reminded that for some decades now business (net) savings rates have been quite a bit larger than those of households. Little commentary ever focuses on business savings rates.
Some commentators – including, at times, the Reserve Bank – tend to make quite a lot of the role of house prices in explaining household savings behaviour. I’ve never really found that convincing, and suspect that fiscal policy may be more important an influence on the cyclical swings in the savings rate. Why? Well, consumption as a share of GDP has been remarkably stable over 30 years, in the face of huge increases in house prices, and quite substantial swings in house price inflation. That shouldn’t really be a surprise: after all, higher house prices aren’t a net gain in the community’s real purchasing power, they just redistribute purchasing power a bit (to those just about the downsize and retire to the provinces, and away from those trying to purchase a first home). And, as it happens, the low point in the household savings rate series came in the year to March 2003, just prior to the first great surge upwards in house prices.
And, of course, one keeps seeing talk – typically from interested parties – of the rising tide of Kiwisaver funds. No doubt, there is a big increase in the stock of funds bearing a Kiwisaver label, but there is nothing in household savings data over the last decade that really suggests any material change in households’ overall rates of savings. Those rates were very low when the government was running big surpluses, picked up somewhat when the government had big deficits (and the economic climate was uncertain) and have been falling off again in recent years as the budget moved back into (actual and prospective) larger surpluses.
As for business savings, I don’t know how to interpret the data at all. There has been too little analysis (at least that I’ve seen) attempting to make sense of the swings in the years leading up to 2008 – that really sharp fall in business savings rates well before the recession itself – or of the extent of the subsequent recovery. Terms of trade fluctuations, for example, don’t readily explain the patterns. Of course, in the end firms are ultimately owned by households, and the boundaries between the two may be somewhat permeable (and affected, for example, by tax changes and dividend distribution policies.)
I’m not one of those who is alarmed by New Zealand savings rates. They are towards the low side in international comparisons (a topic for another day), but it isn’t obvious that that is because of specific policy distortions here which materially adversely affecting savings (and more so here than in other countries). The government accounts have been fairly healthy for decades, our welfare and retirement income system discourages private savings less than those of many other countries, and although our tax system bears materially more heavily on institutional savings than the regimes of many other countries, one has to be cautious about putting too much weight on that argument: it is not, after all, as if savings rates have been materially lower since the late 1980s (when the tax system was markedly reoriented) than previously. A highly successful economy would be likely – based on international comparisons – to see higher average savings rates, but that doesn’t mean that policies designed to boost savings rates could themselves do much to lift the performance of the economy (partly because policies designed to “boost savings” don’t themselves have a particularly good track record). Rather, when firms are finding abundant investment opportunities, they will tend to be wanting to retain more in the business, and earning the rates of return that support those high business savings rates.
As a reminder, this post has been about flow savings rates. Some people are keen to talk about asset revaluations, and gains in recorded wealth. That is, largely, a different topic, but – as already noted – bearing in mind that we all have to live somewhere, higher house prices do not make us, as a community, better off. Higher equity prices may well do so – and thus US research used to find a stronger wealth effect on consumption from equity prices – especially if those gains are reflecting underlying improvements in productivity etc.
