The 13th annual TIN (“Technology Investment Network”) report was released a couple of days ago. I’ve largely managed to ignore the previous twelve – breathless hype and all – but for some reason I got interested yesterday, and started digging around in the material that was accessible to the public (despite lots of taxpayer subsidies the full report is expensive) and then in some of the New Zealand economic data. Perhaps it was the seeming disconnect between the rhetoric from the sector, and its public sector backers, and the reality of an economy that has had no productivity growth at all for five years, and where exports as a share of GDP have been falling (and are projected by The Treasury to keep on falling).
The centrepiece of the report is an analysis of “New Zealand’s top 200 technology companies” (by revenue) where, as far I can tell, “New Zealand’s” here means something about the base of the company being in New Zealand, whether it is owned here or not. I’m not quite sure either what the definition of a “technology” company is, and it is worth remembering that almost every type of economic activity uses technology in ways that were inconceivable even 50 years ago. Often new technologies are developed and adopted inside companies that wouldn’t think of themselves primarily as “technology companies”. No one doubts the important pervasive role that technology plays, in New Zealand and in any moderately-advanced economy. But the TIN Report appears to focus on a pretty broadly-defined group of companies in biotech, ICT, and (more than half) in “high-tech manufacturing”.
Here are the top 10 companies from the list
| Date founded | Total revenue ($m) | |
| Datacom | 1965 | 1157 |
| Fisher & Paykel Appliances | 1934 | 1146 |
| Fisher & Paykel Healthcare | 1934 | 894 |
| Xero | 2006 | 295 |
| Gallagher Group | ca. 1938 | 232 |
| Orion Health | 1993 | 199 |
| Douglas Pharmceuticals | 1967 | 190 |
| Tait Communications | 1969 | 175 |
| NDA Group | 1894 | 175 |
| Temperzone | 1956 | 175 |
Perhaps most immediately striking was the gap between the first three companies on the list and the rest of them. But I also realised that I’d visited quite a few of these companies (the Reserve Bank’s business visits programme), in some cases a long time ago. Tait was one of the good news stories we used to tell in the 1980s – economic times were tough, and we had a selection of (sometimes rather desperate) anecdotes of economic transformation. So I dug out – as best I could – the dates each of these firms was founded. Of the top 10, as many (one each) had been founded in the 19th century as in the 21st century, and only one more had been founded in the last three decades of the 20th century, even as the New Zealand economy was being liberalised. It isn’t exactly the image one has of really top-tier technology companies. Sure IBM and Hewlett-Packard have been round for a while now, but Google, Facebook, and Amazon all date from the last 25 years – and they’ve managed to dominate world markets, not just been big in New Zealand.
Actually, a somewhat similar point even found its way into the TIN press release
Companies with over $20 million revenue grew at twice the rate of companies below NZ$20 million. The 90 companies with revenues NZ$20 million and over grew at 8.4%, compared to just 3.8% revenue growth for the 110 companies with under $20 million in revenue.
Nominal GDP in New Zealand grew by 5.9 per cent in the year to June, and yet the second tier of New Zealand based technology companies could only manage sales growth of 3.8 per cent in the last year (and even that number is subject to a form of survivor bias – some firms that did worse will have dropped out of the list). I was, frankly, astonished at quite how weak the revenue growth seemed to have been.
The headline TIN were keen to highlight was that the annual worldwide sales of the TIN 200 companies had now passed $10 billion (just a bit more than Foodstuffs supermarkets). $10 billion isn’t a trivial sum of course, but New Zealand GDP last year was $268 billion dollars (and gross sales are higher than GDP) – so worldwide sales of these 200 companies were just under 4 per cent of New Zealand’s GDP. They were also keen to highlight 43000 people employed around the world. Again, not a small number but just over 2.5 million people are employed in New Zealand at present. In many of these companies, overseas employment – an important part of making the businesses successful – is quite a large share of the total. For many of the companies, data aren’t easily accessible, but from Fisher and Paykel Healthcare’s latest annual report I learned that of its 4100 employees, 1800 are overseas.
Writing of the $10 billion revenue number, the TIN Managing Director noted
It is not just a number but a marker that indicates that our technology exporters are well and truly entrenched as a critical part of New Zealand’s economic growth
Perhaps he isn’t aware that there has been no productivity growth for five years?
But what of “exports”? We are told that these 200 firms have “more than NZ$7.3 billion sourced through exports”. They carefully describe that in their headline as “the equivalent of 10 per cent of all New Zealand’s exports”, but some media rather loosely translated this into a story that these tech companies now account of 10 per cent of New Zealand’s exports.
Without access to the full report, it is difficult to know quite how they calculate the number. But almost certainly, a lot of that $7.3 billion – perhaps total overseas sales – will in fact be counted as other countries’ exports. Chinese-owned Fisher & Paykel Appliances, for examples, manufactures in Thailand, Mexico, China and Italy. Fisher and Paykel Healthcare manufactures in Mexico, and presumably most of that production goes to the United States. And if, say, Datacom has big operations in Australia, much of the value-added from that operation will accrue to Australian employees.
I don’t have a problem with any of that. It is how successful international businesses work. In most cases, the relevant intellectual property is probably being generated in New Zealand, and the value of that should be captured by those doing the work, and the owners of the relevant businesses (in many, perhaps most, cases, New Zealanders).
But how does all this fit with the overall economic performance story. One of the public sector funders of the TIN report was quoted in a Newsroom story yesterday
Victoria Crone, chief executive of one of the sponsors of the report, Callaghan Innovation, said technology was a key for growth in New Zealand’s economy. “Every dollar invested in the tech sector creates three dollars of growth in the New Zealand economy. Doubling or tripling the contribution of dairy or tourism by simply expanding these sectors is simply not practical given their respective demands on land, water and infrastructure.
“By contrast all the tech sector needs to expand is more brains, more ideas and more capital to bring them to market.”
Which might all sounds fine, but how have those tech sectors actually been doing? Getting too deeply into the line items of our export data isn’t really my thing but (for example) SNZ publish a summary breakdown of merchandise exports, with a category of “elaborately-transformed manufactures” (not all of which would typically be thought of as anything like “technology exports”). Here is how elaborately-transformed manufactures on the one hand, and primary products on the other, have done as shares of total merchandise exports, going back to 2003 (just before the first TIN Report was published).
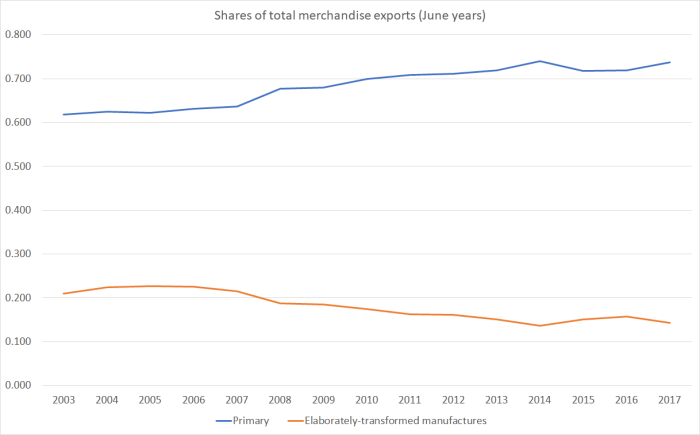
And over that period, total merchandise exports have fallen from 21.4 per cent of GDP to 18.6 per cent of GDP.
What about services exports – the weightless economy and all that?
Again, it is a challenge to break out the things that most people will think of as “technology exports”, so I’ve erred on the side of including more items rather than less. There is greater detail for the last few years, but to go back further the data are less disaggregated. From the annual services exports data I summed four categories
| Services; Exports; Charges for the use of intellectual property nei |
| Services; Exports; Telecommunications, computer, and information services |
| Services; Exports; Other business services |
| Services; Exports; Personal, cultural, and recreational services |
The latter because the largest component of it appears to be film and TV exports (Weta workshops, Peter Jackson etc).
These components of services exports are, as one would perhaps hope, a larger share of total services exports than was the case 15 or 20 years ago. Unfortunately – and unusually for advanced economies – services exports in total have not been growing as a share of GDP. This chart shows these four components of services exports as a share of GDP.
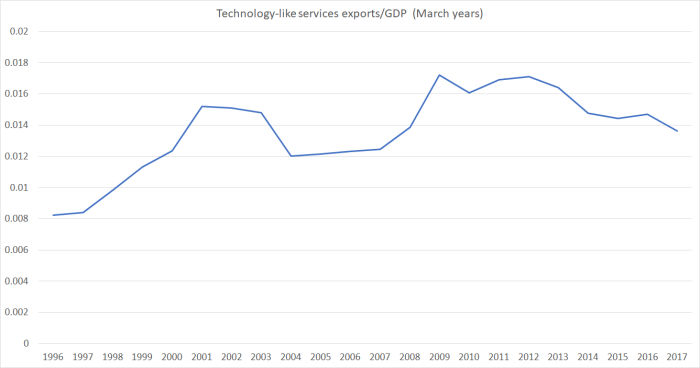
It looks quite sensitive to the exchange rate (as one might expect), but whatever the reason the share in the most recent year is still around where it was in 2000 or 2001. Even with, for example, those amped-up film subsidies.
Still on the trail of (overall) success stories, I thought I’d check out the investment income account of the balance of payments. New Zealand shareholders will still be better off – as I noted earlier – even if there aren’t exports directly from New Zealand if their offshore operations are generating profits. Whether those profits are remitted to New Zealand or reinvested in the business abroad, it is a gain for New Zealanders (and captured in the Gross National Income numbers, although not in GDP – the latter is about production in New Zealand). The published data in the investment income account isn’t broken down by economic sector, but there is data on different types of income. I focused on two columns
| Primary Income; Inv. income; NZ inv. abroad; Direct inv.; Income on equity etc; Dividends and distributed branch profits |
| Primary Income; Inv. income; NZ inv. abroad; Direct inv.; Income on equity etc; Reinvested earnings |
Unfortunately, the data are patchy to say the least so I can’t show a time series chart. And bear in mind that these profits are from direct overseas investment by New Zealand firms in all economic sectors. But here are the total returns under these two headings for the five years to 2000 and for the last five years, both expressed as a percentage of GDP (over those five year periods).
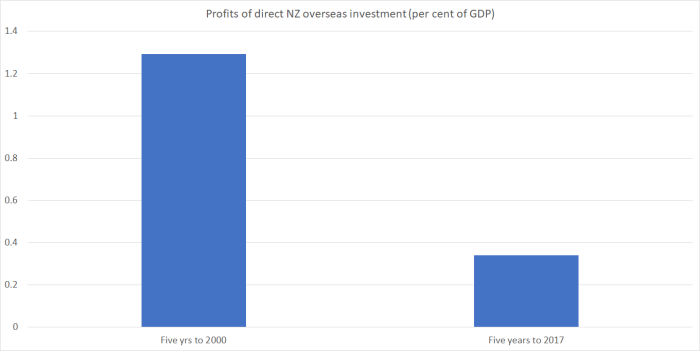
Remember that these are profits from firms in all sectors, but if there are big transformative tech sector profits they must be pretty well hidden.
When, many years ago now, I read Brian Easton’s economic history of New Zealand since World War Two, one of the things I noted then was the evidence Easton had gathered for how the composition of New Zealand’s exports had changed rapidly in the past.
Back in the 1960s, in the Official Yearbook Statistics New Zealand reported a high-level table of the composition of our exports. The traditional products were these
| Meat |
| Dairy |
| Wool |
| Fruit and vegetables |
| Animal by-products |
In 1962, these products made up 85 per cent of (estimated) total goods and services exports. Just a decade later in 1972, those same products made up only 67 per cent of total goods and services exports. Subsidies probably played a part – counteracting the additional cost imposed by our own tariffs and import quotas. Then again, film subsidies (or Rocket Lab subsidies) anyone?
In earlier decades, new technology – it was all technology that made it possible – meant that dairy products went from being only for the domestic market to being our second largest exports in 30 years.
By contrast, the performance of today’s New Zealand based tech sector seems pretty distinctly underwhelming. I’m sure there are plenty of good firms, and plenty of able people trying to build them – New Zealand isn’t short of able people, or of a regulatory environment that makes it easy to start new businesses – but in aggregate the results should really be seen as rather disappointing. Vic Crone talks of how, in her view, “all the tech sector needs is more brains, more ideas, and more capital to bring them to market”. New Zealand has never had a problem with any of those three. It looks rather more as though the opportunities just aren’t here – in a location so remote – to any great extent, and the challenges of remoteness are just compounded by a real exchange rate that has got persistently out of line with the deteriorating relative competitiveness of the New Zealand economy.
The taxpayer – through Callaghan and NZTE – has been helping pay for this report, and the associated puff pieces made available to the public. One can only hope that a new government (of whatever stripe) might start by asking some hard questions, of those agencies and of MBIE and Treasury, that look behind the hype. I’m not optimistic – all sides seem to have a stronger interest in believing the spin than in confronting the real and persistent underperformance. Then again, the good thing about being a pessimist is that just occasionally one can be pleasantly surprised.
