The CPI data for the September quarter were released yesterday. They were the last for the period Graeme Wheeler was Governor of the Reserve Bank – charged with targeting inflation – although of course the lags mean that policy choices Wheeler made will still be influencing inflation through next year. The target Wheeler willingly signed up for five years ago was 2 per cent CPI inflation. In his time in office, he saw annual inflation that high only once (of 20 observations). On his preferred core measure – which is probably the best indicator of the underlying trend in inflation – September 2009 was the last time core inflation was as high as 2 per cent.
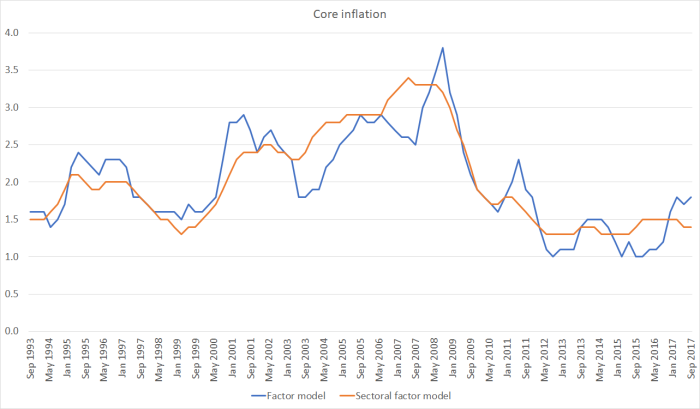
In fact, here is that (sectoral factor) measure of core inflation back a decade or so.

There are various readings one could put on that chart. On the one hand, core inflation (on this measure) has been astonishingly stable in the last six years or so. That would normally be to the credit of the Governor concerned. Then again, the same Governor explicitly signed up for a focus on 2 per cent inflation, and there has been no sign that the trend in inflation is any closer to fluctuating around 2 per cent than it was in 2012.
On the other hand, at the start of chart, back in 2006/2007 at the peak of the last boom, inflation was clearly too high (relative to the target the government had given us). Partly for that reason, I continued to recommend OCR increases throughout most of 2007. With hindsight – but probably only in hindsight – those increases weren’t needed. But my point here is to recognise that the gap between actual core inflation and the target midpoint (2 per cent) was materially larger then that it is now. As it happens, we didn’t have this particular core measure in 2007, but when we sat around the table debating what Alan Bollard should do with interest rates then, we knew a best estimate of core inflation was around 3 per cent (we were also pretty confident that the unemployment was well below a sustainable level). In fact, at the time the Bank’s Board was asking uncomfortable questions as to quite how 3 per cent annual core inflation squared with the statutory mandate of “a stable general level of prices” (I wrote a, from memory, slightly casuistical paper in response.)
So, if there are legitimate questions about the conduct of monetary policy right now – the Bank having already undone its 2014/15 mistake – they pale in comparison with those that should have been being asked in 2007. (As I recall it, Stephen Toplis was raising such questions then, and attracting the ire of the then Governor).
What do yesterday’s inflation data show?
I’ve previously shown a table of six core inflation measures
| Core inflation, year to Sept | |
| CPI ex petrol | 1.8 |
| Trimmed mean | 2 |
| Weighted median | 2 |
| Factor model | 1.8 |
| Sectoral factor model | 1.4 |
| CPI ex food and energy | 1.5 |
A couple of those measures are actually bang on 2 per cent. On the other hand, the Reserve Bank has been consistently clear in recent years that its favoured measure is the sectoral factor model (a statistical exercise that searches of underlying common trends in the disaggregated components of the CPI), and international comparisons often use a CPI ex food and energy measure (it is the one core measure the OECD reports for its member countries).
Hawks might be inclined to dismiss the Bank’s preference for the sectoral factor model as just “cover for a reluctance to raise the OCR to where it ‘should’ be”. I think they would be wrong to do so. It isn’t that long since the median core inflation measure was running materially below the sectoral factor model number, and the Bank was then asserting that the core inflation measure was a better guide. I wasn’t fully convinced at the time, but it seems that they were probably right.
We only have consistent data for all six core measures back three years or so, but even that is enough to illustrate the point. In this chart I’ve shown the sectoral core measure and the median of the other five measures.

The gap between the two lines was larger a couple of years ago than it is now. I don’t think many observers will find it that credible that in the sort of economy we’ve experienced in the last couple of years “true” core inflation has picked up as strongly as the blue line suggests. The general understanding of how inflation works, in settled and stable economies, is that there is lots of short-term noise, but that the underlying trend – the bit monetary policy should usually focus on – is pretty sticky and slow-moving. Personally, I find it more convincing to believe that core inflation has been pretty consistently low for several years than to suppose it has gone through the quite large cycles some of the other measures suggest. In support of this proposition, over the almost 25 years for which we have estimates from the sectoral factor model, it is easy – with hindsight – to tell a persuasive story about what was going on in that series. Less so with some of the other measures.
One other way to illustrate the point is to compare the sectoral factor model numbers to a couple of the other core inflation indicators for which there is a long run of data. This compares the sectoral factor model and the factor model (an earlier iteration, using a similar class of filtering techniques).
Or in this one a comparison of the sectoral factor model with the CPI ex food and energy (in the latter I haven’t manually excluded the 2010 GST spike).
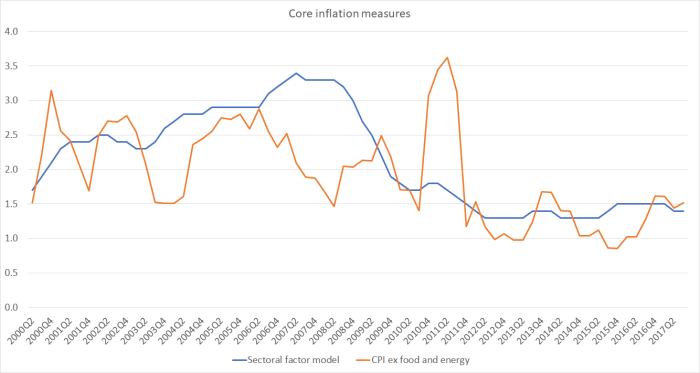
You will struggle to find an economist who thinks that, in an economy like New Zealand’s, the underlying trend in inflation is anything like as noisy as those other measures suggest.
We don’t have a formal Policy Targets Agreement at present, but for some years now PTAs have included this phrase
For a variety of reasons, the actual annual rate of CPI inflation will vary around the medium-term trend of inflation, which is the focus of the policy target.
There isn’t much sign either that the medium-trend of inflation is fluctuating around 2 per cent – where it supposed to have been – or that it has been increasing and getting any closer to target.
Here is another way of looking at the issue. Headline inflation is thrown around by changes in taxes and government charges, and although SNZ don’t (unfortunately) publish a series of CPI inflation excluding taxes and charges (as many other countries’ statistical agencies do), they do publish a series of non-tradables inflation excluding government charges and the cigarettes and tobacco component (the latter having been the subject of repeated large tax increases in recent years, which have nothing to do with the underlying inflation process). The data only go back 10 years or so, but here is what that chart looks like.
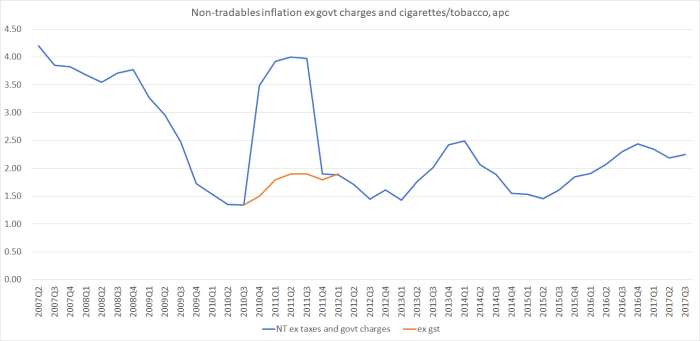
This measure of core non-tradables inflation is off its lows (in 2010, 2012, and 2015) but shows no sign of racing away. Construction cost pressures play a big role in this series, but even with the pressures in that sector, this measure of non-tradables inflation is currently running at only around 2.25 per cent. The 2014 peak was (a bit) higher. (Consistent with this story, wage inflation – although quite high relative to productivity growth – has also been showing no signs of acceleration).
I saw one commentary yesterday suggesting that if non-tradables inflation was above 2 per cent that was grounds for thinking about tightening – after all, 2 per cent is the inflation target midpoint. Actually, for decades non-tradables inflation has averaged well above tradables inflation. Our benchmark in discussions at the Bank was often along the lines of “a 2 per cent inflation target means tradables inflation averaging about 1 per cent and non-tradables inflation averaging about 3 per cent”. As it happens, for the 17 years the Bank has data on its website, tradables inflation has averaged 1.0 per cent, and non-tradables inflation has averaged 3.2 per cent (CPI inflation averaged 2.2 per cent).
If the Reserve Bank is serious about ensuring that core inflation fluctuates around per cent, they will need to be seeing quite a lift in non-tradables inflation from here. There is nothing in the data suggesting that lift is already getting underway. And, of course, that is largely why their own projections haven’t shown any OCR increases for some considerable time.
Against this backdrop, the troubling question remains why every commentator (I’ve seen) has been focused on the timing of a potential OCR increase (even if all agree it is probably still some time away). Core inflation is persistently below target, the best measure of core inflation shows little or no sign of picking up, and – not irrelevantly – the unemployment rate is still above any credible estimates of the long-run sustainable rate. It is not as if rapid productivity growth is driving prices downward either – some sort of “good low inflation”. Instead, there is no aggregate productivity growth. And few commentators seem to envisage GDP growth (headline or per capita) accelerating from here. Even if there are some encouraging signs in the world economy at present, it isn’t at all clear to me why one would think the next OCR change was any more likely to be an increase than a cut.
I wouldn’t be pushing for an OCR cut at present, but it isn’t hard to envisage how we might be better off if the OCR was a bit lower than it is now. I’ve resisted the argument that house price inflation should be an additional factor in OCR decisions, and I’m not about to reverse that stance just because house price inflation is (temporarily?) subdued, but for those who did want to give house price inflation some extra weight even that argument against further OCR cuts probably has to be put to one side for now.
In conclusion, I noticed this paragraph in the BNZ commentary on yesterday’s numbers
What is peculiar to New Zealand, however, is the very confused governance picture we have at the moment. Not only do we have a caretaker governor but we also don’t know who the incoming government is or what its expectations are for future fiscal stimulus, the Policy Targets Agreement and the Reserve Bank Act itself. Until these questions are answered it is very difficult to make any meaningful comment on future RBNZ action with any degree of certainty.
I’d largely agree with all that. It remains possible that the Bank could be operating under a different PTA as soon as next week (it happened to varying degrees in each of 1990, 1996, 1999 and 2008), and even then the (unlawful) caretaker Governor has little or no effective mandate to do anything much, minding the store until a permanent appointee is in place. Of course, even when all those uncertainties are resolved – Governor, and any (or no) changes to the PTA or Act – it will still be hard “to make any meaningful comment on future RBNZ action with any degree of certainty”. Doing so would require a degree of knowledge about future inflation pressures not gifted to central banks, or to private forecasters. We (more or less) know what we see now, and not much beyond that (ever).
