I guess they got South Canterbury Finance very wrong, but…..

At the end of 2008 South Canterbury Finance was rated BBB- by Standard and Poors.  Earlier that year, it has issued three year bonds (themselves rated BBB-) in the US private placement market.   BBB- wasn’t such a bad credit rating for a small, not overly diversified unregulated domestic lender.  But a year or two later, SCF failed spectacularly, at considerable cost to the taxpayer.

Today, S&P has come out downgrading the standalone ratings of three of the four big banks to BBB+.  Of course, that is still two notches above SCF’s rating, but if it is really justified  the news would have to be quite concerning.  Note that the overall issuer credit ratings remain at AA-, reflecting the combination of probable parental support and the possibility of government support (for these systemically significant banks) in the event that they get into trouble.  Their assessment of the risk of investors losing money hasn’t changed.

But it is the standalone rating that is meant to reflect the quality of each bank’s loan book.

Recall that the RBNZ and APRA stress-tested the large banks only last year.  The stress scenarios were very demanding –  a 50 per cent fall in house prices and an increase in the unemployment rate larger than any seen in floating exchange rate countries in the post-war decades.  And the banks’ loan books came through with flying colours, and the actual capital of each of the banks was not impaired at all (capital ratios fell because risk weights on the remaining loans rose).

Here is a chart of capital ratios from the stress test scenarios from the November FSR

CET

If Standard and Poor’s are right there must be something very wrong with the Reserve Bank stress test results.  Not that much has changed in the make-up of banks’ portfolios in the last 12-18 months for the difference to be about new, much riskier, loans being made.  My bias is to run with the stress test results –  perhaps they are a little optimistic, but probably not too much.  But the Governor doesn’t seem to believe them, and neither apparently does one of the leading rating agencies.  If the Bank is really sceptical then it is really past time for it to lay out any reasoning, and evidence, it has as to why the stress test results are not now a good guide to the standalone health of the major banks.

Skills-based migration: q to v

I’ve had quite a few comments and questions on these data.  I want to be clear what they are.   They are drawn from an MBIE spreadsheet, usefully posted on their immigration statistics page, which contains all work visa applications over the years 2010/11 to 2014/15, over 300000 of them.  Around 60000 were declined, and I’ve just deleted those.  Another 60000 or so don’t specify an occupation.  That includes working holiday visas and a variety of others.  I’ve also not looked any further at those.  The charts in this series have been taken from the remaining 190000 or so successful applications.

And 190000 is, of course, not some net inflow of people over that period.  Some of the applications might have been people here for only a few weeks or months (eg specific event visas).  There are plenty of “variation of conditions” approvals, which are presumably multiple approvals for the same person.  And the same position might have been filled over five years by, say, five different foreign job-holders.    All I have sought to show that, of the large number of work visa approvals over the last five years a surprisingly large proportion have been for positions that don’t appear particularly highly-skilled, and which aren’t what most people (well, me anyway) had in mind when they hear of a skills-based immigration programme  (and this should, presumably be the most skills-oriented component of the overall programme –  refugees and family reunification visas have a different focus).

With that prelude, here is the chart for the letters q to v

work visas q to v

And what caught my eye this time?  A surprising number of truck drivers (if all ours really went to the West Australian mines, higher wages here would have been the market response I’d have thought), and huge number of aged-care nurses (to complement the even greater number of aged-care workers we saw the other day).

And then there was the retail sector –  more than 7000 retail supervisors and retail managers, mostly applying under an “Essential Skills” category.  Every single one of those shelf-fillers also applied under the Essential Skills category.

Somehow it doesn’t have the feel of a productivity-enhancing skills-focused programme.      Too often these have the feel of something where employers in particular sectors are rewarded for their lobbying skills in getting the particular occupational “skills” they want to employ on the approved list.  By contrast, the usual market response to shortages in particular occupations is for the relative wage for that occupation to rise.  And if the shortages are pervasive enough  –  unlikely over recent years when the unemployment has lingered around 6 per cent –  monetary policy tightens to keep overall demand in check.  Running approved lists of “essential skills” or areas of skill shortages is, in any case, a flawed strategy. It eases pressures on employers of that particular occupation, but since in the short-term demand effects of immigration outweigh supply effects (the standard result in New Zealand macro studies), any gain for employers in a single sector is outweighed by the additional demand pressures elsewhere in the economy.

Statistics New Zealand and the “population ponzi”

In the last few years, Statistics New Zealand has taken to “spinning” its statistical releases.  I use the term advisedly.  I’m sure all the numbers are reported entirely accurately, but my issue is more with which numbers, and which comparisons, they choose to highlight.  Almost always, they seem to emphasise what staff (and management?) presumably regard as good news.  Is that quite the job of a national statistics agency?  Personally, I value good quality data, and technical explanations for apparent oddities –  and the assurance that SNZ has no agenda other than good quality data, adequately explained.  There are plenty of others out there (backbenchers in parliamentary questions?) to highlight the good, or not so good.

The latest example came this morning, with the population data release below.

It might be mildly interesting to know that population growth in the last year outstripped that even in  –  much richer and more successful –  Australia.  But SNZ seems to think this is “a good thing” –  if anything reporting it as something of a race.   Fortunately, we aren’t  early 20th century France needing to stress about the growing military threat from a larger neighbouring country’s faster population growth.  And if we want to celebrate success, I’d suggest doing it using measures of per capita living standards (however you want to define them) or even productivity.  But leave it to the commentators and politicians to do the cheerleading.

Just to illustrate the apparent “good news bias”, SNZ put another release this morning.  Real retail sales rose only 0.1 per cent in the June quarter.  But there was no mention of what happened in Australia.  I checked, and in Australia the comparable series rose by 0.8 per cent in June quarter.  In per capita terms, I guess that gap is a little larger still.

SNZ does a pretty good job with the inadequate resources they have, but I’d urge then to leave the editorialising to journalists, commentators, politicians and the like.

Population growth outpaces Australia’s – Media release

14 August 2015

New Zealand’s population is growing at its fastest rate for over a decade, and is exceeding Australia’s growth rate, according to new estimates released by Statistics New Zealand today.

The country’s population grew by 86,900 people, or 1.9 percent, in the year to 30 June 2015. This came from net migration (arrivals minus departures) of 58,300, and natural increase (births minus deaths) of 28,700. New Zealand’s estimated resident population was 4.6 million at 30 June 2015. The latest figures
show Australia’s population growing at 1.4 percent a year.

“The last time New Zealand’s population grew at this rate was in 2003 when the increase was 2 percent,” population statistics manager Vina Cullum said. “The last time New Zealand’s growth rate exceeded Australia’s was 2004.”

China, currency adjustments, etc

[For those keen on my skills-based migration series, more posts are coming.  For government officials, and any others, going “yes, yes, you’ve made your point”, I will clearly label them and feel free not to read them]

There is a column in the Dominion-Post this morning, from a well-regarded journalist, Pattrick Smellie, running under the confident heading of “Beijing not starting a currency war”.  I’m sure the Chinese Embassy will have been pretty happy with the coverage.

Making sense of our own central bank is often hard enough, let alone the intentions and motivations of the Chinese state authorities. Early in World War Two Winston Churchill described Russia, newly signed-up to a non-aggression pact with Germany as “a riddle wrapped in a mystery inside an enigma”.  It seems to be a phrase that could readily be adapted to the Chinese authorities.  But as Churchill put it in the same speech, the key to Russia was “national interest”, or perceptions of it.

And, no doubt, no one is setting out to start a “currency war”.  If one actively devalues one’s currency one prefers that no one else follows.  That  is how the competitiveness gains are secured.  Then again, so-called currency wars in the past have sometimes been rather a good thing.  In the Great Depression  the countries that freed their currencies from gold first, and devalued, recovered soonest, and the laggards (big or small) themselves recovered when they too devalued.  In that period, so-called competitive devaluations were a path to a much-needed easing in global monetary policy, and a recovery in global demand.  It wasn’t coordinated and each country acted in its own perceived self-interest, subject to the constraints each faced.  Facing a very severe adverse terms of trade shock, and the temporary closure of UK funding markets, New Zealand was fortunate that it allowed its currency to depreciate against sterling quite early, then benefited from the UK’s own early departure from gold, and then actively devalued again in early 1933.

What, then, of China?  As Smellie ends up acknowledging in his article, in a weakening economy a depreciating currency might be thought of as normal or natural, and China’s economy has been weakening fast –  almost certainly much faster than is officially acknowledged.

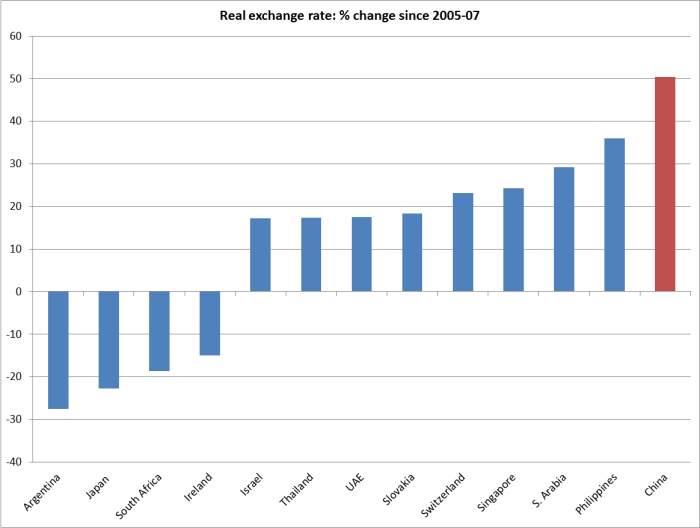
The BIS compiles real exchange rate indexes for about 60 countries.  I had a quick look at which countries had seen large real exchange rate changes since the pre-recession period.  Here I compared the average for the last six months with the average for 2005 to 2007.   13 countries have seen changes of more than 15 per cent[1].  China’s has been, by far, the largest change, and the largest increase –  up around 50 per cent.

china rer

It was pretty widely accepted a decade ago that the yuan was undervalued in real terms.  During this period, China was running huge current account surpluses –  something unprecedented in a fast-growing developing country  (Singapore or Korea, at similar stages of development, ran large deficits).  Hand in hand with the undervaluation, gross exports as share of China’s GDP had doubled from the early 1990s to reach almost 36 per cent in 2006.    Getting a good handle on true Chinese productivity growth isn’t easy, but there was pretty good reason, whether from the trade data or from productivity differentials, to have looked for a real yuan appreciation.

But a 50 per cent appreciation  – a considerable proportion of it in the last 12-18 months as the US dollar has strengthened –  is a very large move.  And, in conjunction with the much lower growth in global demand following the 2008/09 recession, the whole basis of China’s growth model has changed.  From a substantially export-driven model, China moved to relying on one of the biggest credit-led investment booms in history –  and, given the absence of market disciplines in China, perhaps the riskiest.  Credit to GDP soared.  Most of it has been domestic credit, but in the last few years there has also been a great deal of foreign debt taken on by Chinese borrowers.   Investment also soared –  from under 42 per cent of GDP in 2006 to more than 48 per cent by 2011.  Those are huge shifts.  And exports shrank back, from 36 per cent of GDP in 2006 to 23 per cent last year.  Again, a huge shift.  GDP was still growing, but much more slowly than it had previously, and with much less evidence of sustained productivity growth.

Against that backdrop, from a purely macroeconomic perspective, the idea of a depreciation of the real exchange rate must look quite attractive to some in Beijing.  Pursuing its own perceived national interests  no doubt, the Chinese credit boom of recent years has provided a lot of support to global demand, at a time when it was very weak, but the aftermath isn’t pretty.  It rarely is after credit booms –  see Spain or Ireland, or New Zealand post-1987.  With weakening domestic activity, and global growth that is still pretty subdued (at best), the Chinese authorities seem to have two broad short-term options.  Stimulate demand by gearing-up for one last government-inspired credit—based splurge, further exacerbating their own problems, or look towards tapping a bit more of the potential global demand for the benefit of their own producers.   (Of course, the third option would be a domestic cost- deflation, but the Greek model doesn’t seem to have much to commend it.)

People often point out that China’s consumption share of GDP is very low, and suggest a reorientation towards a more consumer-led economy.  But on the one hand those changes are likely to be slow –  and as Shang-jin Wei has pointed out , for example, things like the male-female population imbalance may be structurally driving up savings rate.  Perhaps as importantly, people are typically only willing to spend more if they are confident of their own future incomes.  At the end of a credit boom, with Chinese firms no longer securing the export growth they once were, that security isn’t unquestioned.

In a normal country, weakening demand at the end of a credit boom would naturally be followed by easing domestic monetary policy and a falling real exchange rate.  It is what happened in much of the West in 2008.   China has room to ease domestic monetary policy, but easier domestic policy almost inevitably puts more pressure on the exchange rate.  China has fairly large levels of foreign reserves (as a share of GDP) but expectations can change rapidly, and as many previous countries have found reserves can dissipate rapidly.  Plenty of capital is already flowing out of China.

I’m not suggesting any great insight into what the Chinese authorities were thinking earlier this week. In many ways, a lower real exchange rate would normally make a great deal of sense.   But these aren’t normal times.  As I noted earlier, the depreciations in the 1930s led to looser monetary policy globally.  There was no “beggar thy neighbour” dimensions to them, and everyone benefited.  And if the rest of the world still had materially positive interest rates, it could be the same now.  Easier Chinese monetary policy, lowering the real RMB might have been followed by some cuts in interest rates in other major economies, to offset the impact on them of the increases in their own real exchange rate.  But few large economies –  and none of the advanced ones –  has any material domestic monetary policy room (although the US can hold off  –  or reverse –  the widely-expected unnecessary initial tightening in its own monetary policy). Even in high-interest rate New Zealand, the policy room is dissipating.  Against that backdrop, any substantial depreciation of the yuan, even if it would be in China’s own macro-stabilisation interests, as its economy has slowed markedly, really could be a threat to the rest of the world.  A stimulus to demand in China risks being substantially at the expense of weaker demand elsewhere, at a time when overall global demand growth (China included) is at best modest, and probably weakening.  More competitive Chinese producers would be in a position to cut prices further –  in an economy where producer price inflation has been negative for a long time already –  posing new global deflationary risks.

Much of the media commentary this week has been about what the Chinese authorities intended.  And understanding that better would be good.  But, in the end, policymakers’ intentions matter only so far, once authorities have set out on a path, however halting, towards liberalisation.  There has been a widespread view until recently that the Chinese would not be willing to devalue the RMB –  whether for reasons for international relations, prestige or simply having bought the upbeat stories about China’s growth prospects.  Meanwhile, Chinese investors have been taking a different view.

This week’s action must have increased the perceived risk of some larger adjustment, whether willingly or not.  Many people have pointed out the size of past substantial devaluations –  I especially liked this piece –  but often enough those large devaluations (or float) were late adjustments, forced reluctantly on authorities who held on, and held on, until they could do so no longer.  No two countries’ situations are ever quite alike, but we shouldn’t assume that even if the Beijing authorities don’t want a large exchange rate adjustment that it won’t happen.

Much of the most recent real appreciation in the yuan reflected the material appreciation in the USD.  Some will recall that the continued appreciation of the USD, to which the Argentine peso was pegged, was one of the final straws that broke the Argentine currency board in 1991.

[1] In addition, Venezuela – which now has extreme currency rationing to defend an official peg – is recorded with a 251 per cent increase in its real exchange rate.

New Zealand credit growth in recent years

As the near-inevitable aftermath of China’s extraordinary government-led credit boom gathers pace, and the global deflationary risks mount, I thought it might be timely to have a look at credit growth in New Zealand in recent years.

I was partly prompted to do so by some reactions yesterday to my AUT Briefing Papers piece on housing. Several commenters at interest.co.nz were convinced that I was letting the banks off the hook, and that the creation of credit to finance house prices must be, in some substantial measure, to blame for high house prices (in Auckland).

In one sense, that reaction isn’t surprising. A similar model seems to have been implicit in the Governor of the Reserve Bank’s 2013 LVR restrictions and the new Auckland-specific investor finance restrictions he is consulting on at present.   After all, prudential regulatory powers of the Bank should, as per the provisions of the Reserve Bank Act, be used only when action is need to promote the soundness of the financial system.

Without covering old ground in detail, I don’t believe that there is any such systemic threat. The Reserve Bank has not made a persuasive New Zealand-specific case, and the one piece of careful analysis that has been presented (the stress test results) suggest that the banking system would be robust to even some very severe shocks.

The international literature suggests that probably the single best (albeit not very good) predictor of crises is rapid growth in the ratio of credit to GDP. We had that in the years prior to 2007. China has had it, much more dramatically, in the last five years or so. Many countries have had periods of very rapid growth in credit, and no banking crisis I’m aware of was not preceded by a period of very rapid credit growth. New Zealand’s stresses from 1987 to 1991 are an example.   But many, perhaps even most, episodes of rapid domestic credit growth have not ended in domestic systemic banking crises. New Zealand post-2007 was just one example.

The record suggests, unsurprisingly, that the quality of lending matters a lot. And the quality of lending tends to deteriorate a lot when, either

  • Government agencies are directing that lending or setting up incentives that drive banks to undertake poor quality lending (the US housing finance boom of the 00s and the recent Chinese credit boom are good examples), or
  • Where the regulatory shackles have just been taken off, and no one –  banks or regulators –  has much experience with a liberal market-based economy and appropriate credit standards (New Zealand, Australia, and the Nordics in the 1980s were good examples).

None of that looks to be the case in New Zealand at present.  We have credit data to the end of June, and GDP data only to March, but for the rest of this I’ll just assume that seasonally adjusted nominal GDP showed no growth in the June quarter.

Since December 2007, just prior to the big recession, New Zealand’s nominal GDP has risen by just under 30 per cent, and the four different measures of private sector credit have risen by about 33 per cent. But the pre-crisis dairy lending boom went on well beyond the end of 2007   If we start our comparisons from December 2009, we find that nominal GDP since them has increased by around 26 per cent and PSC by around 21 per cent. Within that total, lending to households has increased by 22 per cent.  Whatever the base period for comparisons, credit growth has been fairly subdued relative to GDP.

credit growth since dec 07
credit growth since dec 2009
And it is not that nominal GDP growth has been rampant. In the seven years to March 2015, NGDP increased by 27.4 per cent, down from 55.1 per cent growth over the previous seven years. As is now well-recognised, given the inflation target, monetary policy has been too tight over the last few years, not too loose.

Annual nominal GDP growth fluctuates a lot, largely with fluctuations in the terms of trade. At present NGDP growth is slowing rapidly. Credit growth is currently growing faster than nominal GDP growth   The strongest component of that is agricultural credit, up 7.6 per cent in the last year. But whatever the overall state of banks’ dairy exposure – and I suspect they will lose quite a lot of money, without it being a systemic threat – the current growth in dairy credit is not the sort of lending that is recklessly bidding up asset prices, it is a reflection of the severe drop in farmers’ income –  if anything, a buffer rather than the initial source of any problem.

In short, when credit has been growing at only around the (rather subdued) rate of growth in nominal GDP for the last 6-8 years

(a) it is difficult to credibly blame bank lending policy for growth in specific asset prices (Auckland house prices) without independent evidence of a decline in lending standards (which neither the Reserve Bank nor anyone else has sought to demonstrate), and

(b) we just don’t have the basis for expecting any severe stress on or threat to the soundness of the strongly-capitalised financial system.   Rising house prices certainly generate a demand for additional credit, but it is the rather more fundamental forces (driven by governments) –  land use restrictions and policy-driven immigration flows – that are the source of the underlying pressure on prices. The same banks operate nationwide, and there is no sign of house price inflation in Invercargill, or even Wellington.

Of course, a rather nasty economic slowdown appears to be already underway, and that could worsen a lot yet. If so, that will put a lot of pressure on a lot of borrowers.

Skills-based immigration – waiters

Somewhat annoyed with myself for losing my workings last night, I decided to start at the other end of the alphabet this morning.  Not many y or z occupations, but a fair number of Ws.

work visas wxyz

And again questions arise about the skills-based, productivity-enhancing, nature of those winery cellar hand and waiter approvals.  I had a slightly closer look at the waiter ones, using MBIE’s “application type”.  Somewhat to my surprise –  perennial optimist that I am –  this is what that breakdown looked like for the last five years.

work visas waiters

Café society and all that, but, really, an essential skill?

Skills-based immigration – D

I’m sure they are excellent dairy workers/farmers (all 8000+ of them), but there are only around 11000 dairy farms in the whole country.  It does, rather, have the feel of an approach more strongly focused, in effect, on keeping down wages rates and conditions in the New Zealand dairy industry –  and fuelling the gross output driven mentality which Peter Fraser and co-authors suggest has dominated the industry in the last decade or so, a period when real value-added in agriculture has not grown at all.

The gains to farmers are clear, but those to New Zealanders as a whole are rather less obvious.

A quite remarkably larger number of (skilled?) domestic house-keepers as well, no doubt complementing the 1000 commercial housekeepers, and contributing to the long-sought lift in productivity.

work visas D

AUT Briefing Papers on housing

AUT University has, over the last few weeks, been running a series of short essays on housing-related issues, in their Briefing Papers series.  There are now seven contributions from a range of different perspectives –  from economics, to social housing and health issues.  My contribution to the series is up today.  In it I reprise (briefly) my story that persistently high house prices, especially in Auckland, are best seen as the result of policy blunders of successive governments: land use restrictions running head-on into high target rates of inwards non-citizen migration.

For regular readers there will be nothing new in the latest piece.  For others, a fuller version of that story is here, and a complementary piece explaining why Reserve Bank investor finance restrictions are not a sensible or appropriate response to a problem of this nature is here.

Skills-based immigration – C

Lots of the work visas approved in the last five years were for occupations starting with C.   There were quite a few carpenters, as one might expect, but when three of the top four categories are chef, cook, and café and restaurant manager it doesn’t have the ring of a strategy well implemented to enhance productivity and the earnings prospects of New Zealanders.  I was also struck by the number of commercial cleaners, commercial housekeepers, and community workers.  And I mentioned the 250 or so checkout operators yesterday.

A skills-based economic lever to lift productivity and living standards for New Zealanders?  Really…….

work visas c

Skills-based immigration – B

Not so many people came in with “letter B” occupations, but again the list of occupations with more than 100 approvals wasn’t a great advert for the transformational productivity-enhancing possibilities of our immigration policy.

work visas b

I won’t get into debates about the possible role of temporary migration in dealing with Canterbury rebuild pressures –  but really, builder’s labourers?  But even setting construction-related roles to one side for now, a list that has the top four places taken by beauty therapists, bar attendants, bus drivers, and baristas isn’t a great advert for the  productivity (and wage) possibilities this programme creates for New Zealanders.

Frankly, I’m surprised by how few of these work visa approvals seem to have been for genuinely highly-skilled roles.  But I led a sheltered life –  the Reserve Bank used to periodically recruit foreign PhD economists.   Then again, even in the Treasury papers I noticed reference to the declining average quality of migrants.

The Treasury papers also note (p 52) that

from a dynamic productivity perspective, we consider that migration shouldn’t provide a “path of least resistance” for growth in certain sectors of the economy.  By this we mean that temporary migration shouldn’t act as a lever that keeps labour costs in certain industries down to the extent that it dulls incentives to invest in capital or increase working conditions to attract local labour.

Perhaps they had the aged-care sector in mind? Or the dairy industry?