The social democrats from Washington – the IMF – have been in town, and today released their preliminary report. It is quite strikingly different to the last one, released in March last year. The so-called Concluding Statement, at the end of the team’s 10 days or so in New Zealand, isn’t very long, and can’t cover lots of things in depth, so keep that in mind as you read the rest of this post.
The mission team will have spent a lot of time with Treasury and Reserve Bank staff. Indeed, the draft of the Concluding Statement will have been haggled over in a meeting with fairly senior officials from the two agencies, and it is pretty rare for the final product to contain anything that those agencies have much disagreement with. Indeed, Fund missions can get so close to staff in the host countries that even when two countries, reviewed by teams led by the same mission chief, have much the same circumstances, the policy advice will at times differ – seemingly to reflect what the authorities in the two countries want. A great example last time round was direct regulatory interventions in the housing finance market, which the IMF has enthusiastically supported here, but had been silent on in Australia. I’m not sure if the mission chiefs are still the same for the two countries, but checking the most recent concluding statement for Australia, I notice that the inconsistency has persisted.
Rereading the 2014 Concluding Statement the upbeat tone was unmistakeable.
“the economic expansion is becoming increasingly embedded and broad-based”
“with the economy set to continue to grow above trend in the near-term, pressures on core inflation should follow”
“we welcome the RBNZ”s shift toward a policy of withdrawing monetary stimulus, with the clear signal that it expects to increase rates steadily over the next two years”.
Oops.
(Although no doubt the Governor was pleased with the statement at the time.)
There is, of course, no hint in today’s Statement that the Fund might have misread things that badly last year. Space constraints I suppose.
But what about this year’s Statement?
I was interested to read that “inflation is projected to rise to within the RBNZ”s target range of 1-3 per cent in 2016, as the impact of the decline in oil prices drops out, and the depreciation of the New Zealand dollar passes through”. No mention anywhere, at least as far as I could see, of any rise in core inflation towards the mandated target midpoint. But I guess they are running the same lines the Governor always does – over-emphasising the one-offs (especially now that the exchange rate has rebounded) and quietly ignoring the persistent undershoot of core inflation.
But in some ways what really struck me about this year’s Statement was the wholesale leap into advocacy of a range of microeconomic and structural policies. It is a very different emphasis from last year. I know the Fund has changed mission chief for New Zealand, but surely there should be more continuity in the analysis and advice than this?
What do I have in mind?
Somewhat surprisingly, the Fund weighs in on immigration policy, noting that “continued high net immigration could pose challenges for short-term economic management, but in the longer run would boost growth”. Well, no one will really dispute the short-term demand pressures, but where is the IMF’s expertise in immigration? How have they concluded that our past immigration has boosted (per capita) growth? They might be right (or not) but how does it relate to the core macroeconomic and financial stability mandates of the IMF?
The Fund then suggests, in a paragraph on government finances, that “in addition, investment in infrastructure and housing (in high-quality projects) should be accelerated where possible to support higher housing supply in Auckland, and infrastructure improvements”. Where is the evidence of the central government infrastructure shortfalls? Government capital expenditure in New Zealand has been among the highest in the OECD, as a share of GDP. And what leads the Fund to think the government should be building houses itself (only high quality ones mind)? It all seems rather unsupported, and far from the principal mandate of the IMF.
They note too that “intensifying efforts already underway to boost higher density housing would be welcome”. What gives the IMF the basis for suggesting government policy should be skewed towards higher density housing? And how does it all connect to macroeconomic stability anyway?
Last year, the IMF was cautious about further regulatory prudential measures – tools should be “used sparingly and with caution”, but this year they are champing at the bit – no doubt reflecting the Governor’s new enthusiasm. After a perfunctory observation that “the impact of the new [prudential] measures to reduce financial stability risks will need to be evaluated”, they rush straight into “but the authorities should be prepared if further steps are needed”. I suppose that could be seen as just contingency planning, but there is no sense here at all that these interventionist measures could conceivably have costs, or that any benefits might be small.
Last year , there was no mention of tax issues at all, but now not only are “the newly introduced measures to deter speculative investment“ welcomed (those evil “speculators” at it again – can’t have them in a market economy) but “and further steps in this direction should be envisaged”. The Fund apparently favours “a more comprehensive reform to reduce the tax advantage of housing over other forms of investment“ [that would be unleveraged owner-occupiers they were targeting?] and “reducing the scope for negative gearing”. Many people might agree with the Fund, as a matter of tax policy, but where is the evidence, including the cross-country insights that (these issues are important that) the Fund is supposed to be able to offer? And where is the consistency from one mission to the next? If agencies like the IMF have substantive use – as distinct from a convenient echo of the preferences of the Reserve Bank or Treasury – it has to be keeping a clear focus on the longer-term issues that matter to macroeconomic and financial stability.
There are some odd features to the statement. In one place, they say that “stress tests indicate that the sector [banks] can withstand “a sizeable shock to house prices, the terms of trade and economic activity”, but then a page or so later they observe “financial system stress tests suggest it is able to withstand – at least in the short-term – adverse developments related to China spillovers, dairy prices and the housing market”. I think the final haggling session with officials must have missed something, and will be interested to see if the “in the short-term” caveat reflects something coming out in tomorrow’s FSR.
The other odd feature is this “on the one hand, on the other hand” paragraph
Monetary policy has been focused on the primary objective of price stability. Only if financial stability risks become broad based and prudential policy is insufficient to contain them, then using monetary policy to ‘lean against the wind’ could be considered as part of a broader strategy to rein in financial stability risks. Even in this case, the benefits would need to be weighed against the output costs and the risk of policy reversals.
They would have been better simply to have left it out. Monetary policy in New Zealand has no statutory basis for pursuing anything other than medium-term price stability, and it hasn’t even been doing that overly well. Having already had only an anaemic recovery, partly because of an overly cautious Reserve Bank, and two policy reversals – a record for the OECD – the IMF might have been better advised to simply urge the Reserve Bank to do its job – deliver inflation consistently around the middle of the target range. When they get back to the office, perhaps the mission staff could talk to Lars Svensson, currently at the IMF, about the attractions (or otherwise) of using monetary policy to “lean against the wind”.
The Concluding Statement wraps up with a discussion of Medium-Term Policies. Last time round, they had a balanced, but high level, discussion which noted structural imbalances between savings and investment (by definition, since the current account has long been in deficit], and noted that structural measures might be needed “to address the savings-investment gap”. Probably reflecting the IMF’s limited expertise in the area, it went no further, and did not even attempt a diagnosis as to whether any issues might more probably be found on the savings side than the investment side.
But this time round savings is confidently identified as the problem. We have, according to them “chronically low national saving” and “raising saving is the key to addressing this vulnerability”, “in particular household saving”. They don’t back any of this up, they don’t suggest reasons why private savings behaviour might be inappropriate, or identify policy distortions that are creating problems. Instead, they jump straight in to solutions
comprehensive measures to encourage private long-term financial saving should be considered, including through reform of retirement income policies. Options include changing the parameters of the Kiwisaver scheme—e.g., default settings, access to funds, and taxation—to increase coverage and contributions while containing fiscal costs, and adjustment of parameters of the public pension system. This could help deepen New Zealand’s capital markets and broaden options for retirement planning.
“Broadening options for retirement planning” fits how with the Fund’s mandate, or expertise? Did they recognise that New Zealand already has both a low elderly poverty rate and fiscal expenditure on public pension that, while rising quite rapidly, is not high by international standards?
Did they, for that matter, even attempt to back up the claim that New Zealand has “chronically low national savings”. If you are going to compare national savings rates, you really have to use national income as the denominator (ie savings of residents relative to the incomes of residents) . In this chart, from the OECD database, I’ve compared New Zealand’s net national savings rate (as a percentage of net national income) to the median for the other Anglo countries (Australia, Canada, Ireland, US, and UK).
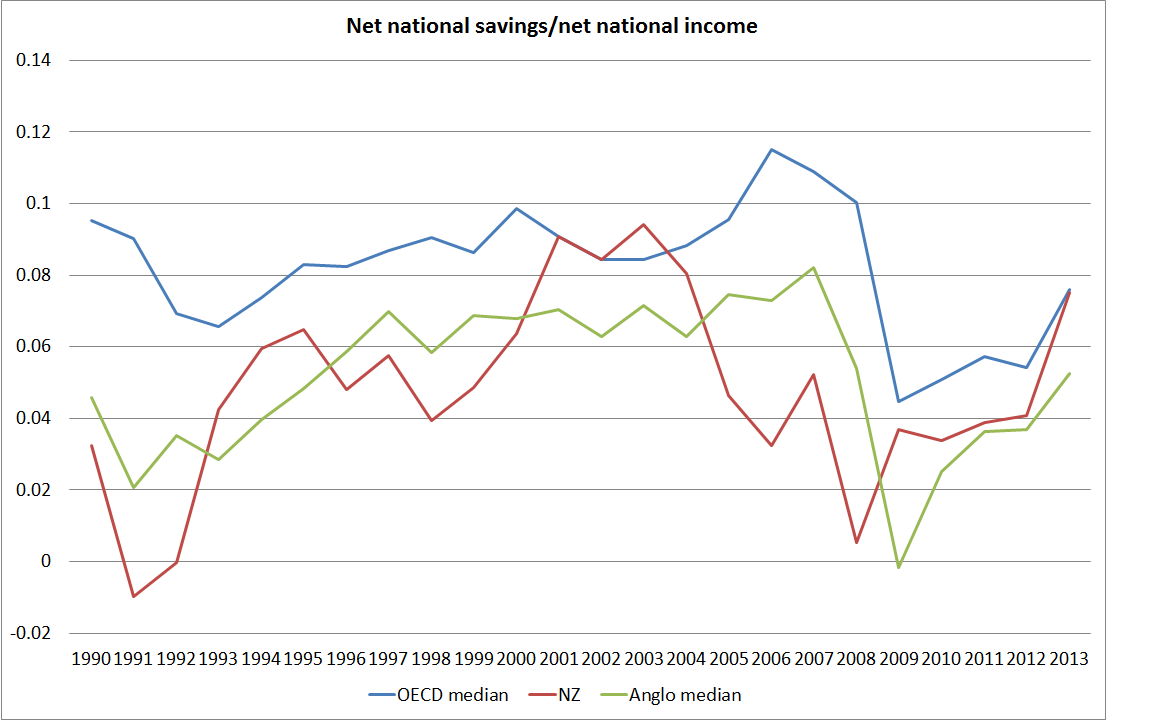
Both lines are below the median for the OECD grouping as a whole – although in the most recent year we were almost bang on the OECD median – but over 25 years our net savings rate has simply fluctuated around the median of those countries most culturally similar to us. Where is the “chronic” savings problem? And given how strong our public accounts are – better than those of any of the Anglo countries other than Australia – how likely is that our feckless private sector is behaving as irresponsibly as the IMF mission staff suggest? Perhaps Treasury has updated its view again, but I was involved in an exercise a couple of years ago in which Treasury made a pretty concerted effort to look for areas where policy might be driving down private savings rates (relative to those in other countries). They looked hard, but it was a pretty unsuccessful quest.
And, finally, here is the IMF”s last paragraph
Despite the implementation of successful structural reforms in the 1980s, productivity levels have remained low compared to OECD peers. To raise productivity, the government’s business growth agenda has identified a number of policy priorities. Specifically, the Productivity Commission has highlighted the need to raise productivity in the services sector (which accounts for 70 percent of the economy). Measures include boosting competition in key sectors such as finance, real estate, retail, and business and other professional services; and leveraging ICT technology more intensively, including by enhancing skills.
I thought, and think, that most of the reforms of the late 1980s and early 1990s were in the right direction. But a sceptic might reasonably ask what is the definition of “success” when productivity gaps have not just remained large, but widened further since then. Perhaps more importantly, what is this paragraph doing here? Long-term income convergence issues aren’t really in the IMF’s remit, and the IMF doesn’t seem to have anything useful to offer on the subject. The paragraph is little more than an advertorial for the Business Growth Agenda – itself so far signally unsuccessful in lifting exports or closing productivity gaps – and the Productivity Commission.
We really should expect something better, and more authoritative and more focused, from the IMF. Perhaps it will come with the full report in a couple of months time, but I’m not optimistic.


