I was dipping into the latest update of the OECD Outlook database, and landed on the tables for government current spending and revenue as a share of GDP.
Spending first. I’ve shown here the shares for the US, New Zealand, and for a median of the OECD countries for which the OECD has data all the way back to 1970. Unfortunately, the New Zealand data aren’t available before 1986 – which was probably about the time government spending as a share of GDP peaked here.
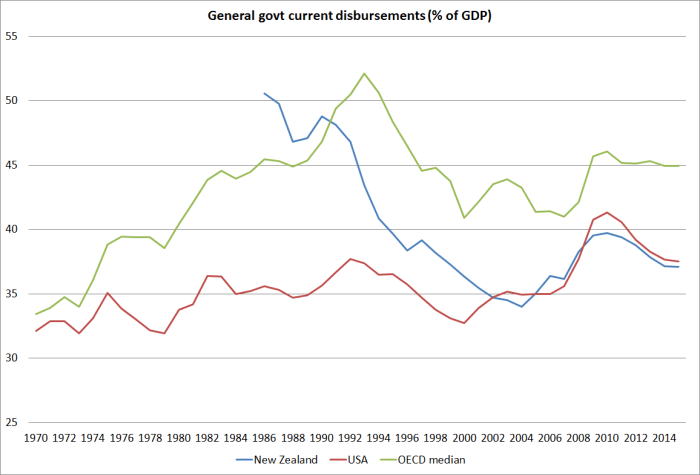
What I found interesting was how general government spending as a share of GDP in New Zealand has converged with that of the United States. Back in 1970, the United States was only just below the median for the other member countries for which there is data all the way back. Now, both New Zealand and the United States are well below the median (whether for this sample, or for the whole OECD – for which group the median is now 42.6 per cent). The role of the US government in its economy may, in effect, be even larger than that in New Zealand, since there are so many “tax expenditures” in their system. Mandated private spending, such as that under Obamacare, would also add to the effective US total.
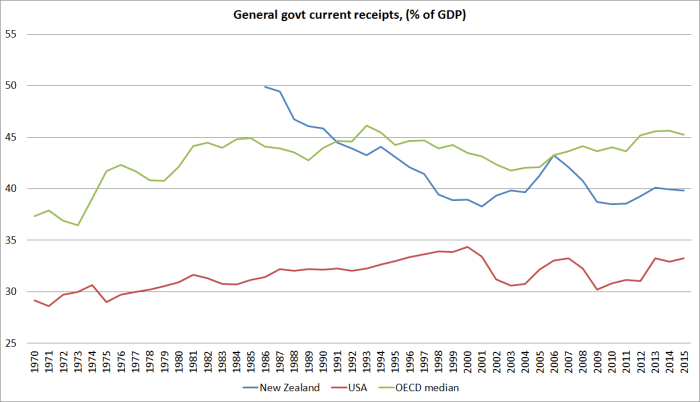
Of course, our government accounts are close to balanced, and those of the United States are not. When we look at current government receipts we are about half way between the US and the OECD median.
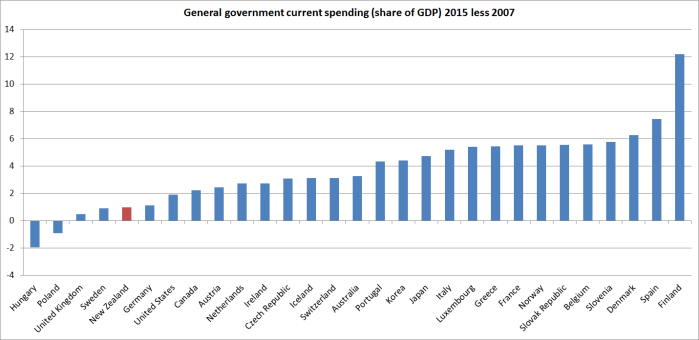
What about changes over the last few years? For all the talk of austerity, in only two OECD countries – Hungary and Poland – is current government spending as a share of GDP lower this year than it was in 2007, the last pre-recessionary year. In New Zealand, for example, general government spending this year is estimated to be almost a full percentage point of GDP higher than it was in 2007. At the other end of the chart, 11 of these 29 countries have government current spending five percentage points or more higher than it was in 2007. Check out Finland – an increase that almost defies belief over such a short period, at least outside wartime.
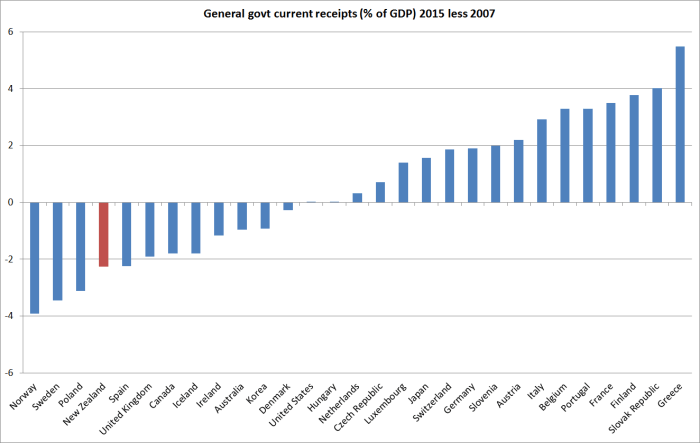
And what of taxes? The median country is estimated to have seen almost no change in the government revenue share of GDP since 2007. New Zealand is among the countries with the largest reductions, but then we were running surpluses prior to the recession. Greece has, quite remarkably, managed a very large increase in the revenue share of a falling GDP.
Most of the countries with large increases in the government spending shares are still estimated to have material negative output gaps. In principle, an eventual recovery might help shrink the relative size of government. But, for most, it is not remotely clear where the sustained recovery is going to come from, and when.
On which note, for a bit of gloomy weekend reading, I suggest Ambrose Evans-Pritchard’s piece on Finland. The tragedy of the euro, compounding what would in any case have been a difficult economic adjustment.
