And so we now have a single political party in a position to form a majority government. Between our single-chamber Parliament and the historically very tight party discipline on Labour MPs, the new government will be able to do whatever they like over the next three years. And where significant things are not done, it will be entirely down to them: their choice.
Of course, they didn’t promise much, so most don’t seem to expect much. But the issues, challenges, and problems don’t go away just a party or government chooses to ignore them. House prices for example – where the Prime Minister has consistently refused to suggest she might act in ways designed to markedly lower the price of urban land/houses.
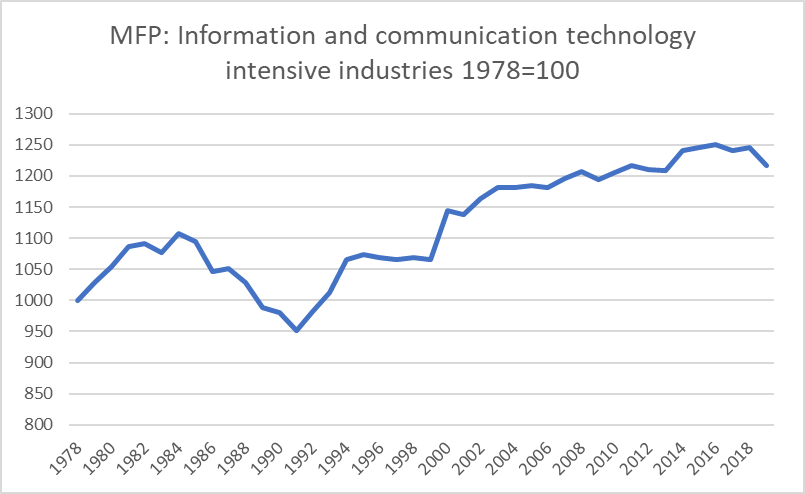
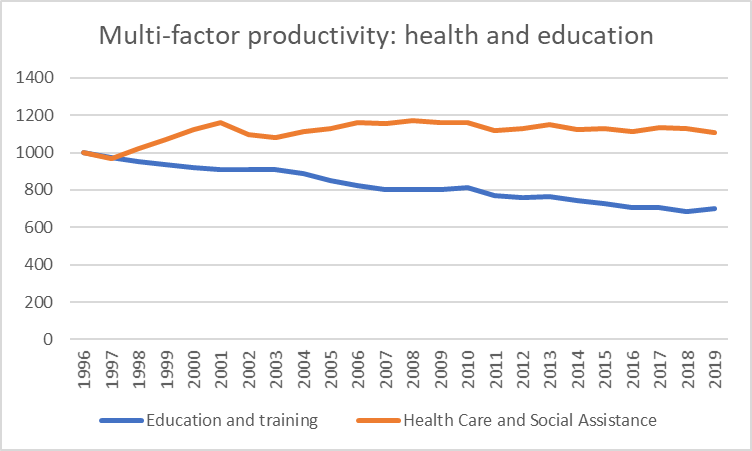
Or, and the economic issue that mostly drove the creation of this blog, New Zealand’s dismal long-term economic performance. In short, productivity growth (and the lack of it), and our continued decline relative to other advanced economies.
The outlook wasn’t good before Covid – the last government was doing nothing, and Labour was promising nothing, that would have prevented those well-established and dismal trends continuing. But now there is Covid to confront too.
One view of the outlook was contained in the International Monetary Fund’s World Economic Outlook forecasts published last week. The IMF doesn’t have a particularly good track record as a forecaster, but its forecasts do have two particular values at present: first, they are compiled consistently for a wide range of countries, and second, they forecast/project five years ahead, which on most readings is currently far enough out that one could think of things by then being back to some sort of new normal. For what it is worth, the IMF also has no particular partisan interest in New Zealand, but has also, over the years, tended to run relatively upbeat stories about New Zealand when it does comment.
Unfortunately, the IMF does not publish productivity (eg real GDP per hour worked, or MFP) forecasts. But here is a chart showing their forecasts for growth in real GDP per capita for their “advanced country” grouping over the period from 2019 (pre Covid) to 2025).

Third worst of all the advanced countries over this period, at least on the IMF’s telling. And do note that the countries a few to either side of us all have materially higher levels of labour productivity than New Zealand does, while the countries to the far left of the chart – best-performers – are mostly the countries (I’ve previously highlighted here) that started way behind and are now matching, and move to roar ahead of, New Zealand. On these projections, our relative decline – underway now for 70 years – keeps on keeping on.
Are there any silver linings? I couldn’t find any when I dug a bit deeper:
- as I noted, since these numbers are for 2019 to 2025 they shouldn’t be affected by either measurement challenges, or real differences in economic structure, that contribute to quite different GDP outcomes for some quarters this year,
- the difference also can’t be down to differences in how quickly unemployment drops back to normal (itself a thing amenable to policy, especially in a country with its own exchange rate): in most countries by 2025 the IMF thinks that unemployment rates will have got back to pretty close to 2019 levels (NZ’s is about 5 per cent, so not quite there, but it won’t explain anything like the differences in the real GDP chart). For what they are worth, the IMF also publishes output gap estimates for G7 countries, and they are also back near zero by 2025.
- I didn’t look deeply into what border assumptions the IMF is making, but I did check their population growth projections, and they continue to forecast high rates of population growth over 2019 to 2025 (hardly lower than the rate for the previous six years, and third fastest in this group of countries), which again suggests they must think something like a new-normal re-establishes before too long.
- the IMF seems to think that investment as a share of GDP will also be more or less back to pre-Covid rates by 2025 (unfortunately in New Zealand business investment in the last decade was very subdued, especially once one took account of the needs of a rapidly-rising population).
Sadly, the only realistic interpretation one can take is that the IMF thinks that over 2019 to 2025, on current government policies, New Zealand’s productivity growth performance – labour productivity and MFP – will be simply shocking. Most probably negative – the only way to square falls in real GDP per capita, unemployment returning towards normal, and a reasonable level of investment – and almost certainly far worse than in almost all other advanced economies, and especially far worse than the performance in the countries that were aiming to close gaps with the OECD leaders.
It is a really dismal outlook.
Of course, it is only one set of forecasts. The IMF may be completely wrong, even specifically about New Zealand’s relative performance. But it isn’t clear what about policy or the economic environment should be expected to generate decent productivity growth over 2019 to 2025, especially after the fairly dismal performance in the pre-Covid years.
One would like to suppose it was the sort of issue the Minister of Finance would be intensely focused on. One would like to think that The Treasury’s post-election briefing would have extensive analysis on the issue and possible remedies, and indeed how political party promises may even worsen the outlook. But such is the malaise around New Zealand economic policy and performance that it seems unlikely.
Changing tack, for some months I’ve been writing much less here than I’d really intended or hoped to. I’ve made occasional references to my indifferent health. I’ve had bugs occasionally in the past that have hung around for a couple of months, never amenable to medical diagnosis, and then eventually gone away and I kept expecting this would be the same. But despite some moderately good weeks at times – this week wasn’t one of them – it hasn’t, and my doctor now reckons that I have some – perhaps fairly moderate – version of chronic fatigue syndrome. And while it still seems most likely that it will eventually go away again, there is no immediate timeframe for that. It seems a rather pathetic thing to have, but I can’t really ignore, say, the three daytime naps I needed on Tuesday.
As a result, I’ve decided for the time being to stop attempting to maintain any sort of regular blog output. As I’ve said to various people who’ve asked, I’m probably only able to operate at 50 or 60 per cent of normal, and while I’m fortunate in not having to try to hold down a fulltime job, I have other fixed commitments (household and other) that demand almost all that energy. Since there are good days, and even a few relatively good weeks, and there many issues (even if I don’t have the concentration to dig into all of them as I’d like), I expect I will probably post here from time to time. But I won’t be trying to meet any schedule. For anyone who wants to not miss out on those posts, feel free to subscribe to get posts by email, and I also use Twitter (@MHReddell) to, among other things, provide links to any posts here.
And now it is time for a lie down…..