Statistics New Zealand last week released their annual measured sector and individual sector labour and multi-factor productivity data for the year to March 2019. It isn’t data I tend to focus on, mostly because my interests are substantially in cross-country comparisons and also because my focus is whole-economy rather than on specific sectors and sub-sectors. But it is still useful for thinking about productivity performance within New Zealand over time and we are now beginning to get a reasonable run of time series
(I can’t quickly find the official SNZ definition of the measured sector, but think of it in terms of what it isn’t (non-market bits of the economy like government administration).)
Here is labour productivity for the measured sector. I’ve shown both the actual data (in logs) and the extrapolation of the trend line for the 1996 to 2008 period.
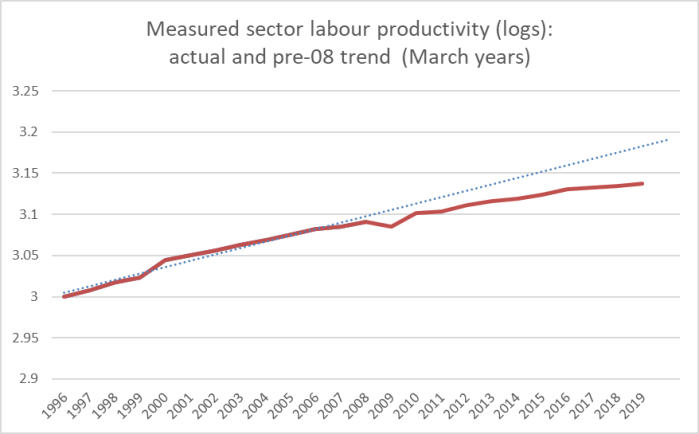
The difference at the end of the period is roughly equal to 10 per cent productivity foregone.
Here is the same chart for multifactor productivity (MFP).
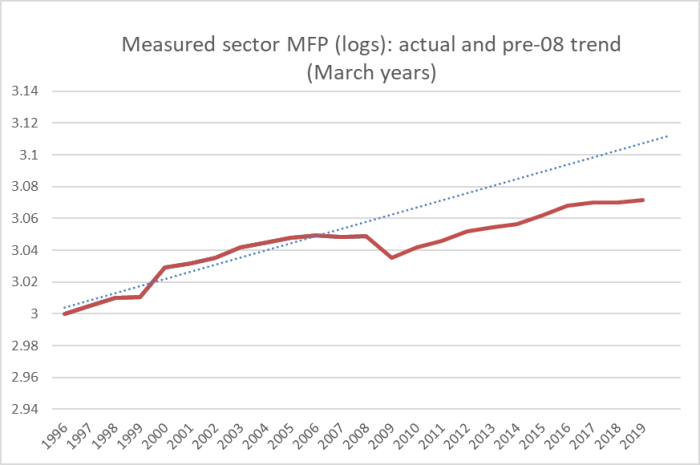
Those who are inclined to minimise New Zealand’s longstanding and ongoing productivity failures will, of course, (correctly) point out that productivity growth in the advanced world as a whole has been slower in the last decade. That might be some sort of excuse for countries at or very close to the productivity frontier – best in pack. It is no excuse at all for a country starting so very far behind the leaders (and, as I’ve pointed out here before, hasn’t stopped a bunch of eastern and central European countries – often now about as productive as New Zealand, having been communist basket cases 30 years ago – continuing to put in strong performances).
What about further disaggregated data? SNZ publishes data/estimates for labour productivity for a wide range of individual sectors and subsectors, in many cases – making up what is known as the “former measured sector” – going back to the 1970s. (Sadly, even if I run the trend line through the data all the way from 1978 to 2008, the gap around the last decade’s performance still looks stark.)
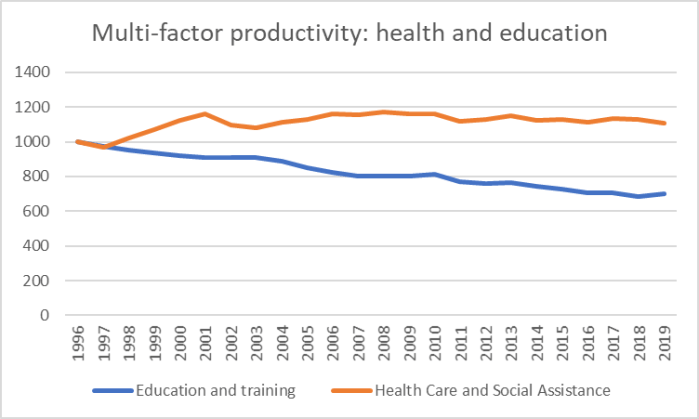
What about some more disaggregation? SNZ show results for three high-level groupings: goods, services, and primary production. The latter can be quite volatile (droughts and the like). Here are the MFP numbers for those groupings.
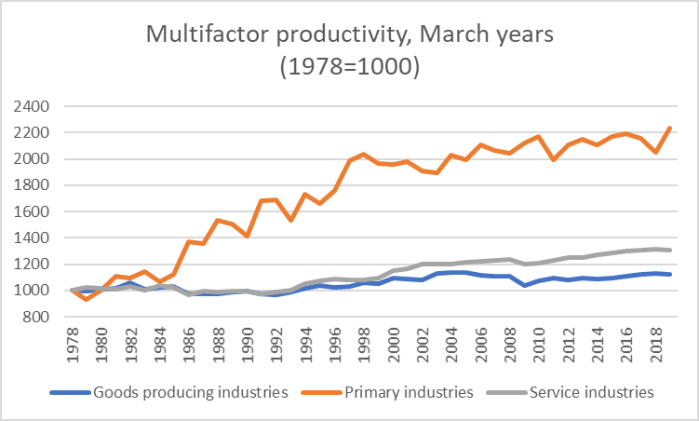
The primary industries performance was pretty impressive – doubling in twenty years – but that good performance itself ran out more than twenty years ago now. Within primary industries, agriculture itself still does quite well relative to productivity growth in the rest of the economy.
And finally a couple of charts on individual sectors. Here is the MFP estimate for something SNZ call “Information and communication technology industries”
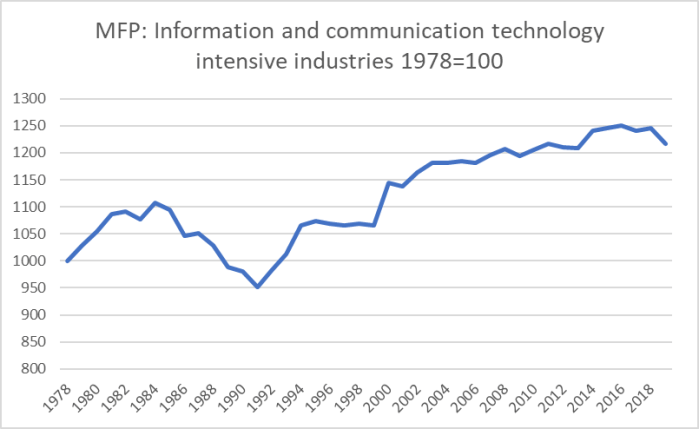
Not much growth this century – in fact, less than for the measured sector as a whole.
Then again, rather better than the performance in these two sectors.
And for anyone interested, these are the six sectors with the highest (estimated) MFP growth over the last 15 years as a whole.
| Per cent increase in MFP, last 15 years | |
| Rental, Hiring and Real Estate Services | 19.1 |
| Forestry, Fishing, and Services to Agriculture, Forestry and Fishing | 20.1 |
| Textile, Leather, Clothing and Footware Manufacturing | 27.1 |
| Information Media and Telecommunication | 33.4 |
| Retail Trade | 42.6 |
| Wood and Paper Product Manufacturing | 45.2 |
Quite a mixed bag.
Overall, however, the productivity performance of this economy remains dismal. Sadly, there is little sign any of our major parties care.

Not too sure why you continue to point positively towards a Primary Industry productivity growth which just basically add cows for higher productivity. It is no wonder our government Thinks Big on primary industry. Clearly our economists have given them the wrong advice. I am starting to think negligent advice by economists.
LikeLike
No, that isn’t correct. I showed the MFP estimates, where productivity is derived allowing for labour, capital (including animals) and land inputs.
LikeLike
That’s economist jargon for “I don’t really have the numbers but I will tell the government it was factored in and I am the expert”. Clearly Capital does not count animals so what are you counting in Capital as animals??
LikeLike
This is not a financial accounting exercise, but a modelling exercise in which MFP is the residual. The details of the calculation aren’t my interest or expertise, but SNZ are usually pretty good at responding to data etc inquiries, so feel free to get in touch and ask about the specific methodology.
LikeLike
For what its worth
Inland Revenue Tax Policy treats livestock as a capital asset,
Current value of a dairy cow is $2000. Average annual output per cow is 350 kg/ms worth $3000
Accounting Standards treat livestock as a capital asset
LikeLike
Does this mean that productivity performance in agriculture caught up in the 1980s from what had previously been particularly dismal performance from the sheep business in particular?
LikeLike
Again Real Estate Services. What a joke. These are linked to house price and rent increases, so the value there is not related to anything real. *Sigh* Can you control for house price increases? I suppose it doesn’t matter.
LikeLike
Immense skepticism – I just don’t know what is being measured nor how. Maybe gut feeling is a better judge. Taking my own area of experience “”“Information and communication technology industries”” – interesting that the data starts in 1978, the year the spreadsheet was invented [history of mankind has four major steps: the cooking pot, wheel, logarithms, electronic spreadsheets]. I assume they are attempting to measure how productive IT professionals were not the use of IT and email/internet by users. The communication industry barely existed in 1978 but most significant large computer programs were written by 1978 (usually in Cobol) and the main industry was amending them. The highly sensible widespread adoption of PCs and the Internet changed everything from the late eighties which shows on the graph as a drop in productivity whereas the sad hype of Y2K which was a computer salesman’s dream shows as a massive leap in productivity whereas the reality was many perfectly good systems being expensively replaced.
I agree with Minsk – real estate agents did the same work from one decade to the next but received more income for doing it because house prices went up and this is considered increased productivity!
LikeLike
All among the sorts of reasons these detailed sectoral numbers are not my focus nor really my interest.
LikeLike
The improvement in agricultural productivity is far from just adding more cows.
The total output per cow has increased steadily over the past 20 years, even as farmers have faced steadily increasing compliance and environmental costs. Likewise, the increase in average kill weights of lambs, etc etc…
There has been a revolution in farming processes in the last 30 years. Townies love to make out that farmers are all dull plods who wouldn’t know their way out of a soggy paper bag but those farmers left the industry long ago. Many farmers now are large commercial operators (eg MyFarm or Atarangi) and they’re very switched on people, often with primary careers in other sectors such as finance.
I know, they’re my clients…
LikeLiked by 3 people
Peter, productivity counts people. It does not count animals. Yes our farms got larger ie more cows. More cows equal higher productivity if you are not counting cows and only counting humans.
The numbers are really quite simple. You do not need a finance degree. My 11 year old can do the maths on this.
10 million cows in all of NZ genarate a GDP of $17 billion
1.5 million monkeys in Auckland generate a GDP of $75 billion.
If you remove the human factor in economics productivity calculations ie it is wrong and misleading. Which animal is more productive? Cows or monkeys?
LikeLike