Writing yesterday about the Productivity Commission’s draft report on why firms don’t invest more (in “technology”), prompted me to take a look at the OECD’s Product Market Regulation (PMR) indicators. In the OECD’s own words
The economy-wide PMR indicators measure the regulatory barriers to firm entry and competition in a broad range of key policy areas, ranging from licensing and public procurement, to governance of SOEs, price controls, evaluation of new and existing regulations, and foreign trade.
There is both a summary economywide indicator (the focus here) and a range of detailed component indicators and sectoral indicators. As always with cross-country attempts to assess policy, the indicator(s) won’t be perfect, but such indicators can still shed some light on differences across advanced economies and across time – the OECD has published the data every five years starting in 1998.
Here are rankings for 1998. (On this measure, the lower the score the less burdensome -or whatever your descriptor – the product market regulation is.)
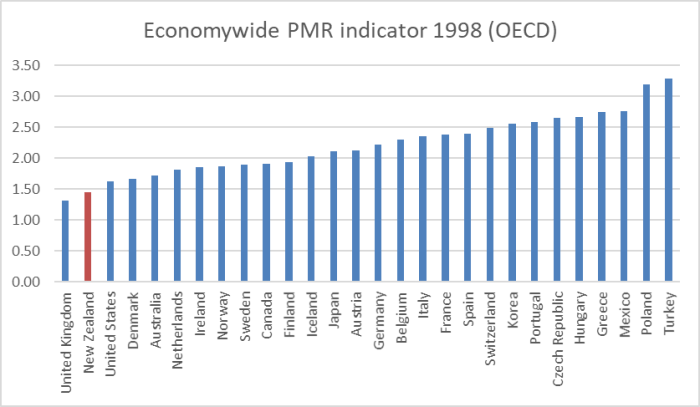
In the wake of those numbers, when people talked about the productivity performance in New Zealand you’d often here something like “well, our business regulation is less burdensome than almost anywhere in the OECD” so (among the optimists) gains will follow or (among those less sanguine) whatever the big issues are they seem unlikely to be those relating to product market regulation. A few years on we were still 2nd (in 2003) or 3rd (in 2008).
But by 2013 we were only ranked fifth. Perhaps not disastrous, but some slippage evident. And here are the 2018 numbers, fairly newly released (data for two countries still not there) assessing things as they stood on 1 January 2018.
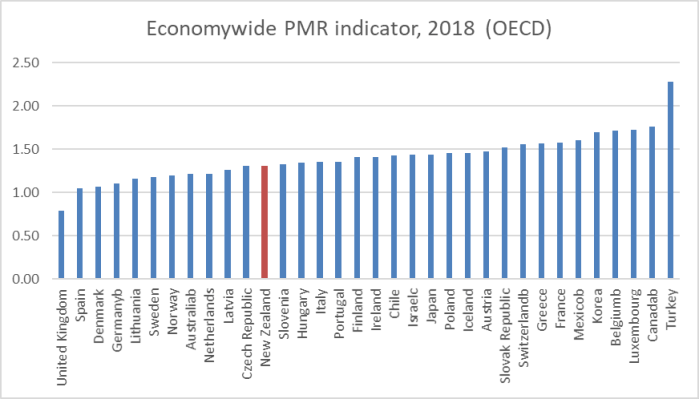
That is now a pretty unambiguous drop back in the rankings. And three former Communist countries now beat us, with another two just slightly behind.
And it isn’t as if New Zealand has just been improving a bit more slowly than the rest of the OECD. Here is the absolute score for New Zealand and for the median OECD country (no material differences if I used just the subset of countries for which there is a score on all five dates).
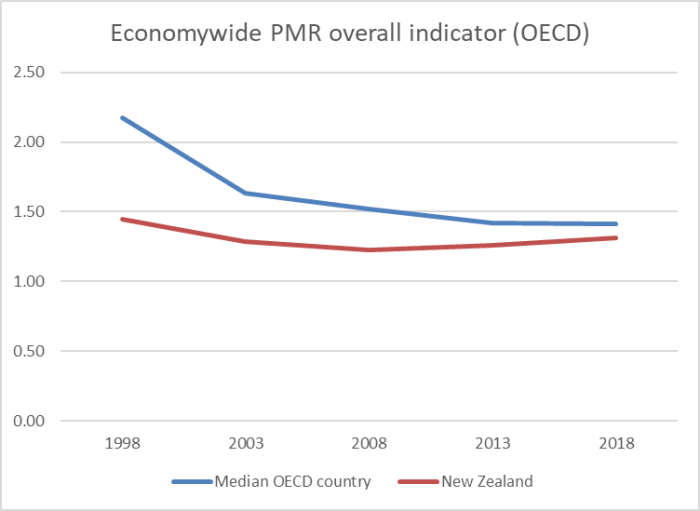
We’ve gone backwards, in absolute terms, since 2008.
I get quite a few comments whenever I write about productivity, suggesting that the web of regulation has been more constraining and all-encompassing over the years. I have a fair amount of sympathy with many of those comments, even while doubting that such regulations will explain much of our poor productivity performance. But in the PMR indicator we score poorly in a quite different area of government involvement.
The OECD publishes the data broken out into two “high-level indicators”. One is “Barriers to domestic and foreign entry” and the other is “Distortions induced by [direct] state involvement. Here is how we did in 2018 on the first of those.
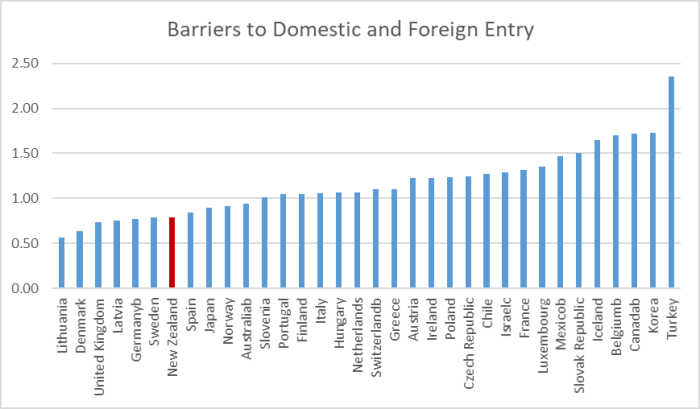
Not too bad I suppose – 5th equal, and very close to the couple of countries just above us.
But here is the other high-level indicator
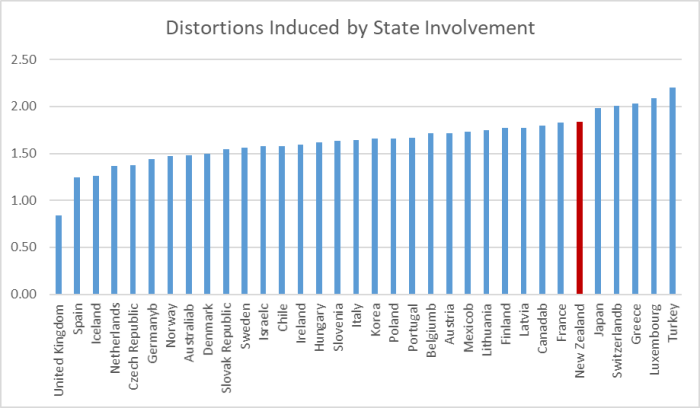
In turn, there are four sub-components to public ownership bit of this high-level series, and on each of them we score less well than the median OECD country.
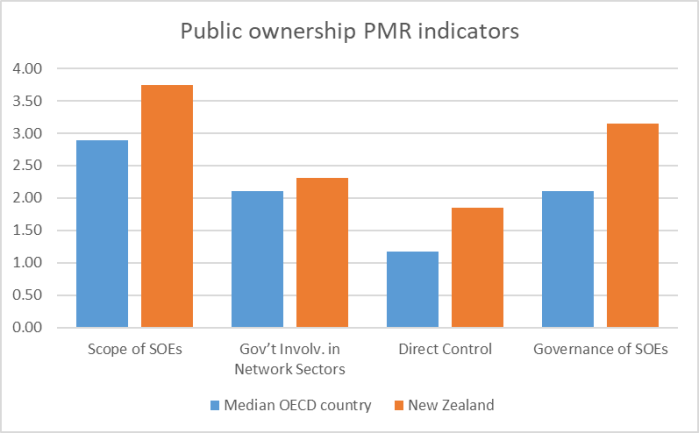
On the “involvement in business operations” sub-components of the “distortions induced by [direct] state involvement high-level indicator we are the OECD median on one, and do a little than the median on the other two.
Of the other sub-components in the overall indicator, there were six where New Zealand scored materially differently than the median OECD country: three better, three worse. Of the “worse” ones, only six countries score worse than New Zealand, and on the FDI one (and I know the interpretation is contentious) we score worst of all: none look like the sorts of areas a small economy, with persistent current deficits, should aim to score poorly.
| New Zealand Worse |
| Assessment of impact of regulations on competition |
| Complexity of regulatory procedures |
| Barriers to FDI |
| New Zealand Better |
| Admin requirements on new companies |
| Barriers in service sectors |
| Treatment of foreign suppliers |
One could go playing around in the relevant spreadsheets (economywide, and the additional sectoral ones) at great length. Perhaps I will come to them in another post next week.
One can also debate just how much regulatory and state intervention poor scores really matter in terms of overall economic performance. It is no doubt easy to point to any of the sub-components and find some highly successful country scoring poorly. But when you are starting as far behind the leaders as New Zealand now is, then even if regulation and state control issues – of the sort captured here – aren’t the key factors, if we are serious about improving productivity we should be doing whatever we can wherever we can to provide a more facilitative climate for firms to prosper on their merits.
UPDATE: An OECD economist, in comments below, has helpfully drawn my attention to some methodological changes in the 2018 PMR which mean that scores cannot be compared (reliably) across time (the 1998 to 2013 ones should work, but there is a discontinuity to 2018). I think her comments leave most of this post looking okay (the relative rankings should still be meaningful, and the identification of where we now do poorly) but one should be a little cautious about the time series chart (noting, however, that the trends I was highlighting were already apparent by 2013).
