Writing yesterday about the Productivity Commission’s draft report on why firms don’t invest more (in “technology”), prompted me to take a look at the OECD’s Product Market Regulation (PMR) indicators. In the OECD’s own words
The economy-wide PMR indicators measure the regulatory barriers to firm entry and competition in a broad range of key policy areas, ranging from licensing and public procurement, to governance of SOEs, price controls, evaluation of new and existing regulations, and foreign trade.
There is both a summary economywide indicator (the focus here) and a range of detailed component indicators and sectoral indicators. As always with cross-country attempts to assess policy, the indicator(s) won’t be perfect, but such indicators can still shed some light on differences across advanced economies and across time – the OECD has published the data every five years starting in 1998.
Here are rankings for 1998. (On this measure, the lower the score the less burdensome -or whatever your descriptor – the product market regulation is.)
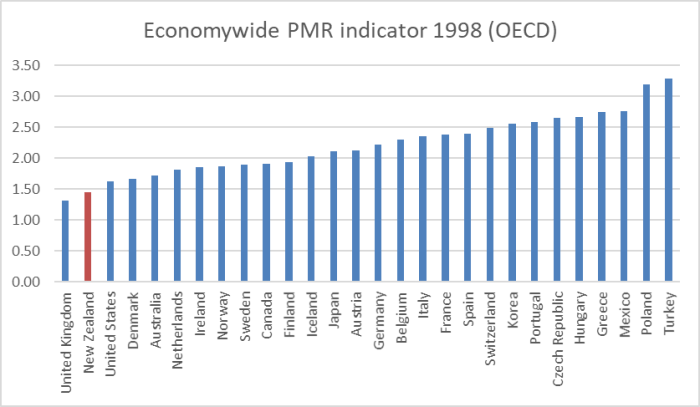
In the wake of those numbers, when people talked about the productivity performance in New Zealand you’d often here something like “well, our business regulation is less burdensome than almost anywhere in the OECD” so (among the optimists) gains will follow or (among those less sanguine) whatever the big issues are they seem unlikely to be those relating to product market regulation. A few years on we were still 2nd (in 2003) or 3rd (in 2008).
But by 2013 we were only ranked fifth. Perhaps not disastrous, but some slippage evident. And here are the 2018 numbers, fairly newly released (data for two countries still not there) assessing things as they stood on 1 January 2018.
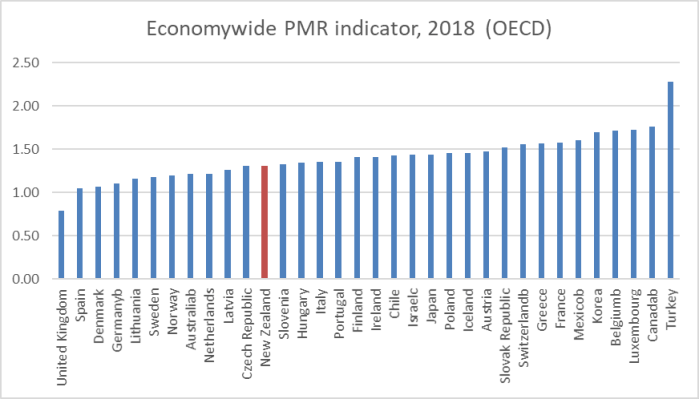
That is now a pretty unambiguous drop back in the rankings. And three former Communist countries now beat us, with another two just slightly behind.
And it isn’t as if New Zealand has just been improving a bit more slowly than the rest of the OECD. Here is the absolute score for New Zealand and for the median OECD country (no material differences if I used just the subset of countries for which there is a score on all five dates).
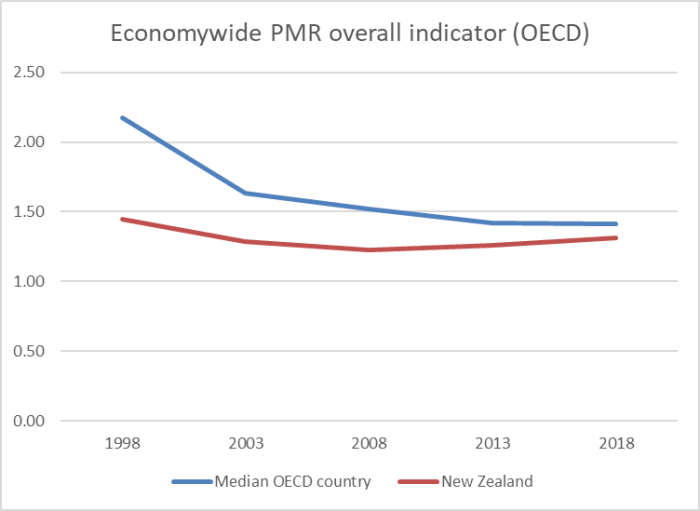
We’ve gone backwards, in absolute terms, since 2008.
I get quite a few comments whenever I write about productivity, suggesting that the web of regulation has been more constraining and all-encompassing over the years. I have a fair amount of sympathy with many of those comments, even while doubting that such regulations will explain much of our poor productivity performance. But in the PMR indicator we score poorly in a quite different area of government involvement.
The OECD publishes the data broken out into two “high-level indicators”. One is “Barriers to domestic and foreign entry” and the other is “Distortions induced by [direct] state involvement. Here is how we did in 2018 on the first of those.
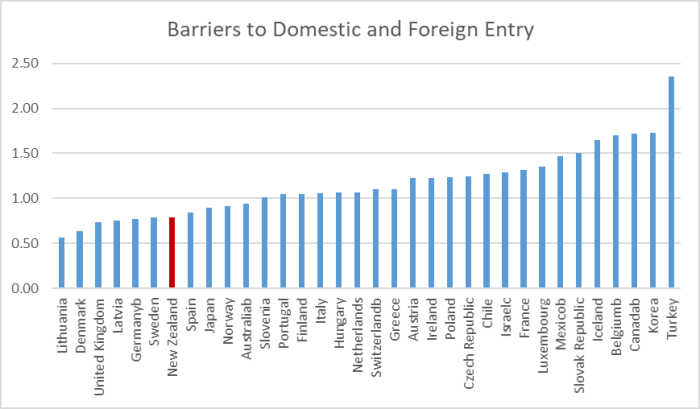
Not too bad I suppose – 5th equal, and very close to the couple of countries just above us.
But here is the other high-level indicator
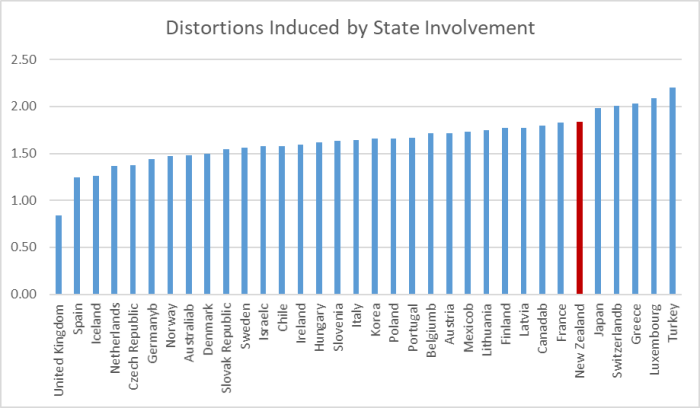
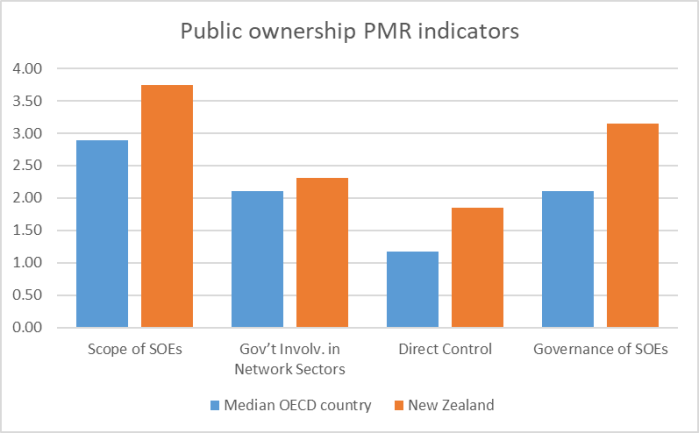
In turn, there are four sub-components to public ownership bit of this high-level series, and on each of them we score less well than the median OECD country.
On the “involvement in business operations” sub-components of the “distortions induced by [direct] state involvement high-level indicator we are the OECD median on one, and do a little than the median on the other two.
Of the other sub-components in the overall indicator, there were six where New Zealand scored materially differently than the median OECD country: three better, three worse. Of the “worse” ones, only six countries score worse than New Zealand, and on the FDI one (and I know the interpretation is contentious) we score worst of all: none look like the sorts of areas a small economy, with persistent current deficits, should aim to score poorly.
| New Zealand Worse |
| Assessment of impact of regulations on competition |
| Complexity of regulatory procedures |
| Barriers to FDI |
| New Zealand Better |
| Admin requirements on new companies |
| Barriers in service sectors |
| Treatment of foreign suppliers |
One could go playing around in the relevant spreadsheets (economywide, and the additional sectoral ones) at great length. Perhaps I will come to them in another post next week.
One can also debate just how much regulatory and state intervention poor scores really matter in terms of overall economic performance. It is no doubt easy to point to any of the sub-components and find some highly successful country scoring poorly. But when you are starting as far behind the leaders as New Zealand now is, then even if regulation and state control issues – of the sort captured here – aren’t the key factors, if we are serious about improving productivity we should be doing whatever we can wherever we can to provide a more facilitative climate for firms to prosper on their merits.
UPDATE: An OECD economist, in comments below, has helpfully drawn my attention to some methodological changes in the 2018 PMR which mean that scores cannot be compared (reliably) across time (the 1998 to 2013 ones should work, but there is a discontinuity to 2018). I think her comments leave most of this post looking okay (the relative rankings should still be meaningful, and the identification of where we now do poorly) but one should be a little cautious about the time series chart (noting, however, that the trends I was highlighting were already apparent by 2013).

So ACT is onto something with their red tape complaints? Lots of well-meaning myopic bureaucrats with no sense of the macro effects of individual policies is my educated guess.
LikeLike
Dear Michael,
your post is very interesting but has one flaw. As it is marked in the latest release of the OECD PMR indicators, the 2018 values are not comparable with previous vintages.
The methodology used in the latest update has changed considerably form the one used in the past. These changes have affected the content of the economy-wide indicator, as well as its structure and the way the data is scored. These changes have been introduced to ensure that the PMR indicator maintains its relevance in the context of evolving insights from economy theory, modifications in the economic and business environment, technological change, and modifications in the practice of regulation.
Hence, you can compare the 2018 values across countries, but the figure showing the movement of the PMR for NZ and for OECD average over time is incorrect and should not be relied upon to reach conclusions about trends, because the 2018 PMR values cannot be compared with previous ones.
LikeLike
Thanks for drawing my attention to that Cristiana.
LikeLike
It’s an interesting topic, but I have doubts about the credibility of the stats. I struggle to believe Germany ought to rank as highly as it does. However bad NZ has become, I cannot believe it scores behind various continental EU civil law jurisdictions listed.
Is there a possibility methodology or weightings change across the years? Some of the criteria seem to have a political dimension to their inclusion – e.g. public procurement… The EU demands transparency and equality of treatment among EU members for public procurement (itself generating vast amounts of billable hours for lawyers) – but I fail to see why that makes the legal system more “pro market”. I see spending public money being a democratic decision and more outside “freedom to transact” assessments.
Is it a case of the oecd measuring how much do you conform to our policy prescriptions, these being increasingly ordoliberalist ones rather than classic Anglo capitalist…
Or maybe it’s just like their Pisa education testing – just a random number generator?
LikeLike
Fair questions. Note that an OECD economist got in touch noting that there is some discontinuity between the results for 2018 and those for earlier periods. The rankings etc within the 2018 results are still valid, at least in OECD terms.
LikeLike
Medical servces in 1918 were non existent – you got sick you died – so no problem
Today – in a bad influenza season in the USA 60,000 die in a year.
That is 0.02% mortality rate
All of those who die have a prodrome of hospitalisation and very expensive care
If Corona inflcts a mortality rate of 0.2% – it would be sufficient to at best cause massive disruption to normal service provision – and at worst completely overwhelm health systems on a global scale
Currently the rate of assympotmatic infection is quite likely underestimated by a factor of 5 to 10 -which is why I chose 0.2%. mortality.
Regards
Andrew Montgomery GP.
LikeLike
Thanks (altho I think you’ve replied to the wrong post).
You may well be right – and in your scenario the econ consequences (as well as the human ones) would be less severe – but then at the moment no one has much basis for believing any of the PRC data (deaths or case, symptomatic or otherwise).
LikeLike
Sorry about that – if it could be transferred to the right place that would be more helpful of course
China is certainly unreliable – but is clearly terrified as manifest by their lockdowns.
The aggregate of epidemiologocal opinon is pessiimistic and the general thinking is that it will act like a flu virus pandemic.
The race is on to porduce a effective antiviralad that may wel happen – but it would not necesarrily impact suffciently upon hospitalisation and service displacement.
Once a vaccine is available -ie ina year or whatever -no problem
It is what happens between now and then that matters
The UK data is reassuriung while Singapore and Japan are not.
It will only be knowable over the next few weeks
LikeLike
i’ve put both your comments in a combined comment on the coronavirus post, link here https://croakingcassandra.com/2020/02/19/what-if-covid-19-things-get-really-bad/comment-page-1/#comment-48180
LikeLike
thankyou for doing that – I’ll have a look
LikeLike