I had to look up this morning where New Zealand ranked among OECD countries in the total share of GDP taken in taxes. The answer (for 2019) was 11th lowest, or 10th lowest if you (as you should, and as I do in the chart) use the denominator for Ireland (modified GNI) that the Irish authorities use.
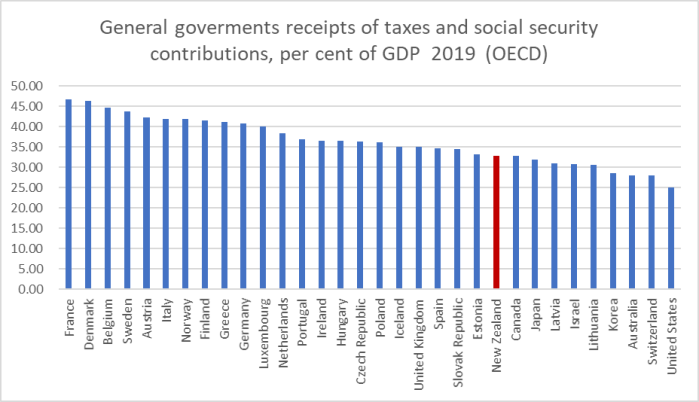
Among the English-speaking countries we often compare ourselves to, New Zealand and Canada are in the middle of the bunch, with the UK and Ireland higher and Australia and the United States lower. Note that these are “general government” figures, including all levels of government in each country.
What about the spending side of the picture? This is the chart for current spending across all levels of government.
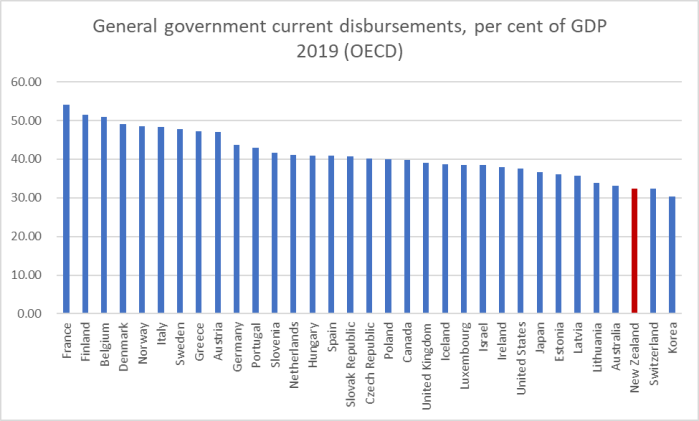
New Zealand is towards the very bottom of that chart. It is, however, fair to point out that when you have a low level of public debt you don’t face much an interest expense: in terms of current purchases or transfers our overall level of current government spending goes a little further relative to most other OECD countries (with higher debts) than it might first look.
The big outlier, of course, if you compare that two charts is the United States, with yawning budget deficits.
What about the changes over time? These OECD data only go back to 1986 for New Zealand, so I’ve started the chart from then showing (a) New Zealand, (b) the median of all OECD countries, and (c) the median for the OECD countries for which there is complete data from 1986 onwards.
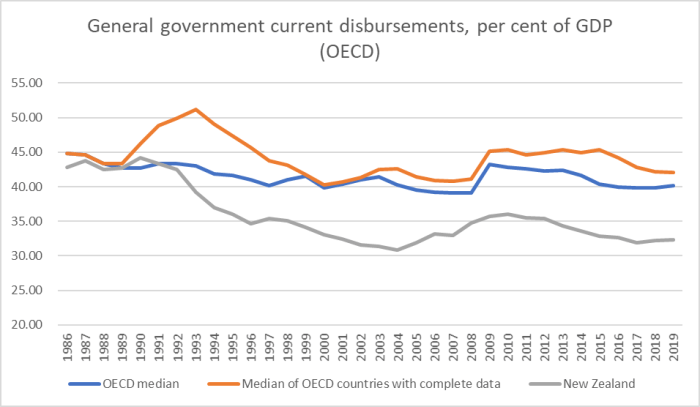
The gap between New Zealand current government spending and that in the median OECD country opened up 30 years ago. In fact, the gap between New Zealand and the consistent-sample grouping (the orange line) has fluctuated around a fairly constant mean since the early 1990s, with no obvious differences based on which of the major parties was leading the government.
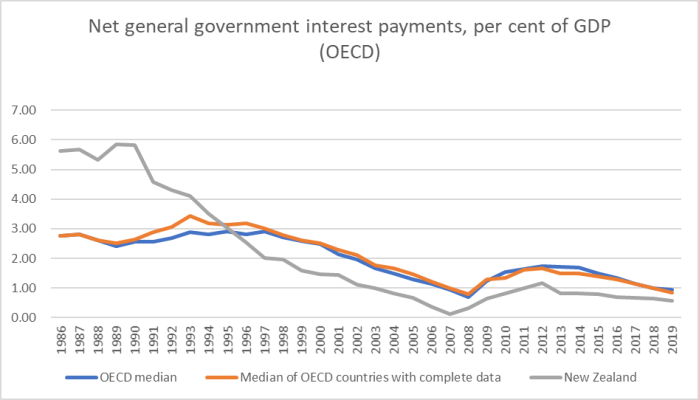
Of course, at the start of the period we still had fairly high debt and fairly high interest rates. But that factor doesn’t look to explain much about comparisons for the last couple of decades. This chart is of net interest expenditure as a share of GDP.
And what about changes in taxes (and social security contributions) over time?
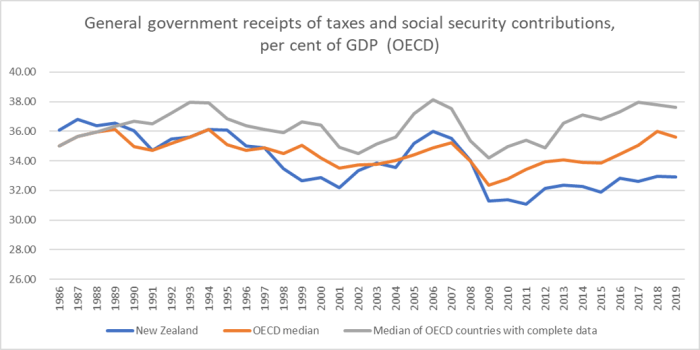
On this measure, the gap between New Zealand and the complete-sample group of OECD countries (grey line) has widened further over the last decade or so. Partly in consequence, whereas for the OECD as a whole (either series) the median country now has a higher tax share of GDP than it had in the late 1980s, we have lower taxes. Consistent with that, of course, we also have lower current outlays than we had then, but it looks as though much of the difference will be accounted for by (a) in particular, lower (real and nominal) interest rates, and (b) lower debt.
I’m not attempting to draw any strong conclusions, just presenting the numbers. They aren’t the only numbers that are relevant. For example, as I understand it, the current disbursements series does not include depreciation, so in some respects it would be better to look at total outlays (in New Zealand, with a fast-growing population, government capital expenditure tends to be quite high). Similarly the taxes and social security contributions series – while important in its own right – is not a measure of total government revenue. And I could track down the gross interest data and subtract that from the current disbursements series to get a consistent series of current primary spending. Perhaps another day.
For now, I think one can safely say that New Zealand government spending and revenue are below those of the typical OECD country. That wasn’t always the case, although much of what changed was servicing costs. Whether that relatively modest size of government (spending and revenue) is a matter for concern or celebration will, I guess, depend on your ideology, your view (implicit or explicit) of various key elasticities, and perhaps your sense – which should be detachable from ideology – as to how wisely and well existing spending is being done. For myself, I think there are areas where our government should probably spend more (health, access to justice, administration of justice, and statistics as just some examples), but I’m not convinced that even taken together they would amount to a strong case for higher taxes (when I think of potential savings – on NZS, free tertiary education, the PGF as just some high profile examples).
