The Herald’s wrongheaded call for an ever-bigger population

The Herald’s editorial today is headed “Population growth is powering NZ economy”.   It isn’t just a statement of the rather obvious, that a rapid growth in the population –  particularly unexpectedly rapid growth – boosts total GDP.    When there are more people, they all need to consume stuff, and they need houses, schools, shops, roads, offices etc.  And unexpected surges in the population boost demand more, in the short-term, than they do supply.    But they don’t do anything much to boost sustainable per capita real GDP.

That isn’t, of course, the Herald line.  Rather, channelling the Prime Minister, they assert that

The population increase is helping to generate the growth in the economy that puts New Zealand ahead of most other and larger economies at present, which in turn makes it a magnet for yet more migrants, as well as persuading more young New Zealanders to stay here.

There is so much wrong with this sentence, it is difficult to know where to start.  First, and repeating it slowly yet again, it is per capita economic growth that matters.  New Zealand has been doing quite badly on that score over the last year or so, even by comparison with other countries.  And as I illustrated yesterday, even on the Treasury’s own, optimistic-looking, numbers, we are expected to be only an average performer over the next four year.  Average isn’t necessarily bad, except that we are starting out so much poorer than most advanced countries, and not closing the gap.

And it isn’t as if jobs are abundant here either,  Our unemployment rate, at 5.7 per cent, is well above most estimates of the “natural” rate of unemployment, and not much below the median unemployment rate for OECD countries.    The number of residence approvals here is subject to a target, so even if there is increased demand from foreign citizens to move here, it only increases slightly the quality of the people we can take, not the total number.  Much of the variation results from two things.  The first is the inflow of students, probably influenced more by the policy change allowing most to work here while they study, rather than by the intrinsic strength of the New Zealand economy.  And the second is the flow –  mostly of New Zealand citizens –  to and from Australia.  Australia’s unemployment rate is also now quite high, at 5.7 per cent, and New Zealanders moving there don’t have access to the welfare safety net and associated entitlements they do at home.

The editorial goes on

The Government would not want to say this out loud, but clearly it is not controlling immigration as tightly as previous governments have done. This attitude undoubtedly comes from the Prime Minister and it is consistent with his disinclination to restrict foreign investment or even monitor its impact on the house market. He deeply believes the country is better off being open and connected to the world’s flows of capital, trade and people. The performance of the economy on his watch suggests he is right. Even the housing affordability is a cost of prosperity. If we want drastic steps taken to stop rising prices we need to be careful what we wish for.

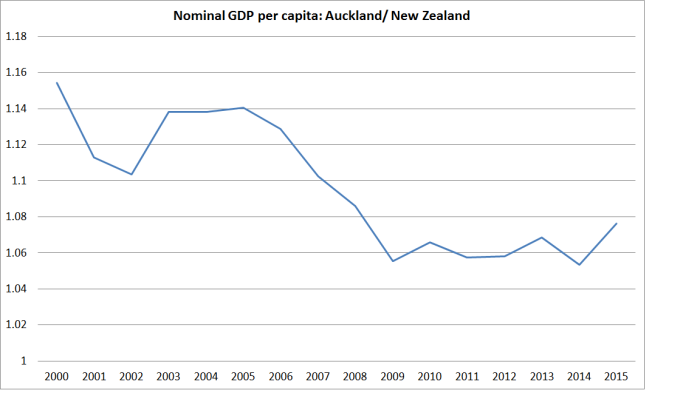
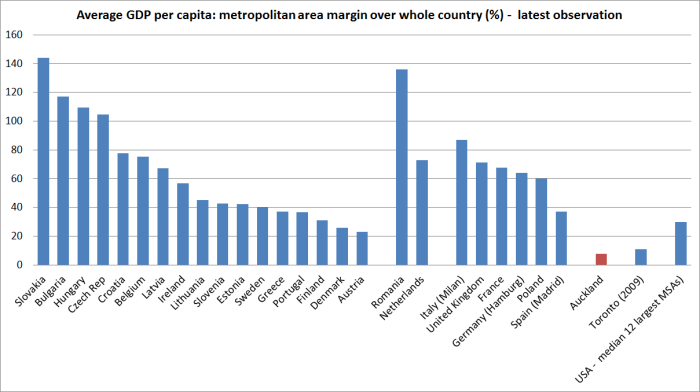
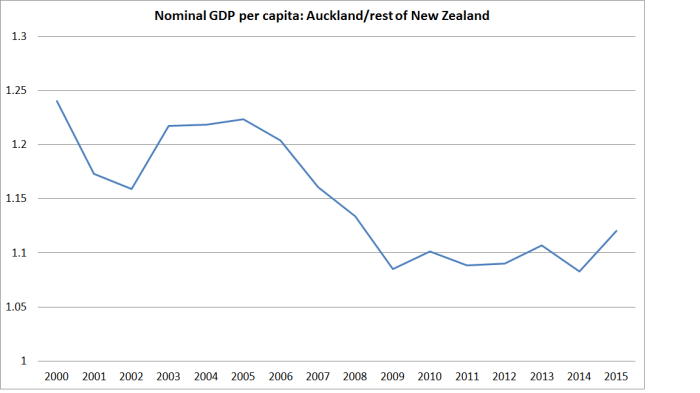
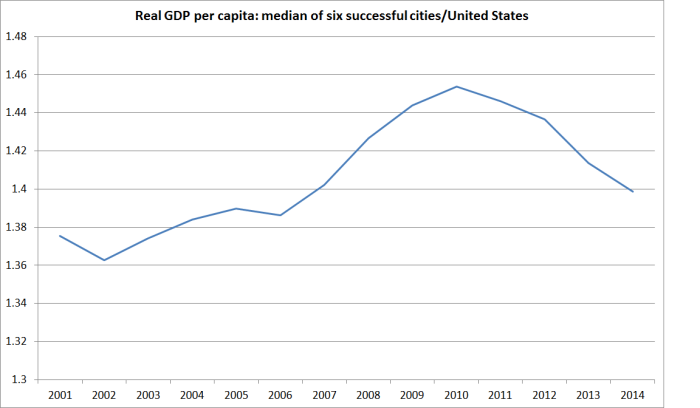
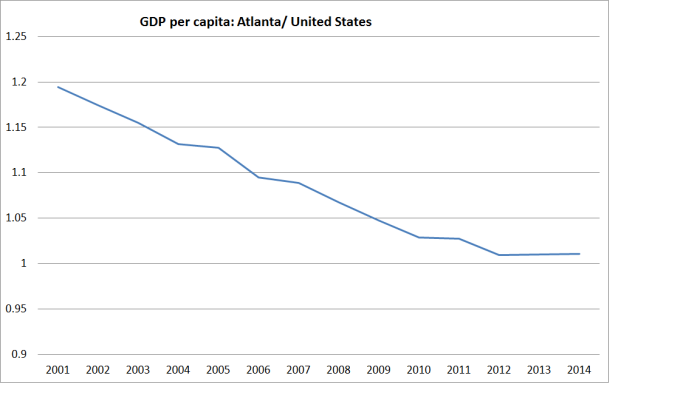
With the exception of allowing students to work, the initial claim here is simply incorrect.  The residence approvals target is the same as it was under the previous government, and even student arrivals have not reached the peaks seen under the previous government.  As for the rest, no doubt it accurately reports the Prime Minister’s views –  he has repeated them often enough –  but there is no evidence to support it.  Productivity growth –  the foundation of sustained long-term prosperity –  has remained disappointingly weak.  And the immigration inflows have been overwhelmingly concentrated in Auckland, and yet the official data show that Auckland incomes are (a) lower relative to those in the rest of the country than we see in most advanced countries (comparing dominant cities and the rest of the country) and (b) that that gap has been narrowing.  Whatever the reason, the strategy is failing.

From there the editorial launches off into its own alternative universe

New Zealand’s desirable population size has always been a contentious subject, though not previously an urgent question. The increase since the turn of the century followed 25 years of static population figures as more people left than arrived.

Immigration policy was a notoriously capricious. Each time the economy dipped, governments would close the door. Now that we appear to have a rapidly growing population again, we need to be discussing how high we want it to go, and how it might be channelled to regions that most need it, and the houses and services it is going to need.

This country would benefit from many more people, and better preparation for their arrival.

There was a period from the mid 1970s to the late 1980s when New Zealand’s population growth was quite subdued.  But for the last 25 years –  not just since the turn of the century –  we have had one of the faster population growth rates of the OECD.  One doesn’t have to take a view on causation to note that people haven’t exactly been flocking to an economic success story.  Incomes here are presumably better than they were in the migrants’ home countries, but our productivity growth rate over that 25 years has been among the very slowest in the OECD.  Starting low, we’ve just drifted somewhat further behind.

I’m also not sure where the author gets the idea that New Zealand “immigration policy was notoriously capricious”.  Yes, there are constant changes at the margin, but to a large extent we’ve been running much the same immigration policy for 25 years now, through several recessions, and some pretty sharp ups and downs in the labour market.  Much the same could be said of the post-war decades, until the Labour government in 1974 closed down automatic access for British and Irish citizens –  and that wasn’t because the economy was doing badly, but just because they thought immigration should be less focused on traditional sources countries.

Of course, I thoroughly agree that we should be having a national debate about immigration policy.  Policy has long been premised, explicitly or otherwise, on the belief that New Zealand would be better, and more productive, if only there were more people.     But there is just no evidence for that proposition, and certainly not enough on which to rest such a large scale economic and social intervention as our immigration policy.  Big countries don’t grow faster than small ones.  When we had 1 million people, there were calls for many more people.  And when we had 2 million people.  And when we had 3 million people. And so on.  And for decades our relative incomes and productivity performance have been deteriorating.  New Zealanders have been getting poorer relative to their advanced country peers.  I’m not sure where the advocates think the critical threshold is where things might turn around –  but clearly 4.5 million people hasn’t been enough either.

The editorial writer talks of channeling people to “the regions”, which is almost certainly even more wrongheaded than bringing in large numbers in the first place.  We’ve seen that in the policy changes the government made last year: giving more points to people with job offers from the regions simply has the effect of lowering the average quality of the migrants we do get, who (on average) have not been terribly highly-skilled in the first place.

Instead of constantly championing the case for ever more people –  even at the cost of encouraging New Zealanders to leave Auckland (a weird way to help people at the bottom) – it is about time there was a serious conversation that stopped pretending everything was fine, and confronted the facts of New Zealand’s economic underperformance, and Auckland’s economic underperformance.  Doing so would force people to think harder about whether there was much realistic prospect of New Zealanders benefiting from an ever-increasing migration-fuelled population.  I’m not suggesting a population policy –  fertility and emigration choices of New Zealanders are their own affair –  rather, the abandonment of the implicit “big New Zealand” population policy we have had through successive governments.   Pretty much everyone accepts (and it is an uncontested OECD empirical result) that our distance from markets (and competitors) is a material penalty, making it harder to generate really high per capita incomes in New Zealand.  There is still no sign that New Zealand is getting much traction in products and markets that don’t rely largely on our natural resources –  and utilizing those natural resources in ever smarter ways simply does not need lots more people. Why penalize everyone more by rapidly increasing the population of a country with such a disadvantageous location?

The Herald is right that without the unexpected surge in immigration total GDP today would be lower than it is.  But without the surge in immigration over the last few years then, all else equal, our interest rates would also be lower, and our exchange rate would be lower.  And New Zealanders as a whole would be better off, because more firms would be better positioned to sell products and services into world markets at competitive prices.  But, probably more importantly in the long-run, our largely fixed stock of natural resources, found on not-very-propitiously-located remote islands, would be spread over rather fewer people.  As a country we’d be better off, and lower Auckland house prices –  no doubt still distorted by unnecessary land use restrictions –  would be a beneficial mark of that success.  As it happens, the regions  –  where the natural resources mostly are (pasture, forests, mines, seas, landscapes) –  would loom larger relative to Auckland, curiously the goal that the Herald’s editorialist seems to espouse.


Scattered thoughts on the Budget documents

A Budget from a government that seems to have no real sense of how strong sustained growth in productivity and living standards arises was perhaps never likely to produce anything of great interest.  The cheerleading for the, demonstrably failing, “ever bigger New Zealand” approach –  failing, that is, to generate any sign of better productivity growth, perhaps especially in Auckland –  and the questionable rhetoric about a more diversified New Zealand economy, was accompanied by yet more claims that somehow New Zealand’s economic performance is better than those of almost all our advanced country peers.  Meanwhile, oppressive taxes are raised on some of the poorest people in the country, to fund pouring more money into things like KiwiRail, regional research institutes, apprenticeships, and high-performance sport.

I heard some comments on Radio New Zealand this morning about “ideological” approaches to spending, and in particular about the share of GDP devoted to core Crown operating spending.  Since politics is about conflicting values and ideologies, I wasn’t sure what the problem was.  But in any case, the tables in the BEFU (Budget Economic and Fiscal Update) suggest that the government plans that its operating spending in the coming year will be 29.9 per cent of GDP.  As it happens, that is also the average share for the three June years 2015 to 2017.  The average share in the last three years of the previous government was 30.2 per cent.

In the last three years of the previous government, taxes were probably too high.  The core Crown residual cash surplus –  which some of smarter people at Treasury encouraged me to focus on when I worked there – averaged 1.5 per cent of GDP over those years, 2006 to 2008.  By contrast, even on yesterday’s numbers there is no sign of a residual cash surplus until the June 2019 year, and over the three years to June 2017, the average residual cash deficit is expected to be 1.1 per cent of GDP.

Through some combination of fiscal drag and continuing savage tax increases on tobacco, and perhaps some cyclical effects as well,  tax as a share of GDP which had fallen as low as 25 per cent in the year to June 2011 is now just under 28 per cent.

International comparisons of spending and tax levels are largely impossible just using Budget numbers.  Countries calculate things differently, and I recall a painful few days once when I was inside Treasury trying to get from the OECD how they translated our numbers into their numbers.

But here are the latest OECD numbers, which use “total outlays” (not just operating spending) and are not done on an accruals basis.  I’ve shown spending as a share of GDP for the median OECD country and for New Zealand.  There is nothing very unusual about the path in New Zealand.  In levels terms, spending as a share of GDP is a bit below the OECD median, but it is also a bit above the median for the other Anglo countries (only the UK is higher).

gen govt outlays 2016

And here is the same chart for revenue.  Again, nothing stands out about New Zealand’s path.

gen govt receipts 2016

Of course, a notable difference is in the deficit/debt position.  We were better-positioned than most going into the recession, and eight years on we are also better-positioned than most.  In one sense that is a legacy of successive governments going back 30 years, but then legacies are only preserved if each successive government makes sensible decisions.

That is fiscal policy.  But in many ways it was the Treasury economic forecasts that accompanied, and underpinned, the fiscal numbers that got me most interested.  Several other economists have noted that they seem to err on the optimistic side.  That is my fear too.

But I was also interested in the starting point.  According to Treasury, we currently have a negative output gap of 0.9 per cent of GDP. That is a little larger than the estimated gap a year ago, and the gap is expected to just as large in a year’s time as it is now.  And that on the back of negative output gaps every year since the 2008/09 recession.

There is a lot of imprecision in these estimates.  But the idea that there is still excess capacity in the economy –  7 years on from the recession  – seems quite plausible.  After all, the unemployment rate is 5.7 per cent, and Treasury (quite plausibly) thinks a “natural” rate of unemployment (given the structural features of the labour market, the welfare system etc) is around 4.5 per cent.  That used to be the Reserve Bank’s long-term NAIRU estimate too.    And as we know, inflation has been very low, persistently undershooting the midpoint of the inflation target (after persistently overshooting the target for most of the previous two decades).  If Treasury is right, it is a pretty sorry commentary on the conduct of short-term macro policy in New Zealand.  And that, not to put too fine a point on it, has been Graeme Wheeler’s responsibility for the past four years.  I continue to be a bit surprised that the Opposition doesn’t point these things out.  People have been unnecessarily unemployed because of the choices/judgements of the Governor.

But in terms of the Budget, it is probably the projections from here that matter more.  Treasury expects real GDP growth rates to average 2.9 per cent over the next four years.  But it isn’t really clear how or why.

It doesn’t seem to be from the effects of macro policy. The fiscal impulse over the forecast period is estimated to be slightly contractionary.  And they seem to have allowed only one more cut in the OCR, but they recognize that inflation expectations have been falling, so real interest rates are going to be no lower than they were a couple of years ago before the ill-fated tightening cycle.  The exchange rate has come down quite a bit, and perhaps they are assuming some quite powerful lagged effects from that fall.  They assume some recovery in the terms of trade, but nothing as dramatic as the increase in dairy prices a few years ago.  And, on the other hand, the level of repair and rebuild activity in Christchurch –  a major impulse to demand for several years –  will be fading.

And then there is immigration. As everyone recognises, the unexpectedly large net immigration flows over the last few years have been a significant boost to total economic activity.    Treasury assumes –  fairly conventionally –  a sharp fall in met migration inflows, from 71000 in the June 2016 year, to only 19000 in the June 2018 year.  But there is no assumed change in immigration policy, and so the assumed change in net arrivals must all be endogenous to relative economic performance and opportunities.  And yet, they aren’t forecasting much of a pick-up in Australia.  To me, something doesn’t quite add up.  How are we going to get a sustained growth acceleration here –  producing per capita real GDP growth almost as fast as in the period from 1991 to 2007/08 (ie after the reforms and through the massive credit expansion) –  with a pretty sluggish world economy, and all with a substantial negative impulse coming from a sharp cut in the population growth rate?

There is so much uncertainty about medium-term forecasts, that any of these numbers could turn out right.  But they don’t look like the most plausible story to me –  and seem too reliant on just assuming that things finally come right.  If so, they don’t represent the most plausible basis for thinking about future fiscal policy options.  Frankly, I’d be a bit surprised if we ended up with incipient surpluses in the next few years any larger than the modest positive balances the government has right now.   I remain very skeptical of the case for keeping the New Zealand Superannuation Fund in existence, let alone putting more money into it at this late date.  But if my doubts about the macro outlook prove well-founded, then the date for resuming contributions –  already almost a decade on from the NZS eligibility age for the first baby-boomers –  will fortuitously be pushed further into the future.

Among the spin yesterday was the continuing claim from ministers and the Prime Minister that New Zealand’s economic performance is better  –  and will be better, on these Budget economic numbers – than that of most of our advanced country peers.  As I’ve pointed out numerous times before, our growth rate for total real GDP isn’t bad by international standards (while remaining weak by historical standards), but that almost entirely reflects the very rapid population growth.  Per capita growth has been very weak by international standards in the last 12 months or so.

How about the outlook?  I downloaded the latest IMF WEO forecasts for advanced countries. Here is a chart showing forecast growth in real GDP per capita for the next four years (calendar 2019 over calender 2015). For New Zealand, I’ve used the Treasury BEFU forecasts for the four years to June 2020 – ie four years from now –  although as it happens the IMF forecasts for New Zealand aren’t much different.

imf weo gdp growth

On these numbers, New Zealand is doing not too badly.  Our forecast growth rates are very close to those of the median country, very similar to the US and UK (among G7 countries) and Sweden and Denmark (among countries nearer our size).  Which is fine in its way but (a) as I’ve noted, the New Zealand forecasts look rather optimistic, and (b) given our starting point, so much poorer than most of these countries, a successful economic strategy would have involved rather faster growth rates.

Slovakia, for example, might be an achievement to aspire to.  On these IMF numbers, between 2007 and 2021 Slovakia will have recorded almost 43 per cent growth in real per capita GDP, while we’ll have managed 15 per cent.   After decades of Communist rule, Slovakia started a long way behind New Zealand.  It has already matched our real GDP per hour worked, and looks likely to be moving past us.

We don’t have very much positive to write home about.


Nationbuilding?

Whenever I hear the term “nationbuilding”, and particularly when calls come for this or that programme in the name of “nationbuilding” I shudder somewhat. I spent some time working in southern Africa in the 1990s, and after-effects of the disastrous “nationbuilding” programmes of people like Kenneth Kaunda and Julius Nyerere were already apparent.  Since then, the sheer awfulness of Hastings Banda and Robert Mugabe have also become increasingly obvious.   “Nationbuilding” has a ring of something post-colonial, whether in Africa or Latin America, and (to me) a ring of persistent failure.

New Zealand has had its share (perhaps more than its share) of “nationbuilders”, people who seek to use the power of the state and its (our) resources to pursue one or another vision of what the country could become. There was Julius Vogel with the massive debt-fuelled expansion.  And Sutch/Savage/Nash, financially fairly austere perhaps, but with a vision of an insulated New Zealand with a large manufacturing sector (those 22 TV factories). We’ve had NZ Steel and Tasman Pulp and Paper –  and the Raspberry Marketing Council.   We’ve had those who actively encouraged (and even subsidized) large-scale immigration.  We’ve had the Think Big strategy of Muldoon and Birch.  And latterly another wave (of decades-length) of large scale (supposedly) skills-based immigration, supposedly as a “critical economic enabler” –  as if somehow the people we have aren’t really “good enough” for those holding the levers of power.   And there are all sorts of other programmes that fly a bit further under the radar –  film subsidies for example, or grants to those who capture the imagination of bureaucrats –  or which simply never managed to command enough public support in time (the slightly younger Roger Douglas’s call for sixteen state-funded carpet factories).  Each of these programmes that has been implemented made a difference, but how many of them were for the good is, at very least, an open question (my provisional answer is none of them).   And if they weren’t good, there was almost no effective accountability for any of the designers.

I pulled off my bookshelf this morning Brian Easton’s 2001 book The Nationbuilders, 15 profiles of people Easton saw as having “shaped the New Zealand nation in the middle years of the twentieth century”.  They are mostly political and bureaucratic figures, or people whose contribution was around politics and policy.  None was particularly market-oriented (Coates and Muldoon appear, both from the activist ends of their respective centre-right parties).  One major business figure was profiled –  James Fletcher – but even his success was in no small measure down to the huge government construction projects.  Oh, and there was Dennis Glover, who founded Caxton Press.

Which is a somewhat longwinded introduction to an article in the Dominion-Post a few days ago in which Shamubeel Eaqub called for this week’s Budget to be a nation-building one.  It wasn’t simply a line in passing –  the phrase appears three times in a not-overly-long column.  In this case, “more public debt” is the call –  in this case to build houses (30s revisited), public transport, and “rail in critical infrastructure corridors” (1870s revisited).

He continues

The reality is that the current expenses or lost revenue could be easily redirected into debt repayment to fund some serious amounts of new investment.

If we raised a 100 year bond, as Ireland has done recently, we could probably borrow about $30b for every $1b in debt repayment. Incidentally we spend about $1b a year on accommodation assistance. Redirected to borrowings, we could perhaps build about 82,000 houses on existing Housing New Zealand land in Auckland.

Set aside for the moment the long track record of poor quality government capital investment –  not just here but abroad – and then consider a key difference between Ireland (and Belgium which also recently issued a 100 year government bond) and New Zealand.

First, both have very high levels of government debt (general government gross debt in excess of 100 per cent of GDP) and so the idea of locking in some of that debt for a very long time must seem quite attractive to the respective debt managers.  Neither country seems to be launching an expansionary fiscal policy with the proceeds.

And second, there is quite a difference between the price of Irish or Belgian debt, and that issued by the New Zealand government.   Belgium issued its 100 year bond at a nominal yield of 2.3 per cent.  Ireland issued its at 2.35 per cent.  The ECB has an inflation target of just under 2 per cent, and inflation in last 25 years has averaged 2.2 per cent in Ireland and 2.0 per cent in Belgium.   At most, a reasonable estimate of the expected real interest rate over 100 years is perhaps 0.5 per cent.   That should represent quite cheap borrowing (although whether it is really cheaper than a succession of 10 year bonds only time will tell).

What of New Zealand?  We don’t have a 100 year bond.  But the New Zealand government does issue quite long-term inflation indexed bonds. A bond with 14 years to maturity has a yield of around 1.82 per cent, and one with 19 years to maturity yields around 1.93 per cent.  The implied 5 year rate in 14 years time (ie the last 5 years of the 19 year bond) is around 2.2 per cent.  Who knows at what yield the New Zealand government could issue 100 year bonds (having taken all the inflation risk back on itself) but it seems unlikely that it would be less than 2.5 per cent.   That is a huge difference in likely real borrowing costs from those European sovereign issuers.  And yet Eaqub proposes we borrow to spend (“invest”) at those high yields, even though the real productivity performance of the New Zealand economy over decades has been far inferior to that of either Belgium or Ireland.   In our case, a 2.5 per cent real interest rate not only materially exceeds past and likely future productivity growth rates, it may even exceed the likely future rate of real GDP growth.

For the government to borrowing at 2.5 per cent real might look reasonably attractive if the benchmark is New Zealand interest rates over, say, the last 25 years.  But being in debt at all, as a government, should have been extremely unattractive during that period given how high New Zealand’s interest rates have been (and, laudably, successive governments markedly lowered our public indebtedness).  Perhaps a long-term real borrowing rate of around 2.5 per cent real might be borderline attractive if we could count on excellent governance and disciplines and an assurance that projects would be subject to rigorous cost-benefit analyses.  The track record on that score isn’t promising.

On a perhaps-related issue, Treasury last week released a series of blog posts on the financial return to the Crown from its investment in Air New Zealand, from the time of the Crown bailout in 2001.    As a purchaser of last resort (in late 2001, post 9/11, no one was keen on airline shares), the Crown should have got quite good entry levels.  And Air New Zealand remained listed on the stock exchange, with minority private interests throughout the subsequent 15 years, ensuring some level of ownership-based market discipline.  Air New Zealand is widely regarded as a very well-managed successful airline, and for now is riding the back of relatively low oil prices and an upsurge in inbound tourism.

Over the period since 2001, the nominal 10 year government bond rate has averaged 5.3 per cent.  And yet the internal rate of return the Treasury analyst calculated on the Crown’s investment has been 8.4 per cent per annum –  and much of that is unrealized, and dependent on the current, still relatively high, Air New Zealand share price.    Buy the entire equity index and I suspect few investors would regard a 3 percentage point equity risk premium as reasonable (from memory, historic market estimates are typically in a 4- 7 percentage point range).  But Air New Zealand is not as risky as the index as a whole –  it is far far more risky.  Government debt financed that Air New Zealand investment, and taxpayers don’t seem to have gotten a remotely adequate compensation for the risk they assumed, even in an industry with lots of competition and market disciplines.  It isn’t clear why advocates of large scale borrowing now – in a country with still quite high real long-term interest rates –  think they would do better in generating economic returns.

So-called “nationbuilding” projects have usually been a way of wasting (with a fairly high degree of confidence) the nation’s resources in pursuit of some politician’s or economist’s pet vision.  Government don’t –  or perhaps rather shouldn’t –  make nations, and in particular they certainly don’t make the wealth of nations.  That is down to individuals, firms, and the networks of society.  There is an important role for government –  and whatever government does needs to be done as well (or least badly) as possible – but “nationbuilding” as a call seems no more likely today to result in a good, high-yielding, projects, than it did in 1870 or 1980 or 1935 or……

Alternative narratives

From time to time people who are persuaded by my story about New Zealand’s economic underperformance ask why it hasn’t been more widely accepted, and the policy implications adopted.

And, of course, there is a variety of good reasons.  They include:

  • my own story/analysis is quite recent and is continuing to evolve.  I’ve spent over 30 years as an economist, but central bankers mostly focus on the short-term.  It was really only two years spent at Treasury from 2008, and my involvement there in helping the 2025 Taskforce, that energized me to start thinking hard, and reading widely, on the issues around New Zealand’s long-term economic underperformance.   The first time I wrote anything down on any of this was 2010, and it hasn’t exactly been a fulltime occupation since then.   The presentation I gave last Friday has quite different emphases in some important aspects than the first public presentation  of related ideas that I gave in 2011.
  • it is a competitive market in ideas, and there is a variety of competing narratives around to help explain our underperformance, and what (if anything) might be done to remedy it.   Some have had considerable resources put into them, and others are less formal.  Some are produced under important and influential ‘brands”.
  • it is not as if the problems are new.  It is now more than 50 years since the first major reports were published on New Zealand’s relative economic deterioration (eg the Monetary and Economic Council in 1962).   Many stories have been told, and explanations attempted, in the subsequent decades.  Various strategies have been tried since then –  some well-founded, and others daft –  and the decline has not been fully arrested, let alone reversed. In some ways, I think that experience leaves people a little jaded, disillusioned, and perhaps rather wary.

What are some of the alternative narratives?

Treasury is probably the organization that has put the most resources into exercises of this sort (and, of course, it is the New Zealand organization with the most resources).  Prior to the last election they put a lot of effort into a disciplined process reviewing the arguments and evidence in a range of areas, including getting contributions from people elsewhere in the public sector in particular.  The public face of what they produced was Holding On and Letting Go, part of their post-election advice to the Minister of Finance.  There was also a substantial (60 pages) and more specific paper for the Minister of Finance done in late 2013, (which has been released to me under the OIA but does not appear to have been put on the Treasury website with their other OIA releases), which grouped policy recommendations under nine headings.   Treasury has come and gone a bit on what it emphasizes but savings, public pensions, and problems with macro policy loomed large back then.

One could also think of the 2025 Taskforce’s reports in a similar vein.  With a lot fewer resources, those reports represent a story about what could, and should, be done to reverse New Zealand’s economic decline.  The Taskforce itself summed up the essence of its approach

 The key elements of the Taskforce’s approach are:

  • Significantly cutting government spending and tax rates.
  • Finding better, more effective, ways of ensuring the delivery of services the government does fund. „
  • Substantially improving the rigour with which government spending proposals are evaluated.
  • Substantially improving, across the board, the quality of economic regulation. „
  • Getting government out of the ownership of business assets

It was a “smaller and better government” prescription.  When I read through the specifics again this morning, I don’t find many I disagree with, and there is much I would strongly endorse.  But when the work of the Taskforce was over, I was left with a sense of “important as some of these issues may be, it doesn’t seem quite enough”.  Whatever one’s judgement on the appropriate size of the state, for example, that in New Zealand doesn’t seem unusual.

The Productivity Commission, mostly focused on specific inquiries assigned to them by Ministers, has also been turning its attention to trying to answer the question of how to lift New Zealand’s productivity growth.  Paul Conway, the Commission’s director of research, gave an oral presentation to last year’s NZAE conference, and it will be interesting, in time, to see where the Commission as a whole lands, in both diagnosis and prescription.

And no doubt there are others.  Roger Procter, the thoughtful  former (recently-retired) Chief Economist at MBIE had some interesting analysis and views on appropriate policy to reverse New Zealand’s underperformance.  Philip McCann’s analysis created significant interest a few years ago (and my own views are probably less far from his than I realized at the time), and the New Zealand Initiative –  while not, that I’m aware, having a fully worked-out framework for thinking about our underperformance –  would also probably emphasise smaller government and more open markets (people and capital).

And there are also the overseas prescriptions, notably the biennial advice of the OECD.  The OECD has long been somewhat puzzled by the underperformance of New Zealand –  we were somewhat embarrassing because in some respects by the early 1990s we were almost their best pupil.  Their analysis and prescription tends to be a modern social democratic one (open markets and lots of smart active government), and in my judgement hasn’t really got beyond treating New Zealand as if it were another small northern European country.

I’m not going to go through each of these diagnoses or prescriptions here  today (let alone ones from decades past, like the major World Bank report on New Zealand in 1968), Having said that, I always used to stress to staff that it was no use beating a caricatured straw man version of an opponent’s argument –  one had to engage with the strongest and best arguments that people could mount on the other side.  So perhaps I will spend some time as the year goes on working through some of these other documents and explaining why I haven’t yet been persuaded by their (often quite different from each other) stories.  I might also highlight the aspects of my own story that I’m relatively less comfortable with.

All of which is a long-winded way of saying that it is not as if my ideas, or those of any new contributor, are coming into a vacuum.  Able people have been trying for a long time to develop stories, and prescriptions, that best fit the collection of New Zealand economic stylized facts.  Different people emphasise different subsets of those stylized facts, which can often mean that it feels like quite different, unrelated, conversations are going on.  Each perspective probably has some useful policy presciptions to offer, but most probably won’t make a difference on the scale that is required.  Will mine?  I think so, but advocates of some of the other approaches no doubt think that is true of their models as well.

And it is also worth recognizing that any set of existing policies in place gathers vested interests in support.  That will be quite a mix: in some cases it might just be people who benefit financially (as those with import licenses in earlier decades were reluctant to see that policy changed), but more often it will probably be about the emotional and intellectual investment in a way of seeing the problems, and remedies.  We are all prone to those sorts of biases, and they are hard to overcome –  I wrote, with some conviction, the section of the first 2025 Report on why size and distance were cop-out explanations and I wince a little now when rereading that.  In respect of my own analysis, a “bigger New Zealand” mentality has pervaded political and economic life in New Zealand for a very long time. If it is misguided, as I think, it is not likely to be a sentiment that is abandoned readily, at least absent some sort of crisis.

On a slightly different note, I’d recommend people read (economist and economic historian) Deirdre McCloskey’s piece from the Wall Street Journal the weekend, ‘How the West (and the Rest) Gor Rich’, drawn from her new book Bourgeois Equality, the final in her massive trilogy of works in this area.  I rather liked the last few paragraphs, which remind us that politicians –  and policy analysts –  don’t generate our prosperity.  But they can –  and too often have –  got in the way of such prosperity.

What public policy to further this revolution? As little as is prudent. As Adam Smith said, “it is the highest impertinence…in kings and ministers to pretend to watch over the economy of private people.” We certainly can tax ourselves to give a hand up to the poor. Smith himself gave to the poor with a liberal hand. The liberalism of a Christian, or for that matter of a Jew, Muslim or Hindu, recommends it. But note, too, that 95% of the enrichment of the poor since 1800 has come not from charity but from a more productive economy.

Rep. Thomas Massie, a Republican from Kentucky, had the right idea in what he said to Reason magazine last year: “When people ask, ‘Will our children be better off than we are?’ I reply, ‘Yes, but it’s not going to be due to the politicians, but the engineers.’ ”

I would supplement his remark. It will also come from the businessperson who buys low to sell high, the hairdresser who spots an opportunity for a new shop, the oil roughneck who moves to and from North Dakota with alacrity and all the other commoners who agree to the basic bourgeois deal: Let me seize an opportunity for economic betterment, tested in trade, and I’ll make us all rich.


Location matters

That was, more or less, the theme of my talk to the Fabian Society in Wellington last night.

I outlined some of things that seem to matter in explaining which countries prosper and which ones don’t.  The people and the “institutions” they develop, or adopt, matter most of all.  But natural resources also do –  note, for example, the contrast between the GDP per capita in Sweden (high) and Norway (materially higher).  But location, or geography also seem to matter. Once, much of that was about access to navigable waterways, and perhaps some climatic issues.  These days it seems to be more about proximity.  Whether in the past or present, one just doesn’t find many really prosperous places, or many people living in those places, at the peripheries.  As I noted

the total population of Kerguelen, the Azores, Hawaii, Seychelles, Fiji, Iceland, Tasmania, Reunion, St Helena and the Falklands is just a bit less than New Zealand’s.

If anything, proximity and personal connections seem to have become more important, not less.  Quite why this should be so, despite the rise of communications technology, isn’t entirely clear to me (it must be something about the nature of the products/services), but that it is so seems evident in the continued economic outperformance of big cities, even in already-advanced countries.  That puts New Zealand at a big disadvantage –  we have able people, a moderate level of natural resources, but are a very long way from anywhere.  And the stock of natural resources is largely fixed, and doesn’t need lots more people to make the most of (indeed, often fewer people –  think of how many more cows an average farmer can run now, compared with the situation a century ago).   New Zealand just isn’t a very natural place for many global businesses to develop successfully, or to stay.

The Treasury was the first organization really to capture my attention on the significance of distance.  About 15 years ago they drew a useful comparison:  if one drew a circle with a radius of 1000 kms around Wellington one would capture (now) 4.5 million people and a lot of seagulls, but the same circles drawn around northern European or Asian capital would encompass hundreds of millions of people.  But it is puzzling that Treasury doesn’t seem to have taken that point and applied it in thinking about the appropriate immigration policy for New Zealand.  They tend to ignore the market signal (the hundreds of thousands of New Zealanders (net) who have left), and also ignore the logic that if distance is, in effect, a tax on economic prosperity here, it isn’t obvious why one would set out, as a matter of policy, to expose even more people to that tax.    Nothing of these ideas was in the recently-released Treasury material that I wrote about the other day.    Implicitly, Treasury and MBIE immigration policy advice- and the advice of bodies like the OECD (perhaps more pardonably, located in the heart of Paris) –  is being formed as if New Zealand were moored just off the coast of western Europe or North America, or perhaps even in the South China sea.  They need to take more seriously the fact that these islands are in the middle of nowhere.  High value economic activity takes places on such islands, but mostly only stuff that is location specific –  the iron ore is in the heart of Australia, the fish stocks are off the coast of New Zealand etc.  But it is really hard for modern, non-location specific businesses, to develop, and be the best they can be, in such a remote location.  It isn’t specific to New Zealand –  check out those other remote islands too.

But we make it all the harder for anyone with the drive and ideas to develop such firms.  Having persistently the highest real interest rates in the advanced world, and a real exchange rate that never sustainably adjusted down following our decades of relative decline, just further skews things against the prospects of the tradables sector.  Business investment has been consistently modest.  And the Think Big mentality, of bringing in enough –  modestly skilled –  migrants each year to have given us one of the faster population growth rates in the OECD, both reinforces those pressures on real interest and exchange rate –  resources have to be used to accommodate a growing population rather than enriching the existing population –  but also ensures that the fruits of the largely fixed stock of natural resources is spread over ever more people.  In effect, we trade away one of our few advantages.

I argued that we need our politicians and their advisers to both take more seriously the constraints of our location, and abandon the sense –  embedded in the New Zealand psyche almost ever since first European settlement –  that we need more, and more, people.  There is simply nothing wrong with a country of around 4 million people.   There are plenty of successful small countries.  For many of them perhaps it is more of a discretionary choice. At such distance from world markets, mostly trading on our ability to apply smart ideas to natural resources, it is much more of an imperative –  at least if we are serious about trying to give our people material living standards that match those of the better-performing OECD countries.

Anyway, here is the text I spoke from. It was delivered to the Fabian Society –  where we had a good discussion and lots of questions.  But for readers skeptical of the left-wing audience, it is almost identical to what I would say on these issues to an audience anywhere else on the political spectrum.

Fabian Society speech 20 May 2016

As ever, comments (and questions) are most welcome.


Sometimes I wonder….

There is always plenty in the newspapers to disagree with, but over the last couple of days a couple of pieces from the Herald particularly caught my eye.

On Wednesday there was an editorial supporting a focus on reducing government debt rather than tax cuts.   It culminated in this paragraph

The economy continues to enjoy stronger growth than most in the wake of the crisis more than seven years ago. With continuing high net migration gains, good numbers of tourists and rising returns from non-dairy exports, notably beef and wine, next week’s Budget will present a bright picture. It needs to do something more to contain house prices but that problem, too, is a symptom of economic success. New Zealand is attractive to migrants and investment because much of the world is so slow to finally recover from the crisis. When they do, our fortunes could change.

Where to start?    As I’ve pointed out before there is nothing impressive about New Zealand’s growth or productivity record even since the 2008/09 recession –  we had a serious recession, actually a double-dip in 2010 too, and have since had a sluggish recovery.  Headline GDP growth rates haven’t been bad by international terms, but per capita growth – surely what counts –  remains unimpressively weak.   And for all the talk about some individual sub-sectors doing well in exporting, per capita tradables sector production is no higher now than it was 15 years ago.

T and NT components of real GDP

And then there is the Prime Minister’s talking point –  house prices are a symptom of economic success.  Well, no.  They are a symptom of regulatory failure, compounded by an immigration policy that draws in lots of people –  not even to a successful city, but one where GDP per capita has been falling, relative to the rest of the country for 15 years.  Moderately wealthy countries will never have trouble attracting migrants if they want them –  there are always poorer places than us (eg, in the current New Zealand context, China, India and the Philippines).  A better sign of economic success might be if the New Zealand diaspora started returning –  but even last year, there was a (modest) net outflow of New Zealanders to Australia, an economy with its own problems.

I’m not sure what the editorial writer had in mind when he spoke of New Zealand being “attractive to investment”.  It is well known that rates of business investment in New Zealand have been very low for a long time.  Perhaps the writer had in mind non-resident purchases of New Zealand houses?  If so, again it is hardly a mark of  economic success to have a more secure environment, subject to the rule of law, than China.   Most countries –  rich, poor, and middling –  probably do.    And other countries have been “so slow to finally recover from the crisis”?   Really?   What has always been striking is quite how weak New Zealand’s performance has been, especially as it was not directly involved in the financial crisis (and associated losses) itself.  The weird narrative that we’ve done well is just contradicted by the facts –  unless perhaps Greece is the benchmark people have in mind,

Now, I agree with the leader writer that no doubt there will be another recession along before too many years pass, and it is wise to be fiscally cautious.  But if these are the “good times”  – unemployment still at 5.7 per cent, per capita incomes up only about 5 per cent over the eight years since just prior to the recession –  it is scarcely an encouraging story.

The other piece that caught my eye was on the front page of the Herald’s Capital Markets supplement.  In an article written by Fran O’Sullivan, Scott St John the head of investment banking firm First NZ Capital proclaims the death of distance.

The tyranny of distance has now turned into an advantage and in an infrastructural sense I hope we are bold enough and aspirational enough to capture that opportunity.

But I looked through the rest of the article, and found not a shred of argument or evidence in support of this proposition.

Yes, there was an argument for a while that falling communications costs etc would be the “death of distance”,  and for some individuals that is probably so.  But for economies as a whole, it just looks as though the argument, however reasonable it seemed when it was first made, was just wrong.  Location and personal connections seem to be mattering more than ever.  If it were not so, why would we see the average GDP per capita of big cities around the world still rising relative to those of the countries they are part of?    I illustrated the point in a series of posts last week (here and here).

As a reminder, New Zealand has spent decades slipping behind the advanced country pack we once led.  And there is still no sign of that turning around, despite all the “aspirational” policy initiatives successive governments have adopted.  And Auckland –  home of Mr St John’s business –  has underperformed even New Zealand.  Despite all the policy focus on Auckland, over the 15 years for which we have data per capita GDP in Auckland has been shrinking relative to that in the rest of the country, not growing.

St John cites “a few champions who are growing their businesses from New Zealand”.  He offers two names.  The first is Fisher and Paykel Healthcare (on whose board he sits).  It seems to be quite an impressive company, but total revenues last year were $672 million.  At least, that firm is highly profitable.  His other example is Xero.  I wish Xero well but  total revenue last year was $124 million, for losses of $70 million: it is small, success (turning a profit) yet unproven, and with a fairly high likelihood that if it succeeds it will eventually be taken over and relocated abroad.   In a sense, the (short) list illustrates the challenge.  This remains a natural-resource oriented economy.  That isn’t necessarily a bad thing, and is probably largely a reflection of location and distance.

And for all the talk of tourism –  the upbeat story of the year – services exports as a share of GDP are still less than they were 15 years ago.

services X to GDp since 1991

In fact, the latest observation was bang on the average for the last 25 years.  Successful countries almost always become such, and stay such, by finding more and better stuff to sell on world markets. Even for services, we aren’t.

Sometimes, there are encouraging moments.  One of those the other day was the Labour Party moving to outflank the government and propose the complete abolition of the Metropolitan Urban Limit (or restrictions in a similar guise) around Auckland.  I’m not optimistic that it will all come to much –  as I’ve noted repeatedly, hoping that someone can offer a counter-example, there are no cases I’m aware of of cities/countries successfully throwing off planning restrictions once they become established –  but at least it seems to represent a recognition of (a) the seriousness of the problems, and (b) something closer to the root causes of the problem.

I wonder how long it will be until some political party –  even some leading media outlet –  might decide there is mileage in highlighting just how badly New Zealand has been doing economically over a very long time, and offer some serious grounded ideas for how we might turn that failure around.    Since 1970, Statistics New Zealand data tell us that a net 940000 New Zealand citizens have left New Zealand, and even in the last 25 years we’ve seen over 500000 (net) New Zealanders leave.  Sadly, it has been –  and remains –  a rational response to our own continuing underperformance


80 years of underachievement

Yesterday afternoon, glancing at my email inbox, I was briefly take aback.  Like many no doubt, I’m signed up for the Prime Minister’s weekly mass emails.   But, not really concentrating at the time, the sender/subject line of the latest one grabbed my attention.

Rt Hon John Key        Celebrate 80 years with me Michael

It was an unnerving thought –  80 years with the Prime Minister.

It turned out that yesterday and today mark 80 years since the conference in Wellington in which the depleted forces of the then Opposition formed the new National Party (and the PM was trying to encourage people to join the party today).  I got curious and turned to that invaluable resource Papers Past to see how the papers in 1936 had covered the formation of the new party, which was to play such a large part in subsequent New Zealand political history.  Surprisingly, there was very little coverage at all.  I guess the media is often not very interested in the goings-on of the Opposition the year after a new governing party has won a crushing victory.

In its eighty year history, National has been in government (and the dominant party in all those governments) from 1949 to 1957, 1960 to 1972, 1975 to 1984, 1990 to 1999, and from 2008 to now.  That is 46 years – or 58 per cent of the 80 years.  Take out the period of World War Two –  when everyone’s attention was mostly elsewhere – and National has dominated the peacetime scene and, hence, the ability to set policy, pass legislation etc.  (In fact, as the Prime Minister’s email pointed out, the National Party was formed by merging existing political parties, which themselves had governed New Zealand for decades prior to 1936.)

Against that backdrop, their achievement –  as stewards, leaders, those entrusted with power – is pretty disappointing.

In 1936, Angus Maddison’s collection of national per capita GDP estimates suggests that New Zealand per capita incomes were among the very highest in the world –  behind, but not much behind, the United States, the United Kingdom, and Switzerland.  Denmark and Australia were a little way behind us.  The Great Depression had been pretty awful for New Zealand –  albeit not as bad as in the US – but we had emerged as still one of the most prosperous countries in the world.

By contrast, on the IMF’s PPP estimates, New Zealand was 29th in the world last year.

The 1936 dataset only has estimates for around 50 countries, but glancing down the 2015 list it is a pretty safe bet that none of the other countries (not in the 1936 collection) now above us would have had higher per capita incomes than New Zealand in 1936 had the data been available.

New Zealand has done badly (although it is fair to note that of the other leaders in 1936, even the US now only has the 10th highest GDP per capita).

Here is a scatterplot showing GDP per capita in 1936 and 2014 for the 45 countries for which Maddison (and his successor, the Conference Board database) had per capita GDP estimates for both 1936 and 2014 (the latest actual data).

1936 and 2014

Broadly, countries that were rich then are still pretty rich now, and countries that were p0oor then are still towards the lower end of the distribution.  There are some striking exceptions – South Korea and Taiwan are two of the more striking examples here. (China, interestingly, for all the hype about the last couple of decades, is the dot furthest to the left on the entire chart).

New Zealand is marked in red, with incomes per capita well below where one might have expected knowing our economic performance in 1936.  Some places have done much much worse –  those green dots are Guatemala, Venezuela, and Argentina  – but New Zealand’s performance has little to commend it.  Relative to the starting point, it is the worst of any of the now-advanced countries.

Of course, some people will want to mount arguments that our severe underperformance is not a matter for which governments (or the political parties behind them) can be held accountable for.  And there are certainly some things government can’t change –  geography, natural resources, the EEC, and so on.  But almost every country has advantages and disadvantages –  permanent or specific to that 80 year window. In each country, governments are responsible for how they react.  Ours, typically, seem to have chosen quite badly.  Since our relative fortunes still aren’t improving, it is reasonable to suggest that our governments are still choosing badly.

The National Party, and those of its members who form governments need to take some considerable responsibility for that.  Of course, the Labour Party and its governments do too –  it is just that they have had rather less time with their hands on the levers of power.

Good luck to the National Party in celebrating their 80 years.  The party has done well for itself, but less well for the people of New Zealand.  I’m not suggesting any ill-will, or bad intentions, and I don’t subscribe stories in which parties skew things over time much towards their own voting base.  National Party-supporting groups have probably done about as badly as everyone else –  in those international comparisons –  over the 80 years. And that is a problem for all of us.

Somewhat to my surprise, I discovered recently that the Fabian Society still exists.  The Fabians developed in Britain as non-revolutionary socialists, and my images are of people like Sidney and Beatrice Webb, Clement Attlee, and Herbert Morrison.  But anyway, the movement still exists in New Zealand.  Also somewhat to my surprise, they’ve invited me to speak to one of their public meetings on what went wrong with New Zealand to generate this disappointing long-term  economic performance and what might be done about it.  Glancing through the list of past speakers, I think I will be the most conservative or market-oriented person ever to address them.   But I like the idea of any organization whose website leads with the aim of “inciting debate”.

Anyway, meetings appear to be open to anyone who wants to come along, and for any Wellington readers who might be interested I will be speaking –  sharing a platform with Herald columnist Brian Fallow (who is probably more naturally at home with the Fabians) –  this coming Friday evening (20 May)    Details are here, but the venue is Connolly Hall (Guildford Terrace, just off Hill St) and the meeting kicks off at 5:30pm


Outperforming cities…but not Auckland

My post the other day put the decline in Auckland’s GDP per capita (relative to that of the rest of the country) in some international context using BEA data on the average per capita GDP of various large US cities.  As one would have expected, the average per capita in the typical US large city had been rising a little faster than GDP in the US as a whole.

The US data are interesting, but the US is an extremely large country.  By contrast, in Europe that are lots of small countries, and (in particular) small countries with a single dominant city.  In that respect at least, European experiences might be more interesting to compare Auckland’s experience against.

Eurostat publishes a huge quantity of regional per capita nominal GDP data for the 28 EU member countries.  For a few (Malta, Luxembourg, and Cyprus) there wasn’t meaningful data distinguishing the performance of the biggest city from the rest of the country –  and in Luxembourg, the data are problematic anyway, since GDP captures economic activity occurring in a country, while many people who work in Luxembourg live in surrounding countries.  But that left 25 EU countries, and I went through the data to identify, as accurately as I could, the data for the metropolitan region capturing the largest city in each country.  Again, the data are likely to be only indicative –  in every metropolitan area, there will be some cases where people work in the area (so their output is in GDP) but live somewhere else (so the person isn’t in the population numbers for that region).

For a few large countries there is no single dominant city.  It isn’t an issue in the United Kingdom, France or Poland, where London, Paris and Warsaw respectively dominate,  But for Spain, Germany and Italy it is.  For illustrative purposes, I used data for Madrid, Hamburg, and Milan respectively.

Eurostat publishes data for 2000 to 2014, but for some cities the data are only available to 2013.   For each country, I took the average per capita income of the largest city and calculated that as a ratio of the whole country’s GDP.

This chart shows the behavior over time in the ratio for the median country.  I’ve shown two lines: one for the 17 countries with populations less than around 10 million, and one for all 25 countries.

eu time series

For all 25 countries, the median had increased over this period.  For the smaller countries, there been basically no change over the full period.  It is quite different from the picture for Auckland.

akld rel to nz gdp pc

I’m not sure why the smaller EU countries did less well on this measure than the full EU sample, but the smaller countries included the countries worst hit by the 2008/09 recession and the subsequent euro crisis.  There might be some cyclicality in the relative performance of the largest city does (doing really well in boom times, but suffering more than most in downturns –  we see a bit of this in Auckland, which feels the demand effects of fluctuations in migration more than most places).

Auckland’s average GDP per capita is higher than that in New Zealand as a whole (and around 12 per cent than that in the rest of New Zealand excluding Auckland), even if that gap has been closing.  But how does that levels gap compare?

In this chart, I’ve shown the latest observations for how much higher (%) average per capita GDP is in the big city  than for the country as a whole for each of the EU country –  grouped by small, medium and large.  I’ve also shown the median for the twelve largest US MSAs (as per my post the other day), the Auckland numbers, and the experimental numbers for Toronto (from a Statistics Canada research paper) for 2009.

gdp pc cross EU city margins

A few things catch the eye.  The first is that, at least among the smaller EU countries, it is the ones which have been catching up where the cities are doing best relative to the rest of their respective countries (eg Slovakia, Bulgaria, Hungary, and the Czech Republic).  New Zealand was supposed to have been catching up, but hasn’t.

The second thing that catches the eye is just how low the margin between average Auckland incomes and those in the country as a whole is, by comparison with these other countries.

But the third thing that caught my eye, was that the Toronto wasn’t much different.  Toronto doesn’t dominate Canada in the way Auckland does New Zealand: Toronto’s population is only about 50 per cent larger than that of Montreal.    The Statistics Canada data are only experimental, and they provide estimates for only 2001, 2005 and 2009, but on those estimates both Toronto (in particular) and Montreal had seen a fall in their average per capita GDP relative to that in Canada as a whole.

These days, Canada has higher GDP per capita than New Zealand does (it was the other way round prior to World War Two), but Canada’s productivity growth in recent decades has been about as mediocre as that of New Zealand.  Canada has much larger industrial manufacturing sectors than New Zealand does –  much of it tied into the US automotive industry –  but at heart much of Canada’s prosperity continues to derive from the ability to utilize its vast natural resources.  It isn’t an economy whose prosperity seems to be led from its big cities –  any more than New Zealand is.    That said, Toronto –  in such close proximity to the US –  seems a much more likely place for successful global companies to base themselves long-term than Auckland.

Canada also operates large scale non-citizen immigration programmes –  indeed, the new Canadian government has just announced a material increase in the target rate of immigration (and an reorientation away from economic migration –  towards refugee and family). Without knowing more about the Canadian data, I’d be hesitant in drawing too many parallels –  and Canada has not faced the same real interest and real exchange rate challenges New Zealand has.

But at least for New Zealand the striking underperformance of our largest city should raise real questions about strategies designed to (or having the effect of) drawing more and more people into Auckland (from abroad –  New Zealanders aren’t being attracted), in a country where per capita prosperity seems to rest –  and seems likely to continue to rest –  on the ability of our people to utilize, ever more smartly, a largely fixed stock of natural resources.

NB: Note that the US figures are measures of real GDP, while for the other countries the data are nominal GDP.    For cities other than the US, this will probably have the effect of overstating the margins by which big city per capita GDP exceeds that in the rest of the country, since many prices (including for example housing services prices, but also labour-intensive services) will typically be higher in big cites than in the rest of the country.

How have big cities done in the US?

I’ve written several times about the apparent economic underperformance of Auckland –  apparent, that is, in the official annual regional GDP per capita data that Statistics New Zealand publishes.

We only have the data for the period since 2000, and no doubt more recent periods in particular will be subject to revisions. And there is noise in the data from year to year.  But whereas in 2000 average GDP per capita is estimated to have been 24 per cent above that in the rest of New Zealand, by the year to March 2015, that margin had shrunk to only 12 per cent.

ngdp akld ronz

That shouldn’t have been happening if the advocates of our “economic strategy” had been correct: between the agglomeration gains from cities, a rapidly rising population increasingly concentrating the population in our one moderately-large city, and all the claimed spillover effects from a skills-based immigration programme, everything should have been set for Auckland to have continued to outstrip the rest of New Zealand.  But it just hasn’t happened –  if anything, rather the reverse.   As I noted the other day, Census data suggest that until the mid 1990s more New Zealanders were moving to Auckland than were leaving.  But even that flow has reversed (albeit on a small scale) over the years since then –  the years that coincide with Auckland’s relative per capita economic decline.

There aren’t comparable official data in Australia (regional GDP data are all at a state level), but in the US the BEA publishes real per capita GDP estimates for each of the metropolitan statistical areas (MSAs).    The data are available from 2001 to 2014.

Here is a chart showing the median real GDP per capita for six areas people often think of when they think of the economic success of US cities (Boston, Houston, New York, San Francisco, San Jose, and Washington DC ) relative to GDP per capita for the US as a whole.

real gdp pc us cities

There is some variability, but over these 13 years as a whole average per capita incomes in these cities –  already much higher relative to the rest of the country than is the case in Auckland –  have increased a little further.  The change over the full period isn’t large –  but nor would one expect it to have been.  But the change is in the direction one would have expected.

Those six cities aren’t all of the biggest MSAs in  the United States.  The others in the top twelve (each with populations above 4.5 million)  are centred on Chicago, Dallas, Miami, Los Angeles, Atlanta, Philadelphia.  If we take the whole group of 12 cities, the median city had average GDP per capita 24 per cent higher than that in the United States as a whole in 2001.  In 2014, that margin has increased to 29.7 per cent.

Of course, in a country with a lot of big cities there is quite a diversity of experiences (different shocks, changing opportunities etc).  In five of these twelve MSAs, average GDP per capita had actually fallen relative to the US as a whole over this thirteen year period.  Most of the falls were pretty small, and might be not much more than normal year to year variance.   But Atlanta did stand out.

atlanta

The fall, relative to the rest of the United States, has been even larger than the relative decline of Auckland.

I don’t know much about the Atlanta economy.  There has been very rapid population growth –  from just over 4 million people in 2001, to around 5.7 million now.   And they have managed that growth while having median house prices of around US$180000, and a price to income ratio near 3.  That is major achievement in its own right.  But it is also one that makes me a little skeptical of claims that fixing Auckland’s dysfunctional housing and land supply market would materially boost per capita income prospects in Auckland (a claim the Productivity Commission has signed up to).

Auckland’s economic underperformance is real, and should be troubling.  It isn’t a “quality problem“, but reflects a serious failure of the economic strategy pursued by both this government and its predecessor.  Fixing the land supply market should be a policy priority in its own right, but it looks like a quite different issue to fixing the issues around Auckland’s overall economic underperformance.  That looks more like the fruit of an immigration policy that funnels huge numbers of people into Auckland, which doesn’t seem to be a natural location for generating lots of  highly-remunerative economic opportunities.  When our largest city has so badly underperformed over fifteen years, despite all the hopes and aspirations, it is time for politicians and official agencies to start facing up to the uncomfortable data.


“Quality problems”

Sometimes I find the Prime Minister’s claims about the New Zealand economy, and Auckland, almost breathtaking.  There is an insouciance about them that almost defies belief. They certainly defy data.

In a speech to an Auckland business audience yesterday –  there is a report here, and also video footage –  the Prime Minister repeated his breezy claims that Auckland’s “challenges” around housing and transport are “a quality problem”, and a “sign of success”, and that both the city and the country are doing “incredibly well”.

Perhaps that is how it appears when you are already wealthy, live in a large house in a prime inner suburb, and have a taxpayer-provided chauffeur at your constant disposal.  Neither housing nor traffic problems must impinge terribly much.

I’ve commented on a lot of the detailed issues previously, including the Prime Minister’s apparent vision of New Zealand as a Switzerland of the South Pacific, and am not going to go through all the detail again here.

But let’s just repeat some of it in summary:

  • Auckland has some of the highest house price to income ratios anywhere in the advanced world.  And we know that there are plenty of larger fast-growing cities in the United States where prices and price to income ratios are much lower.  Auckland prices –  and actually those in much of the rest of the country –  are a sign of policy failure, not a sign of success.
  • Despite extremely rapid population growth  –  relative to the rest of the country, and by the standards of largest cities in OECD economies –  Auckland’s economy seems to have been persistently underperforming.  The sheer size of the economy keeps growing, but per capita income growth has lagged behind.   Using SNZ regional nominal GDP data, Auckland average incomes were 12 per cent above those in the rest of New Zealand in 2015, but they had been 24 per cent higher in 2000. A curious definition of success.  We don’t have regional real GDP data, but the ANZ’s regional trends indicators (which try to proxy regional real GDP growth) suggest much the same sort of underperformance, dating back even further than 2000.  Per capita income growth supports living standards and consumption growth prospects.  Auckland’s economy has been seriously underperforming on that count, despite all the rhetoric about the importance of agglomeration gains in our one moderately-large city.

As it happens, for most of the last decade even the unemployment rate in Auckland has been consistently higher than that in the rest of the country, even though Auckland has a much deeper labour market and one might have supposed that matching labour demand and supply in a changing economy would be that much more frictionless there than in other regions.

auckland U
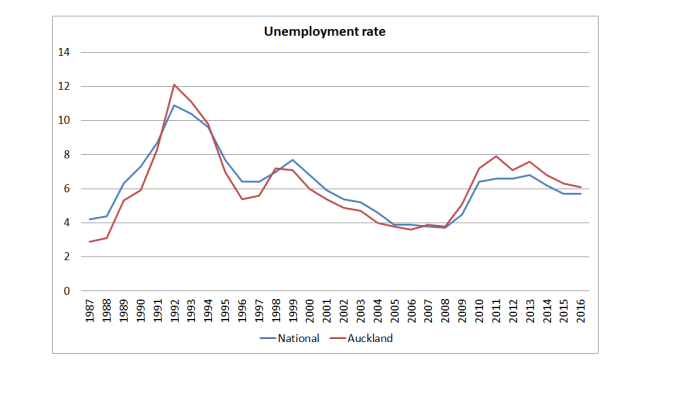
And it isn’t just that Christchurch has had a very low unemployment rate through the repair and rebuild period.  Graphing the Auckland unemployment rate against that of the median region produces much the same picture.

The Prime Minister goes on

“You’ve got net migration not just strong from India, China and Australia but actually net migration from around the country,” Key said.

Well, sort of.    Actually, in the last year around a net 3500 New Zealanders left for Australia, and a slightly smaller (net) number of Australians arrived.  Net inward migration is not a trans-Tasman phenomenon at present –  except, of course, in the sense that a more usual state of affairs has been a large net outflow.

In fact, our net inward migration results almost entirely from the government’s immigration policy choices.

I hadn’t really appreciated the extent of the increase in the number of people arriving on work and residence visas (ie every single one needing explicit government approval) in the last couple of year.

plt arrivals work and residence
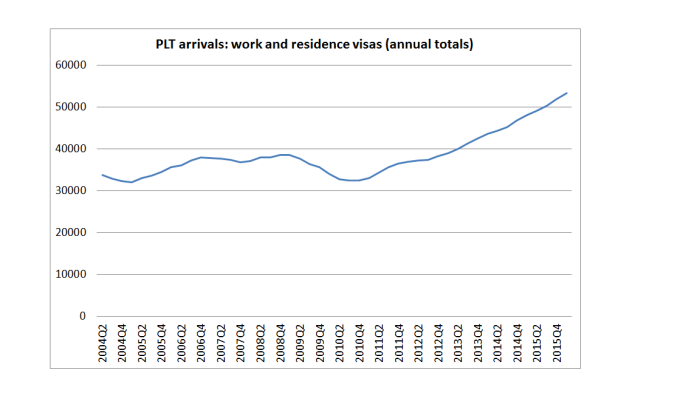
And the massive increase in student visa numbers (mostly to second tier non-university entities), many of whom later acquire residence, is on top of that.

All of which might be a cause to celebrate if there were any sign that these massive migration inflows –  probably the second strongest wave of immigration in the last 100 years – was doing any good in lifting the incomes or living standards of New Zealanders (and particularly Auckland, where the largest proportion of migrants end up).

But there seems to be no evidence of that at all. Certainly government agencies haven’t been willing or able to produce any.  If anything, there is reason to worry that the policy-driven influx of people is undermining income prospects of New Zealanders.

And what about the claim that people are coming to Auckland (“net migration”) from the rest of the country?  That really caught my eye when I saw it yesterday. Perhaps the Prime Minister has access to some data not generally available, but it isn’t the story in the official data, and hasn’t been for sometime now.

In our quinquennial censuses Statistics New Zealand asks where people were living five years previously, which enables them to produce data on internal migration.  As censuses have long been done at five yearly intervals, that generally provides a comprehensive estimate (and I stress “estimate” because not everyone who fills in the census seems clear on where they lived five years previously).  Because of the Christchurch earthquakes, the scheduled 2011 census was postponed to 2013.  The results of that census give us a picture of internal regional migration from 2008 to 2013.

internal migration 08 to 13
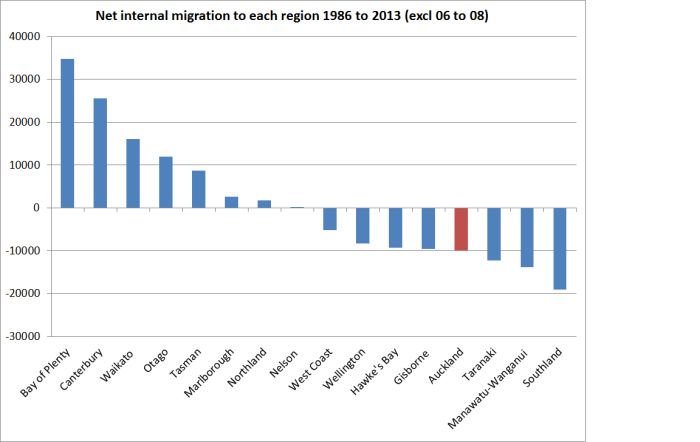
Net, a small number of New Zealanders left Auckland for other parts of the country.  Relative to Auckland’s population, the estimated outflow is tiny, but there is just no sign of New Zealanders flocking to the “success” of Auckland (and note that this period includes the outflow of people from Christchurch in couple of years after the earthquakes). Perhaps things have been different in the last three years, for which we don’t yet have data.

But if so, it would be quite a reversal. SNZ has compiled this data back  as far as the 1986 to 1991 five-yearly period.  The last five yearly period in which Auckland experienced a net inflow of people from elsewhere in the country was from 1991 to 1996.

Here is chart which covers the estimated net internal migration to each region for the period 1986 to 2013 (with the two years 2006 to 2008 missing, because they weren’t captured by any of the censuses).

internal migration 86 to 13.png

Internal migration has certainly happened on a significant scale (gross and net).  But, net, it hasn’t been to Auckland.

Add in the huge outflow of New Zealanders to other countries (mostly Australia) over that period, and it looks a lot like New Zealanders avoiding Auckland.  And that shouldn’t really be surprising: despite its really pleasant physical location, housing has become increasingly unaffordable and income growth has lagged behind.    Other places do worse (as a share of population), but Auckland was supposed to the beacon of opportunity and our future economic prosperity.

Of course, one can always attract foreigners from poorer countries,  and that is what successive governments have done (especially, in effect, in Auckland).  But that isn’t a sign of economic success.  It is, instead, an economic (and social) strategy (“critical economic lever” is MBIE’s term), and one which increasingly looks to have failed –  at least if the benchmark is, at it should be, benefits to the living standards and incomes of New Zealanders.

As for the Prime Minister’s final claim, that the New Zealand economy is doing “incredibly well”, words almost fail me.  At a cyclical level, our unemployment rate at 5.7 per cent is still uncomfortably high (and much higher than it was when the government took office, and currently the same as Australia’s when we’ve typically managed better unemployment outcomes).  Productivity growth –  whether labour or MFP – remains mediocre at best, and there is no sign whatever that New Zealand is making up any of the ground lost relative to other OECD countries in the last 50 years or more.

Most people in New Zealand who want to work have jobs, and material living standards for most are still quite comfortable.  But it is the continuation of a long slow relative decline.  And nothing the current government –  or its predecessor –  has done has done anything to begin to reverse that decline.  The big-Auckland “strategy” does increasingly look to have been something really quite bad, worsening living standards for Aucklanders (especially in conjunction with the “rigged” dysfunctional land supply market), and dragging down prospects for the rest of New Zealand.

As I said at the start, the insouciance in the face of all this underperformance almost defies belief.  But what matters much more is that it simply defies the data.