National’s “fiscal plan” came out this afternoon. To no one’s great surprise I guess, we didn’t learn much from it. The big National numbers had been in the Back Pocket Boost package a few weeks ago, combined with the statement from Willis last week that National would get back to an OBEGAL surplus no sooner than Labour was suggesting it would (in PREFU, and in its own fiscal plan). Oh, and they paid some economic consultants to say much the same as Labour got their economic consultants to say: the promises listed added up to less than the future operating allowances the two parties had indicated. As I noted in my post the other day, Labour’s consultants (Infometrics) noted that they hadn’t had much time. But then, having splurged in the previous two budgets, Labour is going into this election with fewer and smaller promises. National’s Castalia is reported to have done a bit more work on a couple of items, but we are still left totally in the dark about the numbers behind the foreign buyers’ tax revenue estimate: neither National’s nor Castalia’s modelling has been released, and there is no official agency estimate to use as a starting point.
The National “plan” is unambitious, depressingly so if you care about fiscal responsibility, or even about easing pressure on monetary policy when (core) inflation – which National has (rightly) been quite strident about – is still coming down slowly if at all.
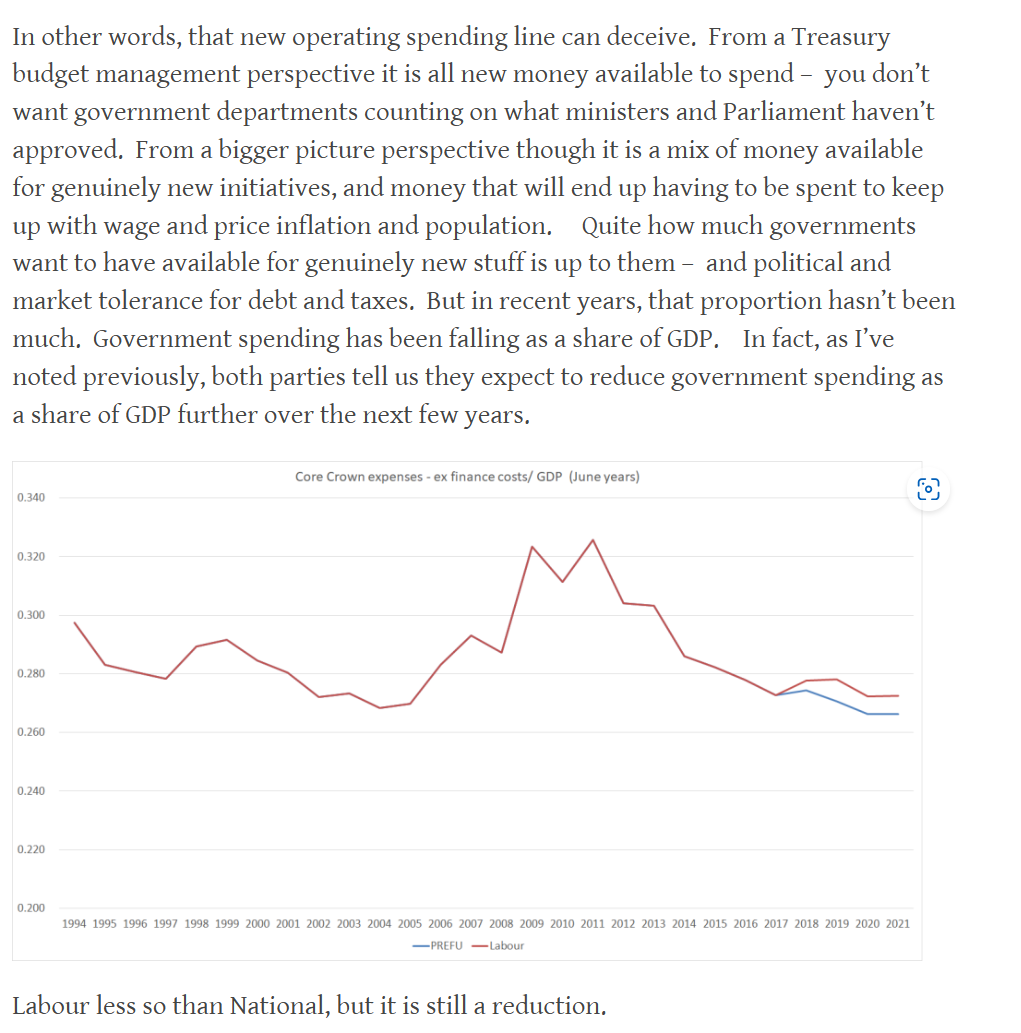
If you are wondering where that 0.7 per cent of GDP in the title of this post comes from that is how much lower net government debt is estimated (by National themselves) to be lower than the PREFU numbers by 2027/28 – a year so far out it isn’t even in the main PREFU forecast numbers (which run only to 2026/27), and which involves budgets set after the next election, when who knows which constellation of parties will be in office. In the final year of the forecast period – and the final year for which any new government elected next month will set the Budget – the difference is 0.4 per cent of GDP. The differences are derisorily small (and totally swamped by margins of errors around each parties’ plans, let alone uncertainty about denominators (what happens to the economy, and recall that Treasury’s PREFU forecasts were taken by many economists as veering towards the optimistic side)).
Now, I’ve seen Willis and Luxon quoted as saying “ah yes, but no one should believe that Labour can deliver on its plans” (the ones included in the PREFU, including future operating allowances). “Look at their track record, of consistently overshooting those lines in the shifting sands, announced intended future operating allowances.”
And I’d have some sympathy with that line, as no doubt would The Treasury, whose own lightly-coded comments in the PREFU were really rather sceptical (for a government agency in public), highlighting the tough choices and tradeoffs that would be required. At best, the fiscal numbers (recent “cuts” and future operating allowances) behind PREFU are statements of current high-level intent only. Achieving them against the backdrop of ongoing cost pressures – and temporary windfalls from surprise inflation that will not persist – will be challenging to say the least.
But the problem for National with this argument is that they will face all those same pressures, and instead of approaching this election with a serious stance of austerity, emphasising the size and unjustified nature of the current government’s deficits, they are playing much the same game as Labour has over the last year or two, competing to see who can give out the most electorally attractive baubles, and funding those handouts with either the same new distortionary tax Labour is championing (depreciation on non-residential buildings), even as they claim to the party of business and growth, or with a tax (foreign buyers) that is not only unprincipled and inconsistent with much of the rest of their messaging (“supply is what matters”, “foreign investment should be championed), but where the revenue estimates command no confidence whatever beyond the halls of the National Party wing of Parliament.
Now, I for one do have some confidence that National will be better at cutting, or restraining, spending in the next few years. They’ll be cutting stuff the other side did so won’t have the same attachment Labour ministers would have had. But……they need to be better at cutting just to get the same fiscal bottom lines as Labour, because their fiscal plans – bottom lines oh so little from Labour’s – already rely on much larger cuts than the numbers Labour themselves have already talked of (neither side offering any specifics at this point). And for all the talk of spending restraint, and even of a pre-Christmas “mini-budget”. today’s numbers seem to involve no change at all, relative to PREFU, to 2023/24’s spending levels.
And National has its own future fiscal vulnerabilities. Not only will there be pressure to bring down the 39 per cent income tax rate (ruled out only for the first term) but in the Back Pocket Boost package there was this
It isn’t a promise to adjust, but it is a promise to review, and it will be hard to resist the pressure for some adjustment in the 2026 Budget, running into the next election.
It is simply unserious from a party that has banged on – quite reasonably – about Labour fiscal excess in the last few years, and now seems to be slipping (predictably but sadly) into me-too mode, advertising themselves as just a little less bad than the current lot, offering a different set of baubles (ones that seem more electorally appealing at present, but have much the same macro effects).
One telling point (which I owe to Eric Crampton) is to compare what Labour planned to be spending in the medium-term before Covid hit and compare it to what National plans to spend (years down the track) in the medium-term, as (ostensibly) the smaller government party, the party of tough spending discipline. In fact, the one that won’t cut any serious programmes, and only wants to add a few more.
Here, it is only fair to focus on primary spending (National inherits the debt Labour ran up, and it has to be serviced for now). In the HYEFU at the end of 2019 core Crown spending excluding finance costs for 2023/24 was projected (on Labour stated plans) to be 27.1 per cent of GDP. We don’t have detailed tables from National, but there is a line in the plan stating that they intend core Crown spending will be 31 per cent of GDP in 2027/28. Adjust for finance costs (from the PREFU, adjusted for small changes in National’s plan from slightly lower debt late in the period) gives 29 per cent of GDP. That is almost two full percentage points of GDP higher than Labour’s medium-term number.
(Some of that will be because of the ageing population, but that only highlights that National’s plans include not even starting on raising the NZS age for another 20 years. 20 years…….)
Finally, National asserts that their policy will be less inflationary than Labour’s.
That looks fine on paper, but (a) any effect is tiny ($300m), less than 0.1% of GDP, utterly lost in the rounding of any inflation forecasting model, and (b) it ignores quite a lot. That line attributed to the Treasury may be valid in a very general broad-brush sense, but here we need to think about concrete proposals. Thus, even if National’s foreign buyer tax revenue estimates were to be roughly right – and Willis’s latest answers to questions on this point advance things not at all – the money will mostly be coming from income not earned in New Zealand (thus representing no drag on demand) to fund tax cuts pretty much across the board, to a household sector with a high marginal propensity to consume. But reading through the plan, I was struck by a couple of other points. The removal of the regional fuel tax for example (while it will temporarily slightly lower headline, but not core, inflation) puts more money in the hands of Auckland householders, without any immediate identified replacement, and National says they think reserves will enable the Auckland local authorities to keep spending. Net, that is a near-term inflationary effect. They also seem to propose to pay to councils an extra $25000 for each house built above a five year average, funded by discontinuing various other things, one of which is a Kainga Ora land acquisition programme. My point here is not about the merits of the policy, but a policy which stops asset purchases and instead gives councils more spending money is also likely to be inflationary at the margin.
I do not want to overstate this point. All these effects are small, individually and even in total. But there is just no serious basis for National’s claim that their fiscal approach will be less inflationary than Labour’s. And Labour’s added a lot to demand this year, when inflation is still a serious problem.
Finally, for all those – probably mostly on Twitter – who have spent the last few weeks bemoaning my bias (in their eyes) towards either Labour or National, I’m told that at the Mood of the Boardroom event in Auckland this morning both Robertson and Willis were each at pains to suggest that I was no friend or fan of either of them.
The Labour Party this morning released “Labour’s fiscal plan” together with a document reviewing that plan and prepared for the Labour Party by Brad Olsen of Infometrics. Both documents can be found here.
I suppose it is good that they have put out such a document – I’m not sure parties in office always have previously – but it adds almost nothing to our state of knowledge as at the PREFU a couple of weeks ago.
And so here, again, is the text and charts from my post after PREFU, where I suggested it was really a case of “pretend fiscal policy”. After that text, I’ll add a few charts on today’s release.
This morning’s post previewed PREFU at a high level, pointing out that both main parties had been in practice endorsing expansionary fiscal policy, and that the likely operating balance surplus that would be shown in the PREFU would really reflect nothing more solid than aspiration, even after the numbers had been gamed. Neither party seemed to have a concrete fiscal strategy or plan to actually close the deficit, a deficit which the IMF estimated a few weeks ago was one of the largest among advanced countries as a share of GDP.
As far as I can see there are no great surprises in the PREFU fiscal numbers. There is a small surplus in 2026/27, using the numbers the government told Treasury to use for its future spending plans. Anyone can plonk down a number. Delivering it is another thing.
There isn’t going to be lots of fresh analysis in this post, mostly (at least for fiscals) a series of charts I’ve shown on Twitter.
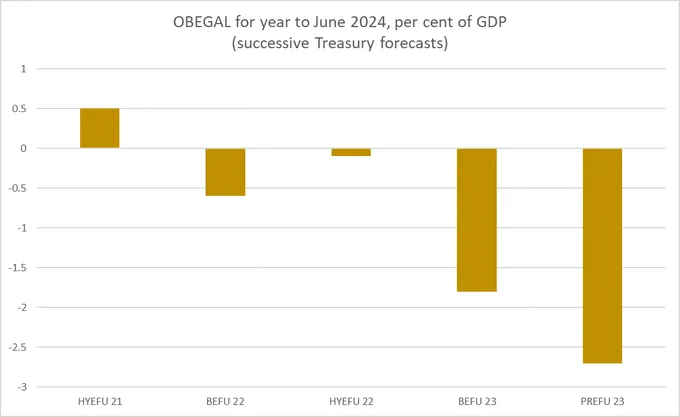
For example, here is how Treasury’s forecast of the operating balance (OBEGAL) as a share of GDP for the year we are now in has evolved just over the last 20 months.
The deterioration since the Budget this year is despite the economic position and capacity pressures (the output gap) being a bit less negative. This is a year for which the spending has now been appropriated, the taxes put in place etc.
What about the following year?
We aren’t anywhere that year yet, but the forecasts have already revised down massively.
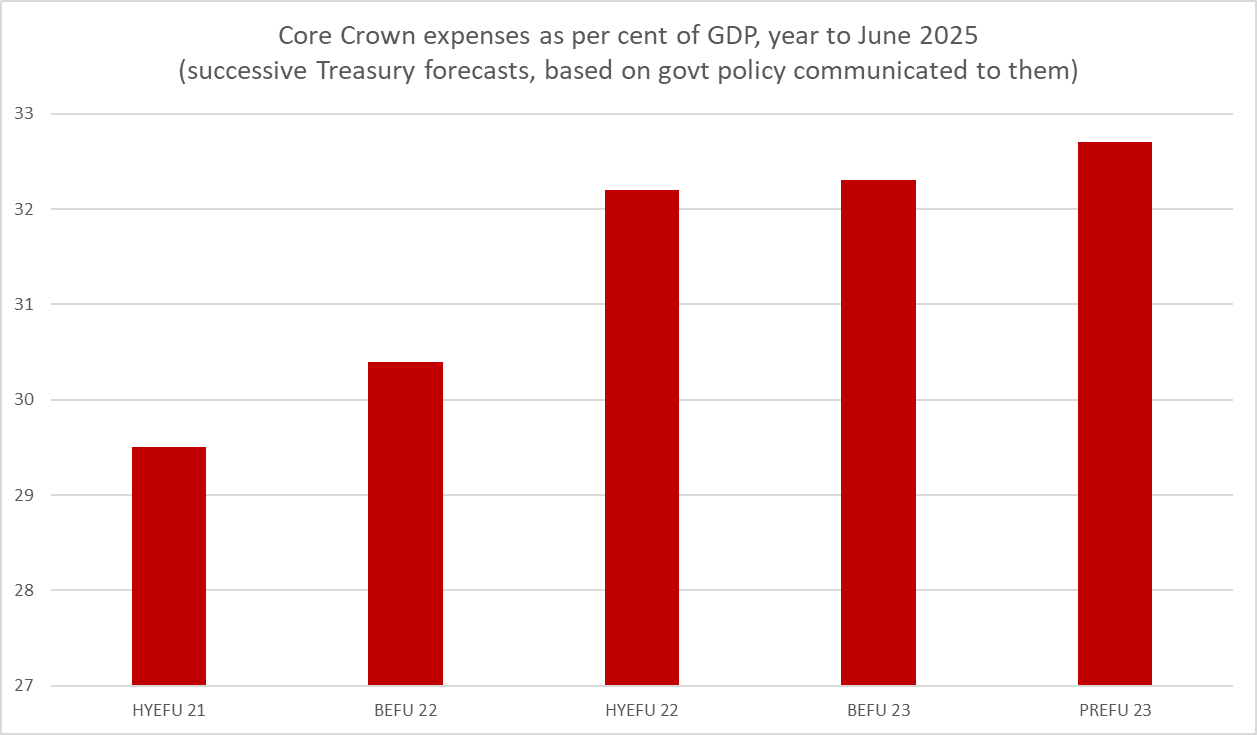
And despite recent talk of renewed fiscal discipline and spending restraint, here are the projections for core Crown spending as a share of GDP, again for the next Budget year. The PREFU forecast share is higher again than the BEFU one. And this is before Ministers actually have to confront drawing up next year’s Budget.
The political parties want us to believe that we are on a track back to surplus. We aren’t. Instead, the Secretary has been given some numbers to be consistent with a surplus by the end of the period, and for anything else…..well, we just have to wait for successive Budgets under whichever government holds office.
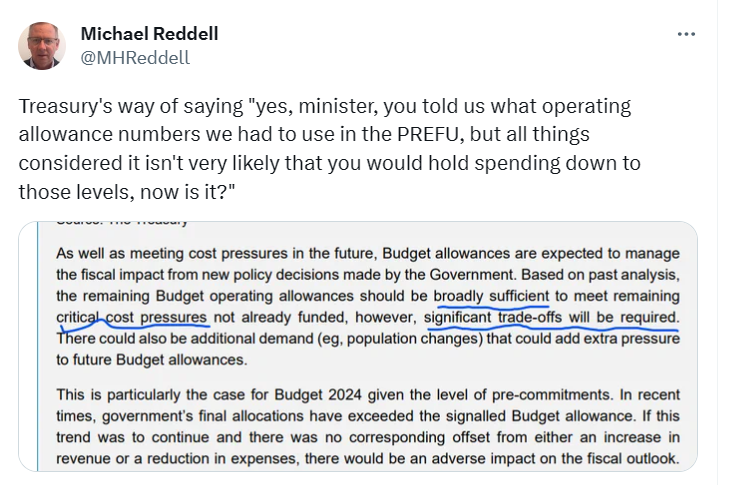
As for Treasury, they have to be a little diplomatic, but here is their text about spending and operating allowances, and my summary commentary
The medium-term numbers in the PREFU are just not a serious contribution to anything much. They distract more than they clarify or reveal.
Whichever party forms the government they face tough choices over years if they were actually to be serious about getting back not to surplus, or even balance. If they aren’t serious then net debt will continue to rise as a share of GDP and within a few years we will have higher net debt as a share of GDP than the median advanced country.
27 September material here again:
Setting aside the outright political spin one might expect in any such document or the deceit by omission (no mention of how fiscal policy in the last couple of years is adding to inflation pressures, or that while the median advanced country now has stable ratios of net debt to GDP, here that ratio is rising rapidly (albeit still at a level a little lower than the median advanced country)), what we have in today’s release isn’t much more than a statement showing that the specific operating spending items Labour has already committed to, as government or as party, do not add to more than the operating allowances Labour in government set a few weeks ago.
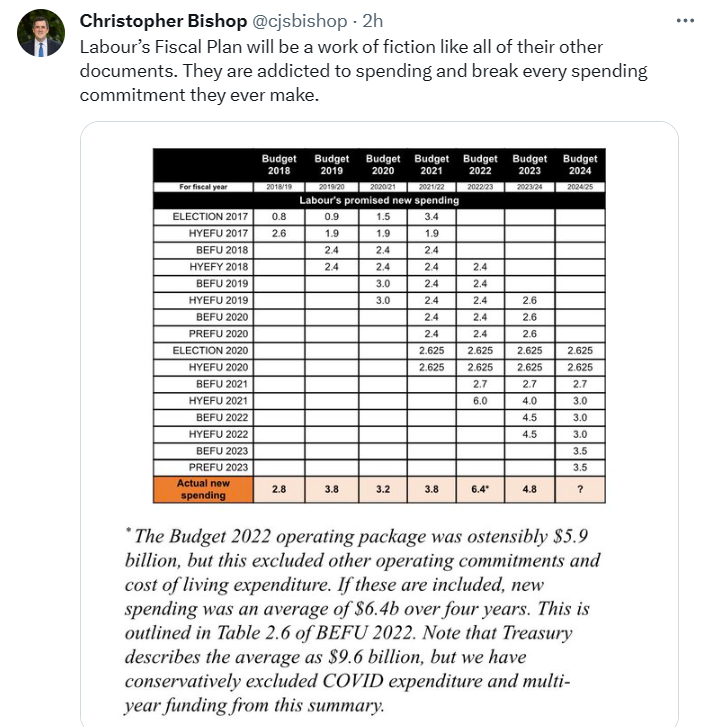
I guess that is welcome but (a) it is hardly a surprise (they set the operating allowance knowing at least in outline their election campaign approach, and (b) it isn’t enlightening because there is very little serious analysis of underlying cost pressures (eg are teachers really going to be stuck with a permanent real wage cut?), past track records (National is touting a nice table out showing how actual spending has consistently exceeded signalled future operating allowances) and nothing at all of substance on what is going to be cut to deliver on the sudden arbitrary scope for savings the government claimed to identifiy (and got in the PREFU numbers) a few weeks ago.
The publication of the Olsen report is also welcome. But it is very limited indeed.
They don’t seem to have had much time
and they explicitly reiterate that Treasury line I quoted above that “significant trade-offs will be required”.
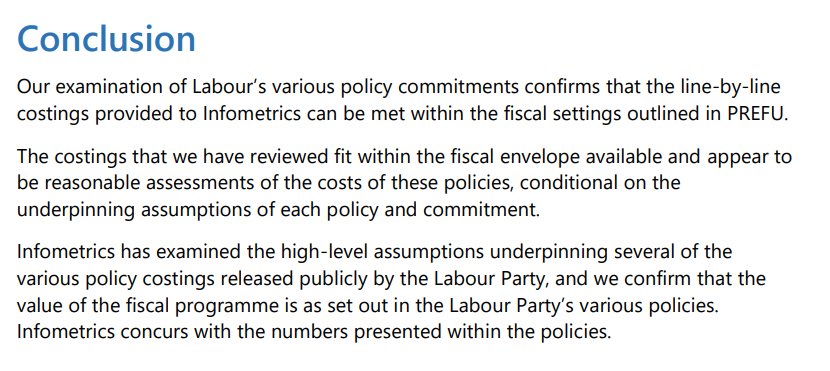
Here is the conclusion
It is a mechanical exercise not a behavioural one. Do things add up to less than the announced operating allowance? As far as they can tell, yes they do. It is good to know, but (again) isn’t telling us much.
Meanwhile we are still waiting for the National fiscal plan (let alone publication of the modelling their reviewer is said to have done for items in the earlier tax and spending package). Today’s document will up the pressure on them, at least a little, perhaps including in tonight’s leaders debate.
The bottom line, however, is likely to be that Labour had its irresponsible splurge in the last two Budgets (when Covid was simply not a material consideration, the economy was overheating, and domestic inflation was miles above target) and in this campaign there isn’t really much of a fresh bout (although one could mount a good argument that now is not the time for giveaways no matter the party). National, sadly, seems to think it should have its turn to splurge – and to further distort the tax system with the same anti business investment depreciation provisions Labour is also promising. It is no time for tax cuts, even if somehow they were (locally) fully funded and the revenue estimates stacked up. It is no time for substantial cyclically-adjusted fiscal deficits, which don’t fix themselves. Labour offers no credible story for how they will close them – just drew a line on a graph saying they will and that now they are the reformed drunkard not the drinker still on a binge.
Will National offer anything better re overall fiscal management? On the evidence to date – including comments from Willis citing Key/English, who were still running net expansionary budgets as late as 2010, before any quakes – it is difficult to be optimistic. One day we will see their plan.
That was a weird 24 hours or so. If you had told me a week ago that anything I was involved with would be the lead item on Morning Report and on the two TV channels’ evening news bulletins, I would not have believed you. Election campaigns are funny things.
I don’t want to say anything much more about the foreign buyers’ tax issue, although it did occur to me this morning that National’s stance – refusing to release any workings, or details of the Castalia review- was somewhat at odds with Willis’s recent statement that National now wants a state Policy Costings Unit established. In any such model, the full costings/modelling for any policy a party adopted would routinely be released. But in the end it is their choice, as it should be. And, as I noted yesterday, whatever political/reputational significance the (likely large) gap in the revenue estimates has, it simply isn’t macroeconomically significant, at about 0.1 per cent of GDP per annum.
The OBEGAL operating balance forecast for this fiscal year in the PREFU earlier this week was 2.7 per cent of GDP, and less than three months into the fiscal year I’m sure Treasury would tell us that even if there are no policy changes, that is a point estimate within a credible range easily 0.5 percentage points either side of 2.7 per cent.
In the run-up to last year’s Budget, the Minister of Finance released a new set of “fiscal rules” (these have tended to be something of a moveable feast to say the least, but the 2022 ones are still in place). Under those “rules” (to be a real rule it has to lead to changes in behaviour not just changes in the rule), the aim was not just to get back to surplus (OBEGAL) but to maintain a surplus in the range of 0 to 2 per cent of GDP. To simplify things, we’ll focus on a midpoint of 1 per cent of GDP, each year.
Back then – less than 18 months ago, the big Covid spend now well behind the government – a surplus was thought to be close. In fact, in the HYEFU in December 2021, Treasury had projected a surplus of 0.5 per cent of GDP for this current fiscal year 2023/24 (by Budget 2022 that forecast had already slipped to a deficit of 0.6 per cent of GDP). So back then, not long ago, getting to surplus wasn’t some “end of forecast period [4 years away]” idyll, per the Labour Party’s current “Our Pathway Forward” document released a couple of weeks ago.
Treasury forecasts that GDP for the 23/24 year will be $417 billion. If we take the difference between the forecast deficit of 2.7 per cent of GDP and the 1 per cent of GDP surplus target, we get a $15.4 billion fiscal gap this year. Expenditure not sufficiently funded by revenue to be consistent with the fiscal goal the government itself had set.
People will talk a lot about Covid spending having been necessary, and I’m sure much of it was. But that was then and this is now (23/24 and beyond). The only justifiable reason for the Covid spend to still be influencing spending today is the servicing costs of the resulting debt – which themselves are much higher than they would have been if only the Reserve Bank MPC, with the imprimatur of the Minister and the Treasury, had not engaged in a massive liability swap, buying back long-dated debt and issuing huge volumes of new floating rate liabilities, right near the trough of a decades-long trend decline in long-term interest rates. And part of the reason we should aim to run surpluses in more-normal times is to counterbalance the inevitable deficits when really bad things happen (be they the Canterbury earthquakes or Covid).
One could produce lots of other estimates of “the gap”. For example, the residual cash deficit (number 2 on the PREFU “fiscal strategy indicators” bit of the tables) is way larger again. Or – as I talked of in earlier posts – we could play around with inflation adjustment. But whichever way you look at it there is a really large fiscal gap, which wasn’t foreseen even at the end of 2021, let alone pre-Covid
In the 2019 HYEFU, just prior to Covid, the forward projections had had a surplus for this year (23/24) of 1.5 per cent of GDP. Tax revenue as a share of GDP for 23/24 is higher in the recent PREFU forecasts than it was back in December 2019 (not surprising given the fiscal drag from inflation), so the gap is entirely down to additional spending. That’s a choice, by this government.
As the IMF, The Treasury, and every other serious analyst (including the ANZ just today) also recognise, the choice to widen out the prospective deficits a lot has also directly acted to work against the drive to lower inflation, putting more upward pressure on interest rates. (The Minister and RB Governor dispute this, but they must be considered motivated reasoners, and the Governor in particular has been slow walking the release of whatever (if any) analysis they might have to support his story. As one follower on Twitter noted, perhaps he and Willis have more in common than we had thought.) As I’ve documented, when we look across advanced countries, we now seem to have one of the larger deficits around. All this in a year in which the economy is expected to still be pretty much fully employed.
Ah, but the government would tell us, surpluses are coming. After all, Treasury said so. You only have to look at the PREFU tables and there in 2026/27 there is a very modest surplus.
But if we are talking about credibility of numbers, this really takes the prize for worst among the major political parties.
As I’ve pointed out previously, The Treasury has to do its forecasts on what the government tell them is its policies. There isn’t any real discretion. These are only Treasury’s best forecasts conditional on assuming the policies a government that is behind in the polls told them will be its policies in government for the next several years. You can’t really have Treasury doing unconditional forecasts, but PREFU numbers in particular for years beyond the current year really aren’t worth very much at all, because they can easily be, and have been, gamed.
Just before the numbers were finalised – no doubt knowing where they were heading – the government decided to indicate that future fiscal policy (almost entirely periods beyond the election) would be run materially tighter than they had previously indicated. This was a mix of cutting baselines for various departments, cancelling a few things immediately, and announcing that in out years the future budget operating allowances would be reduced. And, as if by magic, they took $4 billion out of total expected spending over the forecast period, without making even one specific commitment about things that wouldn’t be done etc in that future period. Going into a PREFU, the Minister of Finance can tell the Secretary any number he likes, and she has to use it. And this is not to suggest that the previously announced future operating allowances had been just fine either; after all, similar political imperatives had driven the government at Budget time, wanting to show a surplus (then) in 2025/26.
In the furore around National’s costings re the foreign buyer tax, we didn’t get to see any substance from the reviewers either. But being in government is a bit different. If Treasury had to do forecasts using what the government said was going to be its fiscal policy if it were to be re-elected, Treasury was free to provide its own interpretative or contextual comment. And it did.
We don’t have a very clear insight into just which cost pressures Treasury was referring to there. Some of it will be general inflation (prices and wages) from here, but some of it should presumably be stuff like the huge cut in real university funding that the government has imposed in the last couple of years, perhaps accidentally on account of inflation, but not remedied and probably not sustainable. Or the real wage cut they recently imposed on secondary teachers (even as private real wages are steady to rising) when recruitment and retention issues remain real, or a similar burden they seem to want to impose on senior doctors. Inflation can be a wonderful thing for government budgets in the short-term, but reality – market real wages, international competition etc – will eventually out. And as others have pointed out, none of these PREFU numbers capture things like the pressure for increased defence spending or the costs of big new projects like the new harbour crossing for Auckland that the government rushed out a few weeks ago.
On any fair assessment of the way this government operates, the current expenditure projections simply are not credible. And Treasury – the government’s professional advisers – know it (presumably some journalist will have thought to OIA any private fiscal analysis Treasury has given to the Minister in the last month or two). Cyclically-adjusted deficits do not heal themselves and nothing specific the current government has said or done has amounted to anything more in that direction than drawing a line on a graph and saying “that is our policy” (or would be if you were to re-elect us). What won’t be done, in such volume or quality or whatever. Ministers can’t or won’t tell us, and their own track record has actually been one of not delivering anything as low as the indicated future operating allowances.
These issues should swamp in substantive importance anything around one line item in National’s plan, which even if things are as bad as our model (and they could be worse if National did have to shift to a tax-residence base), is not much more than 0.1 per cent of GDP, slightly worsening a deficit that any new government will face of 2.7 per cent of GDP. It is the 2.7 per cent that really should be in focus.
But that is true as much for National as for Labour. And at the moment the signs are not encouraging. We are told to be a little patient and that the party’s “fiscal plan” will be released sometime before the first of us cast our ballots (little more than two weeks away). But nothing we have heard so far gives us much confidence that the party is any more serious about deficit reduction than Labour is.
The Back Pocket Boost package was their big tax and spending announcement. Luxon has been explicit that PREFU will change nothing about that package, so what else (material) is there? Perhaps this is unduly pessimistic but I wonder if we won’t see something a lot like Labour’s policy – vapourware commitments to surpluses years ahead, but nothing specific. In one sense National could be worse than Labour: not only is there the probable gap from the foreign buyers’ tax revenue, but National has already assumed a lot of whatever public sector fat can readily be cut is used to finance the promised tax cuts. That fat can’t be used again to cut the deficit. On the other hand, of course, National (and ACT more so) does seem genuinely exercised about bloat and excess in recent years, and you’d have to think they would be a bit better positioned (even just psychologically) to make the needed cuts, and personnel changes, than a bunch of ministers who delivered the spend-up in the first place. But those two influences probably largely net out and we are left with a big fiscal gap – that $15 billion one – and two parties neither of whom seem to have any real idea as to what they would do, sustainably, to actually deliver surpluses. Perhaps neither really cares very much. Which should go to their credibility with voters…..but probably won’t.
To end, just another chart for those – from whichever side – going “but Covid”. The chart is a variant of one I’ve shown before, but this time I’ve indexed net debt to a common starting point in 2019 for the median OECD country and for New Zealand (the latter using PREFU numbers for 23/24). (The scale here is percentage points of GDP: so an increase from 100 to 110 is an increase of 10 percentage points to net debt as a percentage of GDP.)
You can see the impact of Covid. In both the OECD grouping and in New Zealand the spending associated with the first big lockdowns made a big difference, boosting debt materially. Probably few argue with that very much. But what has happened since then? Net debt for the median OECD country (as a share of GDP) is now a bit lower than it was in 2019, reflecting some mix of inflation (unexpected inflation cuts nastily into the real value of nominal debt) and a prompt return to something near a balanced budget (not every country of course, but this is the median country).
But not in New Zealand where the government has made a conscious choice to increase core spending a lot further (even in the gamed PREFU core Crown spending as a share of GDP is now expected to be a bit higher than was projected for 24/25 even at Budget time), consciously choosing to run large deficits, which it now has no real idea how to close.
(Note that as I’ve shown previously the absolute level of NZ government net debt (share of GDP) is still below the OECD median- the chart above is about relative changes over that specific period – but that gap has been closing fast.)
One interviewer yesterday asked me to sum up the gap in National’s foreign buyers’ tax revenue estimates in one word. I could only manage three: “a bad gap”. That gap matters on its own terms, but the really bad gap – the one that should be getting a lot more attention from the media, and a lot more engagement from our political parties, is the $15 billion one that none of them seem interested in engaging honestly on how they really plan to close it. It is a huge gap. Having brought it about reflects very poorly on Labour (or should) but the apparent indifference to the grim outlook for the next few years reflects very poorly on the credibility of both our main parties, notably he who is now Minister of Finance, and she who would take the job just a few weeks from now.
I should perhaps add that while Matthew Hooton’s column today makes some useful points in a similar vein, his prophecies of impending doom, parallels with 1990 etc, really don’t stack up exposed to any very much scrutiny. Our situation now is grim but much less dramatic. More perhaps on a par with the resigned in difference of both parties to house prices (is anyone talking getting them durably lower?) or productivity (does either party have any serious ideas that might drive productivity growth sustainably much higher?). Does either party really care?
Fiscal credibility was once a thing in New Zealand. Both main parties seemed proud of it, even if at times the constraints tied their hands. These days, the two parties – led by Labour, now apparently followed by National – seem to have together shredded what was left of it.
My wife and I are heading off tomorrow for a spring holiday so most likely there will be no more posts here until the middle of the week after next.
The National Party’s “Back Pocket Boost” tax and spending plan, announced a couple of weeks ago, included a partial lifting of the foreign house buyers’ ban, to be replaced with a 15 per cent tax but only on properties selling for at least $2 million. “Foreign” here is a shorthand: the tax affects non-citizen purchasers who do not have a residence visa for New Zealand. Moreover, it does not (as the current ban does not) affect or constrain Australian or Singaporean purchasers.
My initial interest in the package was mainly macroeconomic, including noting that a fully-funded package made no inroads on the (large) fiscal deficit, and that it might actually add a bit to inflationary pressures, including because the revenue from the foreign buyers’ purchase was probably not going to be generated from New Zealand incomes and the income tax cuts were going to people with a high marginal propensity to consume. The revenue estimates from the foreign buyers’ ban seemed quite high – and are quite important to covering the costs of the package – but that seemed to be an issue other people could think about.
But as the debate began on that specific point I got interested. Initially still mainly as observer. As someone who has long been sceptical of the case for a state-funded policy costing office for political parties, I did a post observing that the political market seemed to be working: questions were being asked, experts were coming out of the woodwork, and in light of what emerged (including the party’s choice to, or not to, publish their detailed estimates) voters could reach their own conclusions. In the end, precise numbers were likely to matter less than what the whole episode told us about the group that aspires to form our government in a few weeks’ time.
But then Sam Warburton approached me about getting involved in an exercise with him and Nick Goodall of Core Logic that would attempt to use what National had described of its methods and assumptions to see (fairly mechanically) how much revenue the policy would be likely to generate, using that approach. I don’t support any political party but my inclinations tend to be more right-wing than otherwise, and Sam is fairly well to the left. But there are plenty of issues economists can generally agree on – the general disapproval of Labour’s GST policy being another – and here the issue wasn’t one of whether the tax was a good idea (I don’t think so, and would rather lift the ban altogether), but simply how much it would be likely to raise on credible assumptions. It was and is essentially a technical issue. Oh, and since I don’t approve of state-funded policy costing offices, there was a bit of a sense of obligation to do my bit.
The point of this post is not to repeat everything in the paper, which is a deliberately narrow exercise (and which seems set to have quite a bit of media coverage anyway). But I should note that both in the note, and in the discussion in this post, it is simply assumed that tax and trade treaties don’t in the end pose obstacles to implementing the tax much as National has described it. We proceed as if it can be implemented that way, leaving any treaty issues to the lawyers.
To understand what was done in the paper, we assume:
foreign purchases (over $2m) occur in the same TLAs (and old Auckland TLAs) as prior to the ban (that means disproportionately, although far from exclusively, in Auckland),
foreigners buy the same priced houses as locals (we have detailed data on the distribution of all sales by price band in each TLA),
to ease the constraints of the $2m threshold, potential foreign purchasers will routinely be willing to pay $2m for houses that would otherwise trade at anything above $1.75m.
If one were thinking in terms of risk, the 2nd bullet may understate likely sales, but the 3rd would overstate them.
Reasonable people can produce quite a range of estimates, using approaches inspired by what National has described and other possible approaches. The plausible range is at least as important as any specific numerical estimate. Accordingly, I want to take a slightly more discursive approach to the issue of how much revenue can be raised, and how best to think about it. That includes questions about how much revenue we might reasonably think the tax would raise, but also what the implications are if we are roughly right and National is wrong.
Here I would add that one of the most surprising things about this entire episode is that National has never made any attempt to send out expert surrogates of their own, who might have been willing to champion in technical detail the party’s numbers. I don’t really expect Willis or Luxon individually to be all over every modelling detail, but they should have people who are, and people who are able to tell the story behind the numbers. As it is, no one (other than National’s own claims) who has looked into the matter seems to think the tax will raise anywhere near $740 million per annum. If there were even one informed commentator championing, with a detailed story, numbers that high or higher we’d all stop and take note. But there aren’t.
Standing back, the main question we face in assessing the plausibility of National’s revenue estimates is the volume of sales that would be made to non-Australian non-Singaporean foreign buyers under the proposed policy. There is also some uncertainty around the average price those buyers would pay. National has told us they assumed $2.9 million, and whether that is right or not the average clearly cannot, by construction, be below $2 million. To raise the revenue they estimate with an average sale price of $2.9 million there would need to be 1700 sales a year.
So an appropriate starting point for analysis is the previous experience with sales of houses (transfers) to foreigners (ie non-citizens without residence visas) buyers. Statistics New Zealand publishes a reasonably extensive range of data but only back to the start of 2017.
The ban came on for sales entered into from October 2018 (settlements a bit later). Once Labour was elected in late 2017, it was clear that the ban was coming and so sales/transfers in 2018 are likely to have been somewhat inflated by people buying while they still could, bringing forward demand and sales that would otherwise have been spread over the following few years. We also have data on the (substantial) number of sales each quarter to Australian and Singaporean buyers (the total of the sales that are still happening). A reasonable base level of sales prior to the ban seems to have been about 800 a quarter of which 150 a quarter would have been to Australian and Singaporean buyers (the latter making up more than half of sales to foreigners in the single most expensive locality in the country, the Queenstown Lakes District Council area).
Of course, world population has increased since 2017, as has the stock of houses in New Zealand. So perhaps if there were no ban at all and no tax, it might be reasonable to think of a starting point now of foreign sales of a bit under 3000 a year (plus the Australian and Singaporean ones).
If that many houses were sold to non-Australian non-Singaporean buyers each year at an average price of $1.5 million (well above the average New Zealand price and above even the average Auckland house price), the tax would raise $675 million, getting close to (but still not as high as) the numbers in National’s document. (As an indication of where average sales might go at without any restrictions, a number like this seems generously consistent with Vancouver data on the price the average foreign buyer was paying relative to the average resident.)
But….remember that houses can’t be sold to these sorts of buyers for less than $2 million, and relative to a no-ban no-tax environment the cost to these buyers is higher now than it was (higher in real terms just because all New Zealand real house prices are higher than they were five years, but more specifically higher because of the 15 per cent tax). One large group of people who might otherwise buy are still simply banned while the others face a fairly heavy tax.
There are two big uncertainties in getting from, say, 2017’s position for the number of non-Australian and non-Singaporean buyers to the regime National proposes.
The first is that there is no hard data on what prices those foreign buyers were paying before the ban. And for all the talk of high-priced Queenstown, we know there were more foreign sales in Christchurch (cheapest main centre in the country) than in Queenstown pre-ban, and about as many in each of Hamilton or Wellington as in Queenstown. Even Auckland is a very diverse place, and far from all the sales were in Devenport, Waiheke, or Epsom/Remuera. It isn’t likely removal of the ban on houses over $2m will reawaken effective foreign demand in Otara or Mangere. Pre-2018 buyers were themselves a diverse bunch.
And the second substantive uncertainty is how responsive demand in that over $2m price range will be to the higher prices the tax now imposes. People buying, say, a $2.5 million house in Epsom aren’t poor by any means, but they probably also aren’t money-no-object people either (and recall that the tax doesn’t apply to people living here permanently but to those without residence visas). These aren’t all, or even mostly, billionaires.
I’m not aware of any country that has put a price-threshold based tax on foreign buyers. But in their policy document National cites the experiences in Canada, where both Vancouver and Toronto had for a time a 15 per cent tax on foreign buyers (similar definition to New Zealand) but on all houses. Canada has a similarly encouraging immigration policy to New Zealand, and Vancouver in particular has an (apparently well-earned) reputation as a magnet for Chinese purchases of real estate. In both places reports indicate that the imposition of the tax substantially reduced foreign purchases (demand responded to the increased price the tax imposed). One formal paper I read estimated a 30 per cent reduction in demand. Other suggest perhaps a 40 per cent reduction. Our paper I linked to above deliberately does not attempt to include an estimate of this demand effect.
What do we know of the revenue these taxes generated in Canada? I’ve only been able to find scattered reports regarding Toronto – a city 20%+ larger in population than New Zealand – but what I have seen suggests revenue estimates from the 15 per cent tax rate on all foreign purchases and at all price points was around C$200m per annum (about NZ$250m). Toronto has very high house prices (and price to income ratios).
What of Vancouver? There I found references to official British Columbia revenue numbers (in this think-tank note). The tax was initially set at 15 per cent and then raised to 20 per cent in 2018,
and
C$180 million per annum (NZ$220m) looks to be a reasonable pick for a 15 per cent tax. And if metro Vancouver has only about half New Zealand’s population (a) their tax applied to all nationalities and all price points (on both points unlike National’s proposal), and (b) Vancouver has historically been more of a magnet for Chinese purchases that most other cities internationally (including Auckland).
If I had just arrived from Mars – or were an Opposition leader without the benefit of The Treasury wanting to do a reasonableness check on my team’s numbers – I guess I’d look around at various revenue estimates locally and try to triangulate them against what I could find about other countries’ actual experiences (remembering that places typically put these taxes on primarily to deter demand not to raise revenue). Perhaps such a tax raises quite a lot more than $200m or so in a normal year, but it wouldn’t be my first guess. I’d be a bit troubled if no estimate – not one – was in excess of my own team’s number.
Now here it is worth noting a couple of caveats that could help with revenue raising (and one working in the opposite direction). If house prices take off again I guess it would only be a few years until the average (not median) house price in Auckland was $2m. If so, a lot more potential buyers would be eligible, but….the government responsible might have other problems and concerns.
More seriously, it probably is reasonable to expect that in the first year of the new policy quite a lot more revenue would be raised. There probably is some pent-up demand, perhaps especially at the very top end of the market. But even if one doubled the first year’s revenue estimates, it doesn’t make much difference to the four-year view. The year in year out shortfall would still be substantial.
Note, however, that some of these foreign buyer tax regimes have provided a refund of the tax if the purchaser later establishes residence. That is not a feature of National’s tax policy so should not affect the current costings, but it is an issue to be aware of if the policy moved to being legislated
On the best estimate in the paper the annual revenue shortfall is $530m. That would also be consistent with the scale of revenue that appears suggested by the Toronto and Vancouver experiences. But the gap could be smaller: a $400m shortfall isn’t impossible given the inevitable uncertainties in the modelling and likely experiences. But a shortfall of $400-500 million per annum is a touch more than 0.1 per cent of annual GDP. This year’s deficit forecast in yesterday’s PREFU was 2.7 per cent of GDP, and that too is only a point estimate within a (not formally specified) range. 0.1 per cent of GDP is simply not macroeconomically significant. That is so in respect of fiscal policy, but it is also true of monetary policy. In fact, on its own the revenue shortfall would make little or no difference to monetary policy because as I’ve pointed out previously – although National continues to resist the claim – the revenue wasn’t mostly going to be coming out of what would otherwise be local demand anyway.
One could add – and I will because I have repeatedly made this point about policy costings offices – that no poll at present suggests that the National alone will have a majority in the next Parliament. Under MMP in particular, manifesto promises (especially detailed ones) are mainly signals of opening bids in the negotiations to form a government or settle on a legislative programme. If National wins, actual details are near-certain to be at least somewhat different from what was in the Back Pocket Boost package.
That doesn’t mean this is all a big fuss about nothing. First, the signalling matters. When the fiscal deficit as it as large as it is, a major political party promising tax cuts really should be able to convincingly suggest to the public that the cost will be fully covered and that if their programme was adopted it would not worsen the already-large deficit. National’s package does not pass that test at present.
And, more generally, how they handle episodes like this provides us as voters with information about the people who want to run the government in a few weeks’ time. An assured performance enhances credibility. Otherwise, not so much. An assured performance might have meant there were no major questions about any costings at all (at least from anyone other than cast-iron partisans) even in a high- profile package. It might also have meant that if/when questions started arising, you’d be able to release some enlightening report from the consultants you hired to check your workings, or you might release your own workings – or a nicely written up version – yourself, or got some well-informed surrogates to tell your story. Your leader might even have persuasive lines to assuage doubts. In this episode none of that has happened, and it has been anything but reassuring about just how much on top of their game, ensuring detailed stuff is done well Luxon, Willis, and their key staff advisers really are. It may also speak to their instinctive response under pressure: openness and engagement or hunkering down defensively. Probably hardly anyone is going to change their vote on this one specific (perhaps they shouldn’t – lots of things matter more), but that isn’t the test of whether these things matter. They do.
I haven’t mentioned Castalia’s role in all this. In my first post on the package I pretty much took for granted that I’d be able to count on that. But as our joint report notes, and having seen the [Executive Summary of the] Castalia report, it offered no basis for any reassurance at all on the foreign buyers’ tax revenue estimates. It explained neither what National had done nor indicated what robustness checks Castalia had made. In fact, the single half-sentence reference to the tax has a distinctly “last minute add-on” feel to it. One would hope it was not so. RNZ reports this morning that Castalia is standing by their review, but we simply don’t know what that review consisted of, so that assurance adds barely any useful information.
In closing I am going to repeat my opposition to a state-funded policy costings office. It is up to parties themselves to decide what work they get done on policies and what material they release, when and how. In this case, the existing system is working, putting a spotlight on National and their estimates and giving them choices about how they respond and us information that we can use in forming our views of the party and its leaders. Is it messy? Yes. Is the substance a second-order issue? In many respects, yes. But much of politics, and much of life, is like that, even if technocrats would generally prefer it was otherwise.
As for the issue at hand, whichever way you look at the numbers it is hard – but not impossible – to see the policy raising much more than $200m a year, and not at all that hard – but not perhaps likely – to see it raising less.
UPDATE 16/9
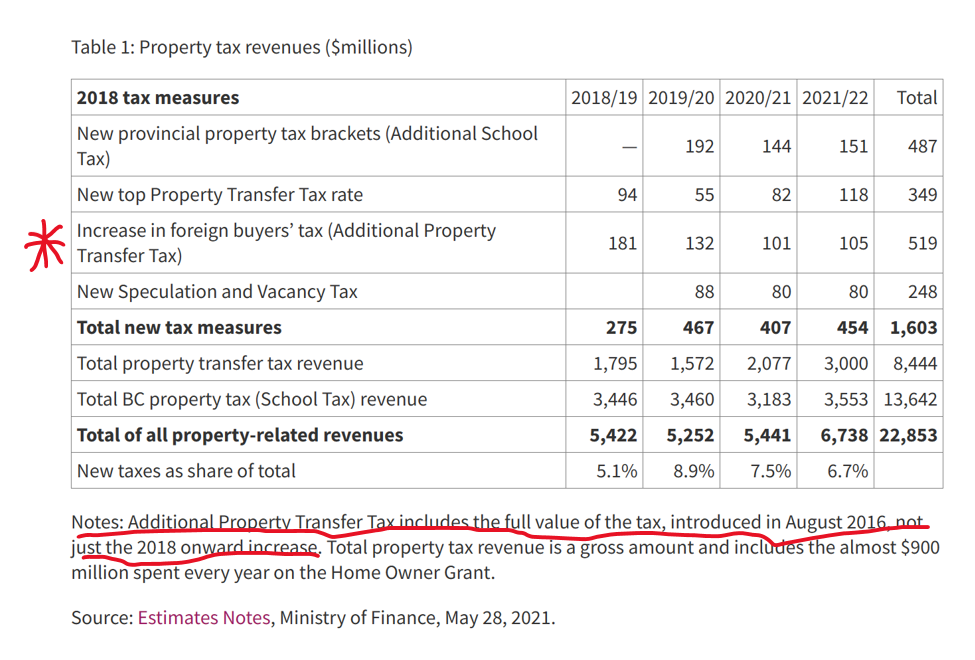
In the body of the post I used a Canadian think tank’s report on the Vancouver experience. That report quoted British Columbia Ministry of Finance revenue numbers, but I had not then got back to the source document. This table is from p321 in the PDF at that link.
Note that the parameters of the British Columbia interventions have changed repeatedly. They started with a 15% tax in Vancouver in (a surprise move in) 2016, and in 2018 both raised the rate to 20% but also extended the coverage to include some other areas including greater Victoria (another 400K people on top of Vancouver’s 2.6m). And from the following year’s Estimates Notes
Note that under the British Columbia tax rules you can receive a refund if you become a resident of Canada within a year of purchase. The data I have do not break about the scale ($m) of these rebates, but the gross revenue figures may be a bit higher than those shown in the Ministry of Finance table above.
Finally, on another aspect, this snippet is from the bit of the Castalia review that National has provided to some outlets (one of which gave it to us).
As an approach that seems fine. There are, however, no government estimates for the revenue impact of the foreign buyers’ tax.
Later in the same document there is a table, showing “National modelling” numbers on the left and “Castalia modelling” numbers on the right.
For some items it makes sense that there is no difference (when using government estimates). In others, they describe where and why there are differences.
What is puzzling if Castalia really did model estimates themselves for the revenue from the foreign buyers’ tax is that they came to exactly the same numbers in total and each year. Reasonable approaches will almost inevitably come to slightly different estimates even if they end up in much the same ballpark (eg in this case perhaps differences in how one might think of first year effects as a result of pent-up demand).
My point is not that Castalia did not honestly believe National’s numbers (I’m quite sure they did believe them to be reasonable) but to raise again the as-yet unanswered question as to just how much in-depth analysis and review went on for this specific line item.
In yesterday’s PREFU The Treasury was quite open about the fiscal impulse – the estimated impact of discretionary fiscal choices on demand and domestic inflation pressures in the current year.
In other words, a slightly larger degree of pressure on resources/inflation in the year to June 2024 than they’d thought in May’s Budget (and anything beyond the current year depends almost wholly on future budgets).
The IMF a few weeks ago had an almost identical estimate
Different measures, but very similar estimates of the impulse, the pressure fiscal choices are putting on inflation etc. It is an entirely conventional cyclical macroeconomic perspective.
On Radio New Zealand just now, the interviewer put the impulse point to Labour’s Grant Robertson. He pushed back, noting (correctly) that the Reserve Bank had been unbothered about fiscal policy in its recent statements, quoting one of Orr’s egregious lines that “fiscal policy was more friend than foe” for monetary policy.
He quotes the Bank correctly, but what the Bank says has no foundation in the numbers, or in any serious argument they’ve ever advanced. I’ve dealt with this in a couple of posts.
The first was back in July, in the wake of the July OCR review but unpicking material the Bank had included in the May Monetary Policy Statement.
The second was last month, following the August MPS and comments the Bank made at FEC the next day.
From that August post
I have been, and still am, hesitant about suggesting that the Governor and the MPC are operating in a deliberately partisan way. But it gets harder to believe such a pro-incumbent bias is playing no part (consciously or unconsciously) in their words and actions. I’ve documented previously the skewed, highly unconventional, and very favourable to Labour, way the Bank treated fiscal policy in May following the more expansionary Budget. In this MPS, the word “deficit” appears 44 times, but it appears that every single one of those references is to the current account deficit, and not one to the budget deficit (altho there is a single reference to “the Government’s plan to return the Budget to surplus”). The same weird framing of fiscal issues was there not only in the rest of the document but explicitly from the Governor this morning. He claimed that what mattered for the Bank from fiscal policy was only/mostly government consumption and investment spending, not taxes (or apparently transfers), let alone changes in structural deficits (the usual model). Having provided no supporting analysis or rationale whatever – speech, research paper, analytical note, just nothing – the Governor appears to have simply tossed the conventional fiscal impulse approach out the window, at just a time when doing so suits his political masters. Perhaps it is all coincidence, but either way it is troubling.
When I wrote that post I thought I should give the Bank a chance to put its case out there. After all, surely there would be some research or analysis they’d done which would back the distinctive and idiosyncratic approach to fiscal stimulus that the Governor had taken to touting this year? So I lodged an OIA request.
I am writing to request copies of any internal research, analysis or other less formal material undertaken by Reserve Bank staff in the last 12 months on the effect of fiscal policy on aggregate demand and inflation pressures.
I am also interested in (and thus this request includes) any material, internal or external, the Bank relies on to support the Governor’s claim at FEC this morning that what matters about fiscal policy for monetary policy purposes is government consumption and investment spending, or that explains why the Bank no longer appears to regard the Treasury fiscal impulse measure or a change in a structural fiscal balance measure as the relevant sorts of metrics.
Of course, if there had been anything of substance to see, it would have been a simple matter for the Bank to have responded by return email (or by putting out a pro-active release with relevant notes or research). Almost certainly there is nothing of substance, but the Bank isn’t any more keen to disclose that than it has been in times past when the Governor has simply made up stuff (including in front of FEC).
Yesterday I had an email from the Bank about my request.
The Official Information Act 1982 requires that we advise you of our decision on your request no later than 20 working days after the day we received your request. Unfortunately, it will not be possible to meet that time limit and we are therefore writing to notify you of an extension of the time to make our decision by 20 working days, to 12 October 2023. We will still provide you a response as soon as reasonably practicable, sooner than this date if possible and without any undue delay.
This extension is necessary because consultations needed to make a decision on your request are such that a proper response cannot reasonably be made within the original time limit.
If you believe that final sentence (a common one agencies like to invoke) you’ll believe anything. It wasn’t a complex request, it wasn’t a request for papers to or from other agencies or ministers or their offices. It was a request for material the Bank had to hand and/or had done itself. Can’t be hard to find…..if it exists at all.
But instead there is a 20 day extension which conveniently takes disclosure of what is (or more probably isn’t) there out beyond the last pre-election OCR review. Delayed embarrassment is valuable to bureaucrats with a track record of just making stuff up.
At the moment it smacks of the episode a couple of years ago when Orr told FEC, unequivocally, that the Bank had done its own modelling and research on the financial stability impacts of climate change, only for an OIA to show that they’d done none at all and in fact all they could offer was one short – and quite comfortable – staff note written a couple of years earlier. Perhaps the difference from then is that it could have been true – some central banks had done research – and just wasn’t. For the fiscal spin – which seems all too convenient politically- it seems most unlikely to be grounded in anything of substance.
So when the Minister of Finance tells people the Reserve Bank is unbothered about deficits and fiscal impulses don’t think “oh, well they have a big team or macroeconomists and should know” but (and sad to say) ask yourself instead which party winning the election is more likely to be in the personal interests of the Governor and RB senior management and Board. Because that is the most plausible – and I wish it were not so – explanation for the Bank’s fiscal lines at present.
On other matters fiscal, after the PREFU Christopher Luxon put out a statement which I responded to thus
Which is fine, but where is the alternative fiscal plan? The Back Pocket Boost package was advertised as only fiscally neutral(ie no inroads on the deficit), & it is clear that the foreign buyer tax numbers don't add up so for now the package adds to the already v large deficit. pic.twitter.com/droiTHGyl0
RNZ’s interviewer put this to Luxon (as the view of a “fiscal conservative” – a description I will embrace) this morning only for Luxon to dismiss it as “what a load of rubbish”. He is of course entitled to his view, but it would be good to see some solid arguments and evidence, or engagement with the substance of the criticisms I and others have made. Without it, voters are entitled to draw their own conclusions.
This morning’s post previewed PREFU at a high level, pointing out that both main parties had been in practice endorsing expansionary fiscal policy, and that the likely operating balance surplus that would be shown in the PREFU would really reflect nothing more solid than aspiration, even after the numbers had been gamed. Neither party seemed to have a concrete fiscal strategy or plan to actually close the deficit, a deficit which the IMF estimated a few weeks ago was one of the largest among advanced countries as a share of GDP.
As far as I can see there are no great surprises in the PREFU fiscal numbers. There is a small surplus in 2026/27, using the numbers the government told Treasury to use for its future spending plans. Anyone can plonk down a number. Delivering it is another thing.
There isn’t going to be lots of fresh analysis in this post, mostly (at least for fiscals) a series of charts I’ve shown on Twitter.
For example, here is how Treasury’s forecast of the operating balance (OBEGAL) as a share of GDP for the year we are now in has evolved just over the last 20 months.
The deterioration since the Budget this year is despite the economic position and capacity pressures (the output gap) being a bit less negative. This is a year for which the spending has now been appropriated, the taxes put in place etc.
What about the following year?
We aren’t anywhere that year yet, but the forecasts have already revised down massively.
And despite recent talk of renewed fiscal discipline and spending restraint, here are the projections for core Crown spending as a share of GDP, again for the next Budget year. The PREFU forecast share is higher again than the BEFU one. And this is before Ministers actually have to confront drawing up next year’s Budget.
The political parties want us to believe that we are on a track back to surplus. We aren’t. Instead, the Secretary has been given some numbers to be consistent with a surplus by the end of the period, and for anything else…..well, we just have to wait for successive Budgets under whichever government holds office.
As for Treasury, they have to be a little diplomatic, but here is their text about spending and operating allowances, and my summary commentary
The medium-term numbers in the PREFU are just not a serious contribution to anything much. They distract more than they clarify or reveal.
Whichever party forms the government they face tough choices over years if they were actually to be serious about getting back not to surplus, or even balance. If they aren’t serious then net debt will continue to rise as a share of GDP and within a few years we will have higher net debt as a share of GDP than the median advanced country.
I was also interested in the inflation and related numbers. Treasury is a bit more pessimistic than the Reserve Bank was in its last forecasts about how quickly inflation will come down. But they simply run with something like the Reserve Bank story of the OCR holding at current levels for some extended period.
There are odd aspects to that. For example, here is the inflation forecast to March 2025, 18 months from now – the sort of horizon monetary policymakers often focus on,
It is easy for your eye to focus on the fall in the inflation rate which, if it happens, will be a good thing. But note that 18 months from now annual inflation is still 2.7 per cent, well above the 2 per cent the MPC is supposed to focus on. All else equal, an outlook like that would normally suggest that further OCR increases were warranted. Treasury doesn’t show them, but then on OCR things they don’t really like being out of step with the Bank, and of course the Secretary to the Treasury, under whose name these forecasts are issued, is a non-voting MPC member herself.
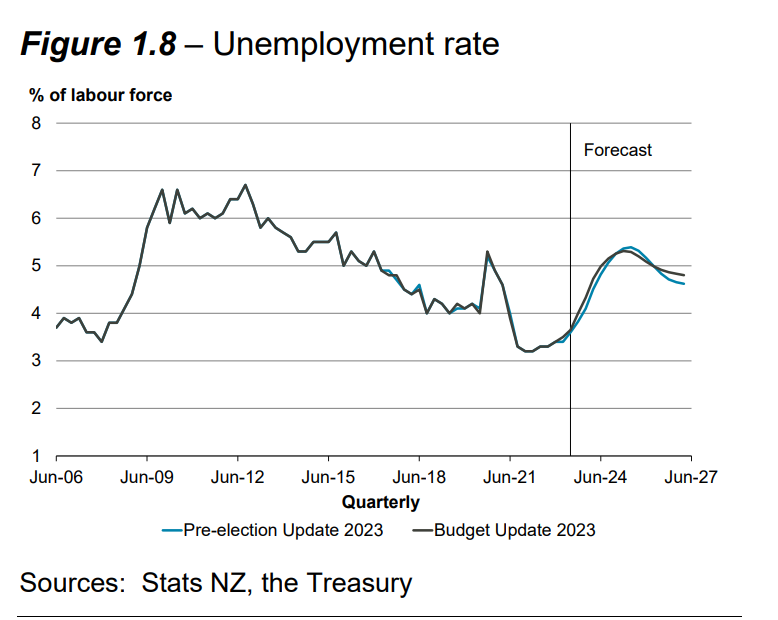
But what is a bit puzzling is how Treasury thinks that the inflation rate is going to come down so much at all. The unemployment rate, for example, never gets beyond about 5.5 per cent and doesn’t even stay there for long. It took materially higher unemployment rates for several years in the last recesssion to get inflation to fall much less than is needed now.
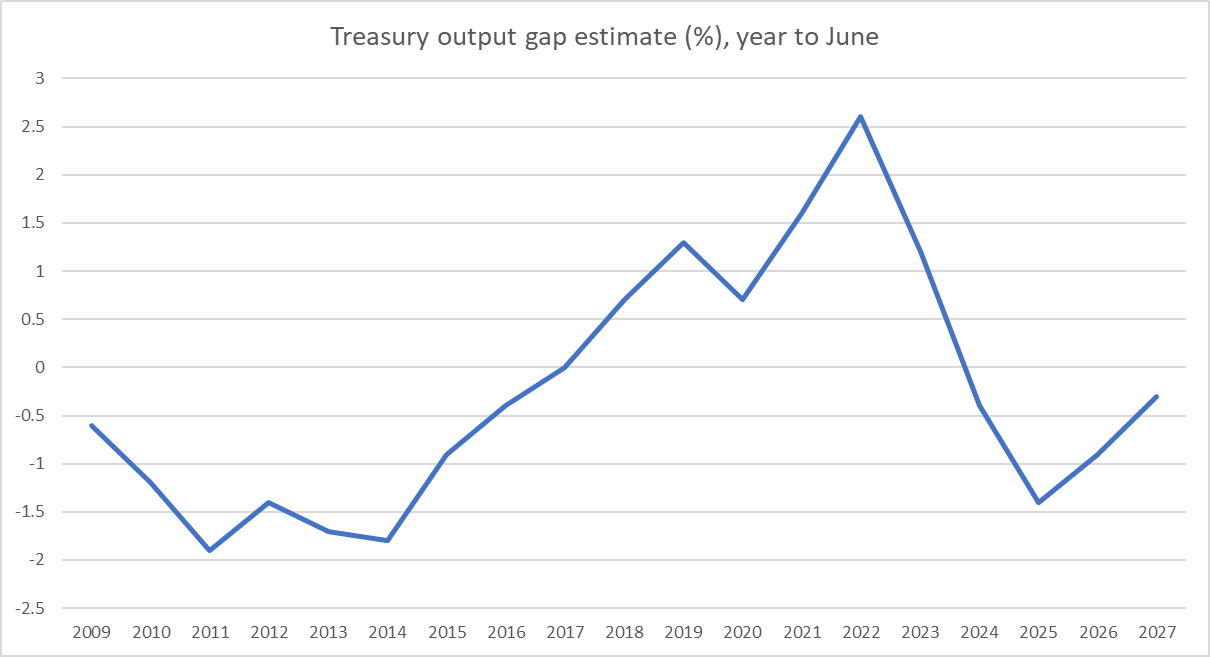
And what of the output gap estimates?
Yes, the output gap is forecast to go materially negative but only for one year, and we see in these numbers nothing like the sustained large negative output gap of the early 2010s…..again when the extent to which core inflation fell was nothing like what is being sought this time.
By contrast, the Reserve Bank’s numbers from their latest MPS tell a more consistent story
It simply isn’t clear on what basis The Treasury expects core inflation to fall so far so (relatively) fast: core inflation is expected to roughly halve over the next year even though the output gap over the year to June is barely negative, and unemployment by next June is still only 4.8 per cent, barely higher than what Treasury seems to regards as a NAIRU.
Perhaps expectations will do the bulk of work. If you wish really really hard and truly believe then…..Treasury seems to say – you can have core inflation a long way down without anything too nasty economically along the way.
Perhaps…
(Finally, and incidentally, Treasury seems to assume some reasonably robust productivity growth over the forecast period. I’m not at all sure why, or on what basis?)
No doubt there will be a great deal of coverage of fiscal issues later in the day, once the PREFU numbers are out.
There will, no doubt, be lots of talk of possible operating surpluses years down the track. Little or no weight should be put on those numbers, which have in any case been gamed by the Labour Party in government (they tell Treasury what their policies – future operating allowances etc – currently are and Treasury simply represents that in their fiscal forecasts), and which represent aspiration rather than specific commitments and adjustments which would turn those stated aspirations into reality.
But even though both sides will no doubt utter pieties about getting back to surplus some time, both have been operating this year in ways inconsistent with such pieties. It seems safer to judge parties by their specifics (actions and immediate commitments) than by rhetoric about the medium term.
Labour is not necessarily making big specific campaign commitments now. That is because they already got their bids in in this year’s Budget, which was significantly expansionary (and not just because of one-off weather expenses).
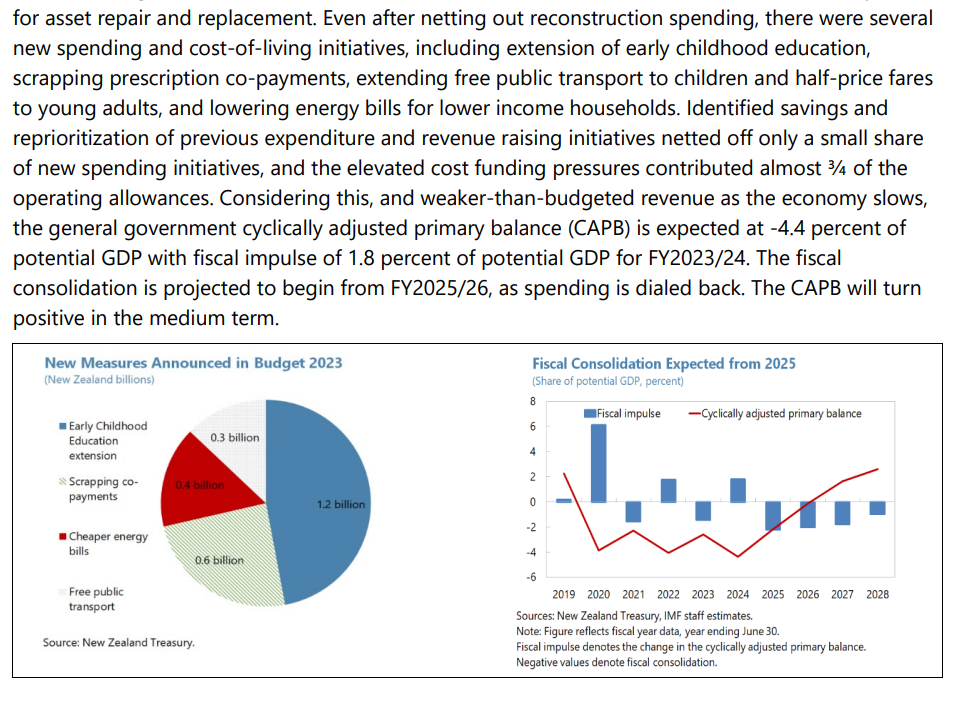
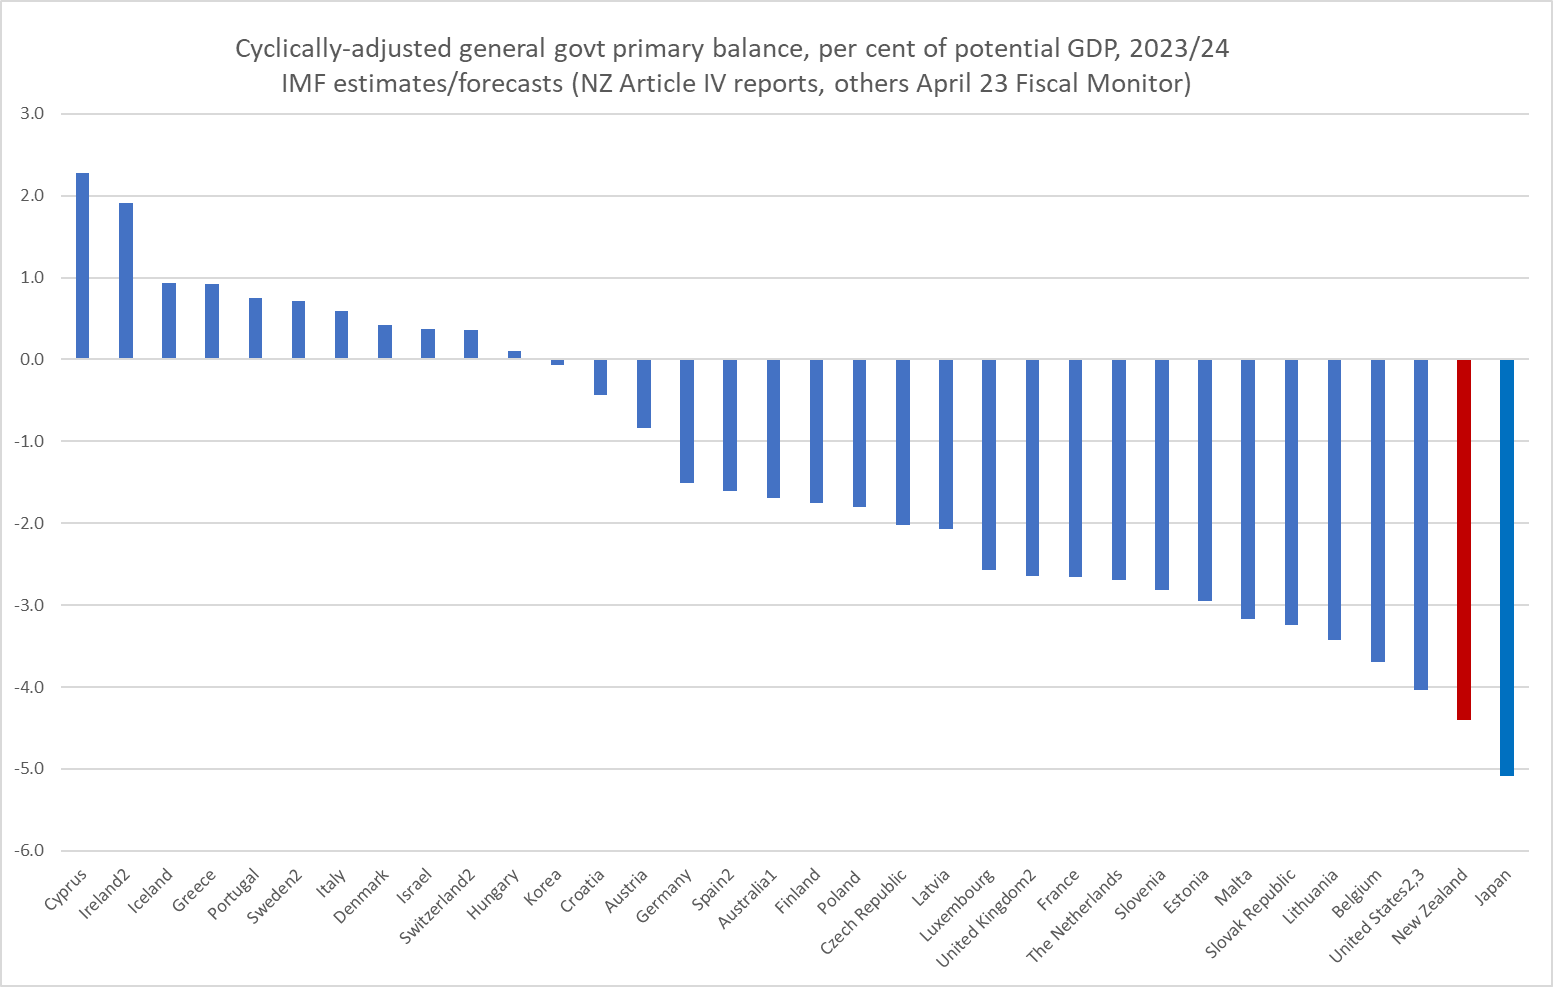
Here was how the IMF saw things fiscal (based on actual policy, legislated in this year’s Budget) in their annual review of New Zealand published a few weeks ago.
Last year’s Budget had been expansionary too.
The IMF followed this analysis, in which they highlighted just how large the cyclically-adjusted primary deficit is, with the observation that while some post-cyclone stuff needed to be done the New Zealand authorities should aim for a “frontloaded fiscal consolidation”. In other words, cutting the underlying now……not several years down the track.
The IMF’s fiscal impulse estimate was very similar to The Treasury’s, as reported in the Budget documents in May
It wasn’t good fiscal policy, and it was operating directly in conflict with monetary policy, increasing the amount of interest rate adjustment the Reserve Bank had to do to get inflation down again.
We haven’t seen anything like a fiscal plan from Labour yet, but there have been individual policy promises. On the tax side, Labour wins the “mess up the tax system” award by paying for one policy (GST off fresh fruit and vegetables) which is abominated by pretty much all experts and will mess up a good tax (doing any good very inefficiently), by adopting another highly distortionary and inefficient tax (removing tax depreciation from non-residential buildings). But there don’t seem to have been any particular questions raised about the costings (and while there have been about the dental promises, they are years down the track).
So Labour’s approach to fiscal policy this year has been quite expansionary, worsening the fiscal situation and complicating monetary policy and the fight against inflation. Using the IMF’s numbers – but before whatever deterioration this afternoon’s numbers show – I ran this chart last week
We have, currently, one of the largest fiscal deficits of any advanced countries.
What of the main Opposition party, National? Opposition parties are at a slightly disadvantage in electoral auctions because governing parties, being the government of the day, get to legislate their excess first.
But National seems quite content to go along with that as the starting point. A couple of weeks ago they came out with their tax and spending plan (I wrote about it here). It claimed to be a fully-funded package that would not worsen the fiscal situation beyond what Labour had already delivered. Which would be bad enough: Labour runs successive expansionary budgets, dramatically worsening our underlying fiscal position, and National goes….well, that’s fine, we’ll just reorganise some tax and spending settings and not feel obliged to do anything about the deficit itself. They claimed at the time that they’d have a separate “fiscal plan” coming after the PREFU, but Luxon was quoted yesterday as saying that whatever was in the PREFU wouldn’t change anything about the (flagship) tax and spending plan released a couple of weeks ago. That isn’t really surprising (I pointed to this likelihood in my earlier post) and I guess now the question will be whether they bother announcing a “fiscal plan” at all. If they do, it seems unlikely to have any more substance than Labour’s pieties (an operating surplus by the end of the period, but no clue as to how concretely that might be delivered). Neither party in campaign mode shows any sign of actually cutting anything….. more a case of finding more relatively inexpensive baubles to throw at voters.
National also wanted us to believe that their fully-funded package would not add to demand and inflation pressures. As I noted in my initial post, that didn’t seem very likely, as the package delivered lots of people with high marginal propensities to consume, while being funded in substantial part from overseas house buyers (not, by construction, paying tax from New Zealand produced incomes).
But the actual situation is worse than that. No expert, no one who has looked carefully at the data or other relevant experiences, thinks that the proposed foreign buyers’ tax will raise anything like the $735m National expects year in year out (if there is pent-up demand perhaps it would get quite a bit closer in the first year (only), but not beyond that). The gap is quite large in the context of their package.
And so we go into the PREFU this afternoon, and whatever spin the two parties’ spokespeople are going to put on fiscal prospects with (a) a governing party that has already run up really big deficits, adding more fiscal expansion in their election year budget, with no specifics on how they might close those deficits (including in the face of ongoing cost pressures), and b) a main Opposition party which was seemed content to go along with Labour’s expansionary stance (just rearranging some of the tax and spending pieces), but in fact seems to have ended up with an even more expansionary stance themselves. (It doesn’t do to overstate the differences: the big picture is really large fiscal deficits and rising debt, which doesn’t seem to greatly bother either party, while the probable shortfalls in National’s package around the foreign buyer tax amount to an additional 0.1 per cent of GDP on the deficit each year. The additional credibility damage is probably greater than the fiscal damage.)
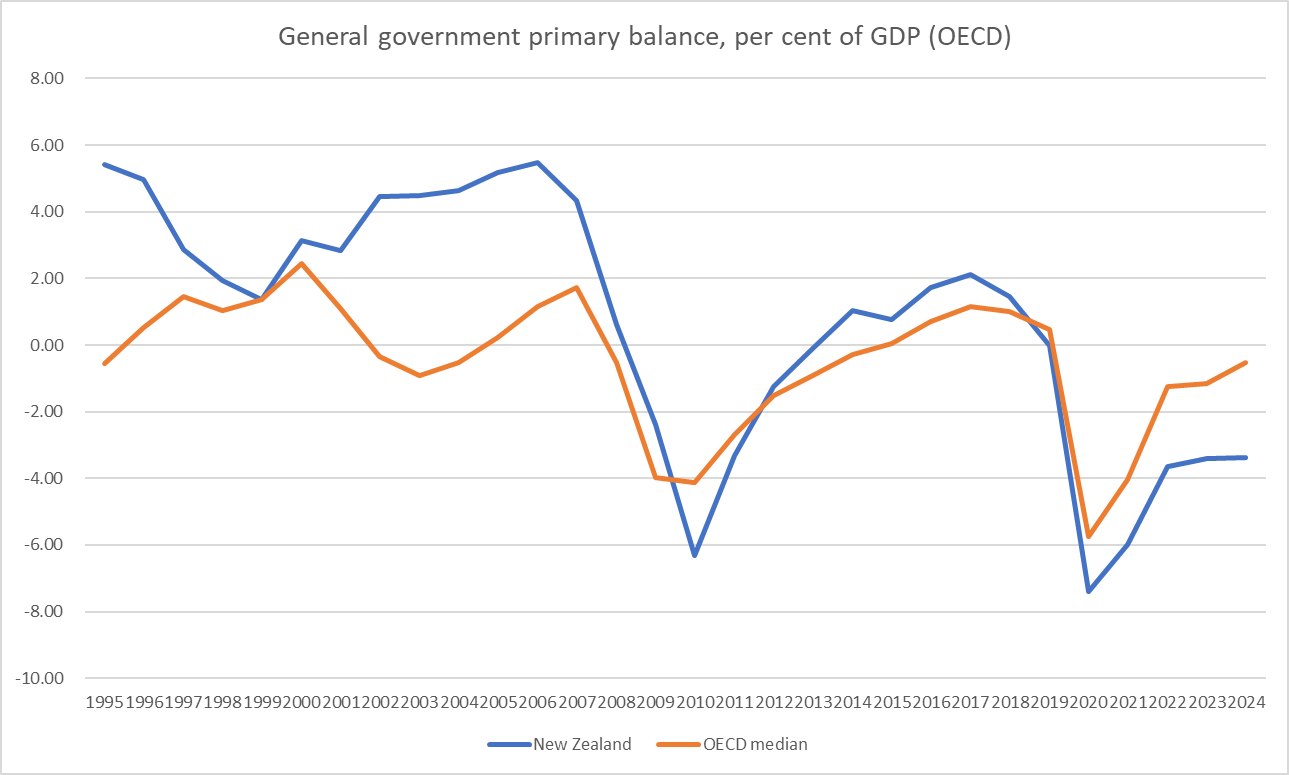
Finally, the debt. We have had 20 years in which New Zealand governments’ ran net debt as a share of GDP materially lower than the median OECD country. That gap is closing fast (this chart is using data well before the recent deterioration in New Zealand revenue flows).
And it isn’t a Covid thing. The point made by the chart is that the median country saw a brief Covid blip, but now has net debt as a share of GDP a bit lower than in 2019. In New Zealand, by contrast, by the big Covid spending well behind us, both parties seem okay with debt still rising rapidly (they may say otherwise, but judge them not by the handwaving medium-term rhetoric but by their specific and immediate actions and commitments.
Yesterday’s post outlined some of the fiscal balance numbers that should get more focus in New Zealand but typically don’t (partly because The Treasury does not usually also make their numbers available in internationally comparable definitions and formats).
That post was partly background to today’s, in which I want to show first how the current New Zealand fiscal numbers – as at this year’s Budget, so near-certain to be less favourable next week at least in headline terms – compare with our own experience in recent decades, and then to put New Zealand’s numbers into international comparisons, both across countries (other advanced countries) and across recent decades. It will cover some ground similar to a post a couple of weeks ago, but whereas that week I was writing a series looking at countries which had their own monetary policies (with an inflation lens in view), and thus the euro-area was a single observation, in this post I’ll be looking at advanced countries (using IMF and OECD data) regardless of what monetary policy arrangements they have. The focus here is entirely fiscal.
I’m also not going to be paying any attention to anyone’s forecasts beyond 2024 (ideally 23/24). Fiscal numbers up to fiscal year 21/22 are hard, those for 22/23 are estimates (from the Budget), and those for 23/24 (also Budget) are based on (now) legislated taxes and appropriations. For anything beyond that one can look at cost pressures, one can look at political party promises, one can look at announced (frequently revisited “fiscal rules”) and so on, and do a different sort of analysis. But bottom-line fiscal forecasts several years ahead have little or no meaning.
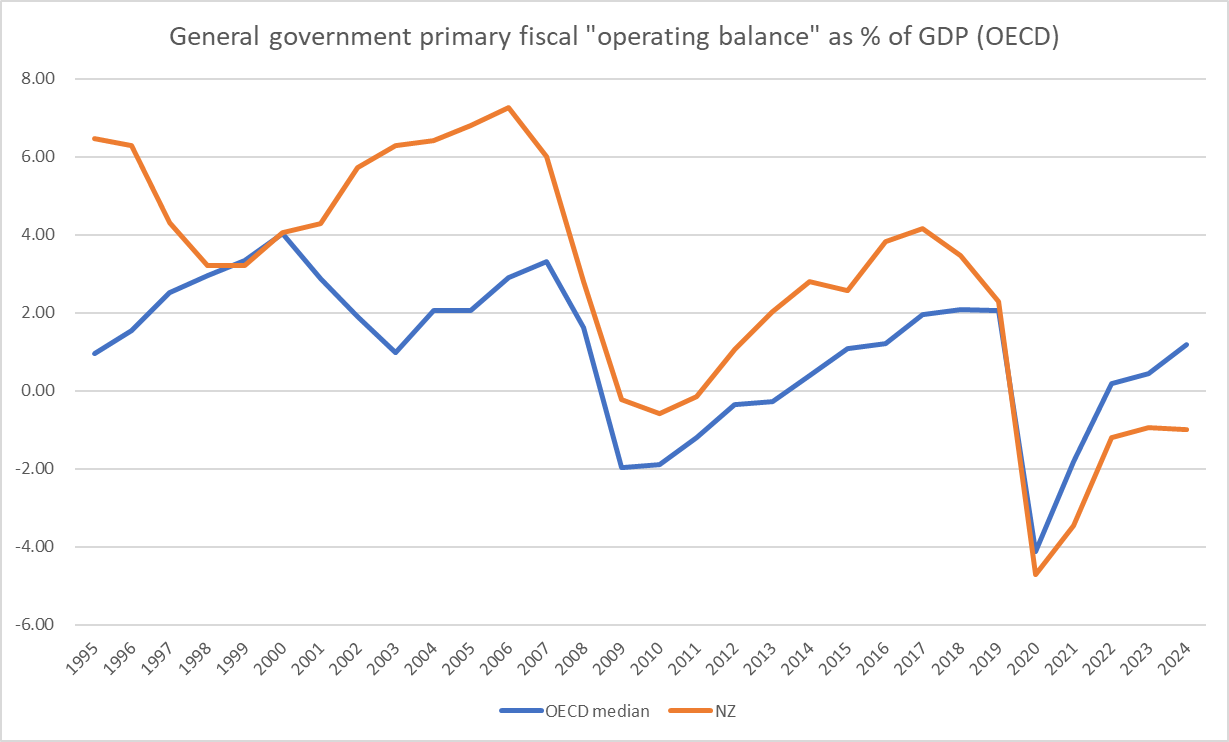
The first chart shows the government’s (and, apparently, Treasury’s) preferred indicator: the operating balance (OBEGAL) as a per cent of GDP. As a reminder this is a theory-free and total Crown measure. The data go back only to 93/94.
On this measure we had 15 years of surpluses (under governments of both stripes). Then through some mix of poor Treasury advice and severe recession there were deficits, briefly but greatly exacerbated by the fiscal effects of the Canterbury earthquakes. This measure was back to surplus in 2014/15 and (rising) surpluses continued to be run by governments of both stripes for the following five years. Covid meant a loss of revenue and a choice (widely supported) to provide a lot of fiscal income support. A really big operating deficit in 19/20 understandably followed. Renewed lockdowns in late 2021 had a similar but smaller effect on the 21/22 numbers, but by then the economy was running strongly and inflation was rising sharply, and inflation is at least initially a windfall for the fiscal authorities. For the last two years (free of required Covid spending), the deficits are just under 2 per cent of GDP. The economy was more than fully employed in 22/23 and in the Budget forecasts was expected to be around fully employed on average over 23/24 (small negative output gap, unemployment rate averaging a bit below NAIRU).
As I noted yesterday, Treasury doesn’t publish a long-term time series of cyclically-adjusted balances, but this chart back to 2008/09 shows much the same picture
You might reasonably be a little sceptical about whether the cyclical adjustment effects are quite large enough (but New Zealand automatic stabilisers are not typically regarded as overly powerful), but these are the best estimates Treasury was giving us (and the government). There really isn’t much case for running cyclically-adjusted operating deficits (even OBEGAL deficits). It has the feel of borrowing to pay the grocery bill.
Governments (and Treasury) have chopped and changed the debt definitions they like to focus on. For the current (and better) favoured net debt measure, they have only backdated the series as for as 2004/05. But here is the chart, expressed as a per cent of GDP
Still not very high in absolute terms, but now the highest in at least 20 years (and in practice quite a bit longer than that).
And here is one last chart just using Treasury headline series; this one one which doesn’t get much attention but is measured a bit more like the IMF and OECD series we’ll come to later
It is a less rosy story after 2008, as the return to surplus lasted only two years (16/17 and 17/18) and the forecast deficit for the current year (23/24) is about as large as that in 2010/11 (earthquake year), and almost as large as the two peak Covid years. Treasury don’t do cyclical adjustment on this series but any adjustments would be fairly similarly small as those for the operating balance (above).
Those four charts just use series straight from The Treasury’s website. There are no adjustments, no approximations, no derivations, just reportage. And because they are idiosyncratic New Zealand series we can make comparisons only over time and not across countries.
As I noted in yesterday’s post, primary deficit measures (ie excluding interest) are a common feature in international agency perspectives (and databases) on fiscal stances. Treasury does not publish any such measures for New Zealand. We can, however, make an approximation. They are only approximations as the only long-term time series for finance costs that Treasury provides is core Crown while the OBEGAL operating balance is total Crown concept, and while residual cash is a core Crown measure it is cash-based while the core Crown numbers are accruals. In addition, in principle one should exclude interest receipts as well, but the time series data only breaks out only finance costs. It is less than ideal – Treasury, please start publishing some proper primary balance numbers – but I’m going to here adjust both the operating balance and residual cash for core Crown finance costs and keep my fingers crossed that if the levels aren’t quite right the comparisons over time will be more or less valid.
The primary operating balance is all but in balance this year (at least as at this year’s Budget), albeit a very long way below the primary surpluses we once more or less took for granted.
And if one wanted to tell a more favourable (and analytically valid) story one could note that in the last couple of years more than all the finance costs have just been compensation for inflation (eg 6 per cent inflation in the year to June while all government bond and OCR rates have been below that). If we did an inflation-adjusted operating balance series it really would have been probably around balance in 22/23. But that won’t be so in the current year, at least on current Reserve Bank inflation and OCR forecasts.
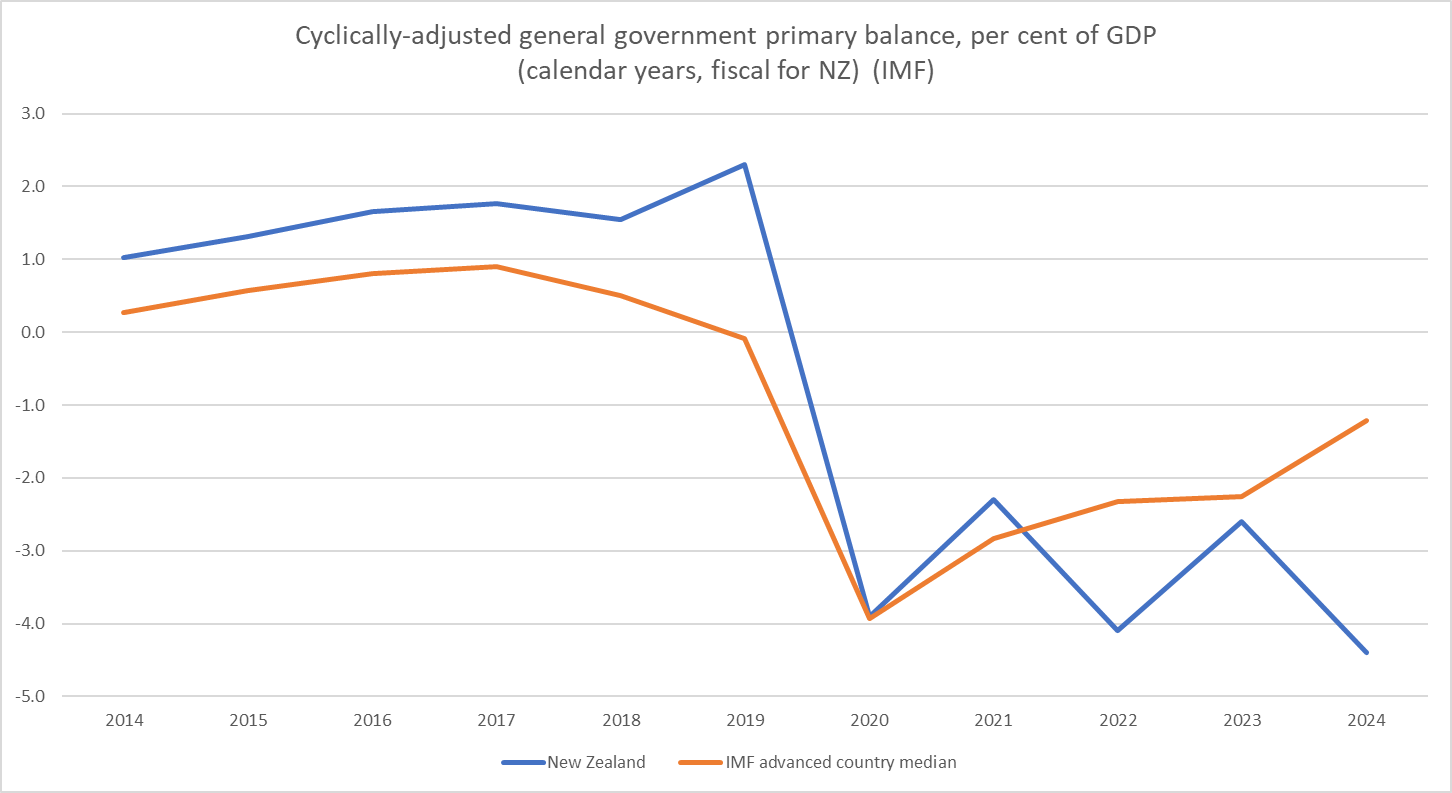
But at this point I’ve largely exhausted what can be done with official New Zealand data and have to turn instead to the OECD (mainly) and IMF databases, the two main compilations of (as far as possible) consistently-reported fiscal data and estimates/forecasts. These measures are all for the (national accounts) general government concept (which does not map directly to Treasury data for even central government New Zealand data), encompassing all levels of government. We don’t have provincial/state governments in New Zealand, and local government is small, but for valid cross country comparisons general governnment is the way to go. As to timing, the OECD numbers are from June (so probably incorporate budget numbers), but the IMF Fiscal Monitor numbers are from April (but we have a partial update from the IMF Article IV report released last week)
Neither the IMF nor the OECD report operating balances, whether headline or primary. However, if one digs down in the databases one can construct one’s own (as they provide data on current disbursements, current receipts and net finance costs as shares of GDP). Here is how we’ve compared against the 32 OECD countries (not including the Latin American ones) for which there is complete data.
Prior to Covid there was only year in the 25 in which New Zealand’s primary operating balance was even marginally below the OECD median. Since then, we’ve been running larger deficits and if anything the adverse gap was thought earlier this year still to be widening.
For this year, they had New Zealand’s deficit 7th largest in the OECD, and next year 6th largest. That was months ago.
And here is one of the series that the OECD themselves headline, the primary overall balance (current and capital)
The picture is fairly similar to the (derived) “operating balance” one. Previously the only time we’d been worse than the OECD median was with the Canterbury earthquakes (which put a large liability on the Crown through EQC). We used to better. Now we are worse. (On these forecasts a few months ago, 5th worst this year, second worst next year).
I’ll spare you the cyclically-adjusted version of this chart, just noting that on OECD cyclical adjustment methodology (consistently applied across countries) as at a few months ago the median OECD country was expected to be running a (tiny) surplus next year and New Zealand a substantial (2.5 per cent of GDP) primary deficit. Only Japan was then expected to have a larger cyclically-adjusted primary deficit.
And one last fiscal balance chart. This one shows the national accounts net lending measure for the general government sector
We used to be consistently better. Now (since Covid began and on mid-2023 forecasts even this year and next) we are materially worse. The differences here are not small (a 2 percentage point difference now is roughly $8 billion per annum for New Zealand).
And here is a chart of general government net financial liabilities as a per cent of GDP.
The New Zealand line looks a lot like the (shorter run) of central government Treasury data shown earlier. But it is the international comparison that is interesting. We often here talk about how low New Zealand government debt is, but actually the median OECD country just isn’t that heavily indebted either (although places like the UK, US, Japan, and Italy really are). We are still lower than the median country, but on these projections from some months ago the gap is closing fast. And notice that the median OECD country experienced a one-year blip up for Covid costs (and revenue losses) but now has lower net debt as a share of GDP than in 2019. New Zealand not so much. We have had one of the largest increases in net debt, as a share of GDP, whether one looks at the entire period since 2019 or just the final three years (our need for heavy Covid spending, like that of other countries, largely ended in calendar 2021). It is worth remembering that today’s highly indebted countries were not always so (eg as recently as 2001 the UK had lower net general government financial liabilities as a per cent of GDP than we do now).
Finally we turn to the IMF. They have a smaller set of indicators, but the same headline and cyclically-adjusted primary, overall, and net lending balances, and a net debt measure. To avoid being repetitive, I won’t run all the charts. They don’t provide such a long run of historical data but the broad pictures seem pretty similar to those with the OECD numbers.
However, in their Article IV report on the New Zealand economy last week the IMF provided an updated forecast series for several fiscal variables. Although the numbers were published last week the report was finalised in July, based on a mission here in June. This was the report that suggested that “frontloaded fiscal consolidation” should be the focus, pointing out in the text that the Budget had been quite expansionary (NB: contrary to the assertions of the RB Governor) that they estimated a cyclically-adjusted primary deficit of 4.4 per cent of GDP for fiscal year 23/24).
Here is a comparative chart for the last decade. We used to better. Now we are (quite a bit) worse. On the IMF’s cyclical-adjustment methodology our primary deficit this year will be larger than in any of the heavy Covid expenditure years,
And for a straight cross-country comparison (using the IMF’s Article IV estimate for the New Zealand 23/24 fiscal year and the average of their calendar 23 and calendar 24 estimates for the other countries.
Looking at the change since 2019, New Zealand has had the worst deterioration in its cyclically-adjusted primary balance as a per cent of GDP of any of these countries. The deterioration in the net lending indicator looks to have been very similar.
And one final chart. The IMF has a different measure of net debt again (and there is a slightly different group of countries than the OECD) but the picture for the last decade is broadly what we’ve already seen from the OECD data.
Here I have shown the IMF’s 24/25 number, not because it is sure to happen (next year’s Budget will be a thing) but because this is the most recent set of official agency numbers, and presumably part of the backdrop to that “frontloaded consolidation” call that both parties seem determined to ignore prior to the election. For this group of advanced economies the median country’s net debt to GDP has increased hardly at all since 2019. Back then the median was far above New Zealand. All it would take is another year or two of New Zealand governments continuing as ours have done in the last few years and we’d have net debt above the advanced country median (whether you like at this IMF version or the OECD one above). I hope there wouldn’t be many takers for that option, in our underperforming low productivity growth economy.
Every single of one of these charts is based on data either up to date to Budget time, or in the IMF’s case perhaps a month later. It is clear that the revenue picture to be revealed in the PREFU will be worse. (Labour’s changes last week to forward operating allowances will limit the damage to forward deficit estimates both those and the departmental baseline adjustments should be treated at this point as little more than electoral vapourware. Lines on graphs do not amount to concrete decisions to cut this or that and keep it cut. And cyclically-adjusted deficits do not fix themselves.)
The numbers The Treasury will release in its PREFU next week will make it fairly easy to follow some bits of New Zealand fiscal policy over time, less so others, but do almost nothing to facilitate international comparisons, and discourage New Zealand users and analysts from looking at fiscal policy in the way most other economic analysts and the international agencies do. It is fairly transparent, but in an insular way.
New Zealand’s government accounting framework often wins plaudits. As a matter of accounting, no doubt the plaudits are largely fair (although I’m not an accountant, and have previously suggested that some accountants rather overrate the contribution of the New Zealand model). It just isn’t a framework used widely for economic analysis or as a good basis for holding governments to account for the conduct of fiscal policy.
The focus here tends to be on the operating balance (excluding gains and losses). Last year, for example, the current government articulated its primary fiscal goal as being to (eventually) deliver and maintain an average (OBEGAL) operating surplus of between 0 and 2 per cent of GDP. It is a fairly theory-free measure
attractive mainly for being relatively more controllable year to year than a simple operating balance would be. But it is the first of the handful of “Fiscal strategy indicators” in the tables Treasury publishes. It was the measure that was forecast to turn positive (surplus) in 2025/26 in this year’s Budget (before they realised they’d forgotten to allow for the near-certain loss of lots of tobacco excise revenue), but in 2024/25 in last year’s Budget (and perhaps in 2026/27 in next week’s PREFU). It is the measure that was still in material deficit in 2022/23 and 2023/24 even at Budget time, before the deterioration in the tax revenue this (calendar) year became apparent.
But an operating balance measure (OBEGAL or total) isn’t widely used for fiscal analysis purposes elsewhere. In fact, if you turn to the two main compilations of comparable cross-country fiscal data – the IMF Fiscal Monitor and OECD Outlook – you won’t find any operating balance data at all (although you can put together such numbers yourself from components in the OECD database).
There are a couple of good reasons why that isn’t the focus.
Operating balances sound good and commercial, somewhat akin to a profit and loss account for a business. Capital expenditure typically doesn’t appear in a profit and loss account, and nor should it (as with New Zealand government accounts depreciation appears in a profit and loss account, and in the government’s operating balance). But when a business does capital expenditure it does so with the goal of generating future income (or maybe reducing future costs) but that is rarely the case with government capital investment spending. New Zealand’s total Crown OBEGAL does take account of the Crown’s ownership interests in various profitable businesses (which is not the case with the standard general government concepts used in the national accounts and in most cross-country fiscal analysis, where commercial business interests are excluded by construction) but most total Crown capex is just another form of spending. It might – like operational spending – be done for good reasons, it might have expected benefits down the track, but any such benefits are rarely fiscal in nature. And today’s capex is tomorrow’s depreciation (with no new matching revenue). In principle, the worse the project the larger and sooner the economic depreciation.
The second reason is the role of interest (financing costs). It is very common in overseas and international agency fiscal analysis to focus on primary balances, which exclude financing costs. These series are prominent in IMF and OECD tables. In New Zealand the Treasury publishes no primary balance measures at all and never seems to discuss the concept (one can construct some yourself, although probably only as reasonable approximations)
There are two good reasons for a primary balance focus. The first is that interest payments mostly reflect past fiscal choices rather than today’s (if your country ran up a high debt a decade ago, you are most probably still servicing that debt now). It is a real fiscal burden now (and thus primary balances aren’t the only relevant metric) but what matters more for the future debt trajectory is what choices are being made now re non-interest spending, and revenue. Broadly speaking, if you are running a primary surplus debt (to GDP) is likely to be heading in broadly the right direction, and if you are running a material primary deficit, then debt probably isn’t going to be heading in the right direction (it depends on your respective interest rates and GDP growth rates).
The other reason for a primary balance focus hasn’t been very relevant in advanced countries for several decades but is now: inflation. When inflation is low nominal interest rates tend to be low. When inflation is high nominal interest rates tend to be high. If interest rates are 2 per cent and inflation 2 per cent, the substantive economic implications for government finances are no different than if inflation is 5 per cent and interest rates are 5 per cent (real rates are the same). But nominal interest is what is recorded in the government accounts (and in those New Zealand government operating deficit numbers I mentioned earlier). It makes a difference: at present government bond rates and the OCR (much of the Crown’s debt is currently those RB settlement account balances) have increased a lot, but are actually both still below the rate of inflation. In economic substance terms, the operating deficit numbers in the Budget (and those to be published next week) are materially overstated.
(Inflation adjustment issues are pretty pervasive – company accounts and individual debt burdens, not just the government’s – are just another reason why we shouldn’t be tolerating a central bank doing such a poor job on core inflation that we have start thinking again about how inflation distorts both behaviour and accounts.)
Now it is true that The Treasury doesn’t just publish (total Crown) operating balance (OBEGAL) numbers. Second on that table of Fiscal Strategy Indicators is a measure called “Core Crown residual cash”. Unlike the OBEGAL it is (a) measured on a cash basis (not accruals), b) is a core Crown measure (not total Crown), and c) it treats all cash (capex and opex) alike. It is, in other words, much more akin to the series that show up in those international databases (but note that neither core Crown nor total Crown is the same as “central government” for national accounts purposes, let alone “general government” – which is vital for cross-country comparisons with countries where state/provincial and local governments make up a much bigger share of overall government activity)
When I went to work for a while at The Treasury I vividly recall one of their more astute analysts encouraging me to focus on this measure. Few in New Zealand seem do (and I only inconsistently across time). Neither political party seems to. And in case you were wondering, in this year’s Budget – recall, before the fall off in tax revenue – the core Crown residual cash deficits were expected to be 5.7 per cent of GDP in 22/23 and 6.5 per cent in 23/24.
The ups and downs of the economic cycle affect fiscal balances. Expenditure is affected to a small extent (eg unemployment benefits) but the main impact is on the revenue side (tax receipts). Consistent with that it is common to look at, and the international agencies, publish estimates of cyclically-adjusted deficits (total and primary).
The New Zealand Treasury does typically publish estimates of the cyclically-adjusted operating balance, but not of even any other measures, and notably not of any primary balance measure. One could do one’s own rough and ready adjustments to the alternative series, but how much better if Treasury were doing the adjustments themselves, using disclosed the contestable methodologies. There is also no long-term consistent time series (eg published with the annual long-term fiscal data on The Treasury website). There is no one right answer to how much allowance should be made for cyclical factors in doing cyclically-adjusted numbers – it is the same contests around the output gap and the NAIRU as monetary policy makers repeatedly face (and estimates are likely to be revised, perhaps quite a bit, over the years) – but in big booms and deep recessions it is important to try (normally we would not want deep fiscal cuts if we could be reasonably confident a deficit was mostly a reflection of a deep cyclical downturn).
Until relatively recently, The Treasury used to publish (but buried very deep in an Additional Information document) the operating balance on a terms of trade adjusted basis (a higher/lower terms of trade – variable and largely outside New Zealand control – can flatter/punish fiscal outcomes independent of government fiscal policy choices. Here is an example, from the 2017 PREFU, of how much difference Treasury thought the rising terms of trade had made in improving fiscal outcomes over the previous decade.
As the terms of trade trended upwards fairly consistent over 15 years, the adjustment perhaps became somewhat moot. In the last few years, on the other hand, the terms of trade have been falling back.
Much of this post so far has been about how we might better analyse New Zealand numbers in isolation, but international comparisons also matter. Why? Because there are no single right and wrong answers about the appropriate deficits or surpluses or debt levels, but we can often make better sense of our own data if we can compare and contrast with developments in other advanced economies. But comparing and contrasting needs to involve data compiled as consistently as possible across countries (as, say, with cross-country comparisons of GDP growth and productivity, and where comparisons of inflation are often complicated by the absence of such consistently compiled measures). For those purposes, the fiscal databases and forecasts done by the IMF and the OECD are the standard. In those databases we can find raw and cyclically-adjusted primary and overall fiscal balances, gross and net debt measures, and measures of net lending (savings less investment), all on a general government basis.
Both the IMF and the OECD produce numbers for New Zealand, including forecasts for the coming years. These are typically done starting Treasury’s fiscal numbers and adjusting for (a) different views on the state of the economy, and b) the methodological differences between the New Zealand measures and these internationally conventional ones. At times – eg the IMF Article IV report last week – they will provide some updated estimates, but generally the IMF and OECD numbers are published only twice a year.
But in the Treasury numbers accompanying the EFUs there is no attempt made to present their updated numbers in an internationally comparable format (not even just as an appendix), whether flow or stock measures. On the face of it, doing so should be a relatively mechanical exercise that would require a one-off investment to set up but almost no marginal resource cost beyond that (especially when the non central government components of general government are small and slow moving in New Zealand). And yet they choose not to do it, and as a result serious international comparisons are harder than they need to be. There will be some new IMF WEO estimates for New Zealand in October, but they are likely to emerge just a couple of days before the end of our election and won’t be able to inform discussion/debate of the fiscal situation. But Treasury could have produced their numbers in IMF and OECD formats.
This has been something of a background post with little data and just one chart. Tomorrow I will do a post looking at some of these better measures (NZ specific and internationally comparable) across time and across countries (OECD and IMF advanced economies) to put some light on how things stand right now, and have evolved in recent years. PREFU will then give us some more – apparently gloomier (although how much of that will be judged cyclical?) – data next week.
Anyone with even a vague interest in matters fiscal (or those with little real interest but some responsibility) is now awaiting next Tuesday’s pre-election fiscal update (PREFU).
PREFU is a good to have, and much better than nothing, but could be made quite a bit more useful and relevant for what must be presumed to be its ultimate purpose, informing the pre-election debate around matters fiscal. The current law governing PREFU is a single (full page) clause in the Public Finance Act.
For a start, it should probably be moved a week or two earlier. The law requires as follows
The Minister must, not earlier than 30 working days, nor later than 20 working days, before the day appointed as polling day in relation to any general election of members of the House of Representatives, arrange to be published a pre-election economic and fiscal update prepared by the Treasury.
which would be fine if we thought of polling day as 14 October. 12 September (next Tuesday) is more a month before that. But since that law was passed, advance voting has, for good or ill (I think mostly ill), come to make up a very large share of votes cast, and advance voting opens less than 3 weeks after the PREFU will be brought down. Changing the law to require the PREFU to be published 20-25 working days before polling opens would seem consistent with the spirit of the original legislation now that voting arrangements/patterns have changed so markedly.
Obviously there are trade-offs. There are significant lags involved in bringing the Treasury EFUs together, but the point of the exercise is to inform voters and enable scrutiny, debate, and challenge, including around political parties’ programmes in response to the PREFU numbers (this is mainly an issue for Opposition parties, as the governing party not only has the advance information from Treasury but can ensure some of its policy stance is included in the PREFU numbers themselves, when communicated to Treasury as government policy (eg stance of future operating allowances)). Note that the PREFU is not, and cannot realistically be counted on as, the “opening of the books” for an incoming government, because in unsettled times numbers can move about quite a bit even in the period between PREFU numbers being finalised and a new government taking office (this was an issue in 2008 for example).
PREFUs look a lot like the Budget and Half-Yearly economic and fiscal updates (BEFUs and HYEFUs) – here is the link to 2020’s and here is 2017’s (one prepared in more settled times) That is encouraged by law, since the things Treasury has to cover in each of these documents is the same. In respect of the economic forecasts, that is probably fine: after all, forecasts of the overall economy are just that: forecasts. A myriad of private choices, here and abroad, and the cyclical stabilisation activities of central banks, will influence outcomes, but mostly those outcomes are beyond the government’s (or Treasury’s) control. The economic outlook is a backdrop for fiscal numbers and, perhaps, fiscal policy.
I’m sure there will be some gotcha-type focus next week on some of the macro numbers. Will, or won’t, Q2 be shown as having experienced positive GDP growth. Given (a) the long lag on Treasury’s numbers, and b) that the actual official SNZ estimate is out the following week, much of that might be good fun but largely pointless. Same probably goes for their view on near-term inflation (if you could ask the Treasury forecasters next Tuesday their best guess of Q3 inflation it would almost certainly be different by then to what will be in the document they publish that day). That’s inevitable.
The real focus is, or should be, on the fiscal situation, which one or other party will be directly responsible for in a few weeks’ time (and one party is of course responsible now).
The operative bit is 26U(2) above. Hence, the government’s fiscal announcements last Monday, trimming future operating allowances etc, in ways quantifiable enough to be included by Treasury in the fiscal forecasts we will see next week. The Minister of Finance could, if s/he were sufficiently cynical, set the future operating allowances to zero and Treasury would have to include that “government policy” in its PREFU fiscal forecasts. The Secretary to the Treasury does not have any leeway to forecast how that policy might actually play out over several years. It is her legal responsibility simply to ensure that the forecasts accurately reflect the policy the Minister has communicated to her.
In the normal EFUs there is somewhat more restraint on Ministers of Finance. You could communicate to The Treasury low operating allowance numbers for this EFU but….you will still be minister in a year or two’s time and will be accountable for the eventual numbers. It isn’t perhaps much of a restraint – forward fiscal paths often have a “line on a graph” quality to them (with no specifics as to how these numbers will be delivered) – but it is something. In a pre-election EFU, no one is accountable for anything really (well, the Secretary is, but for faithfully representing government policy in the tables).
In the 2020 PREFU there was a bit of sensitivity analysis published – we were in the midst of pretty extreme Covid uncertainty at the time – but more normally there appears to be little or none (check again 2017’s and you will find none re the fiscal position itself, only (buried deep in supporting documents) on the cyclical adjustment estimates).
My focus here is not so much on the uncertainties of this year’s tax take. They are no doubt real, but economic cycles ebb and flow. Fiscal analysis really should focus mostly on cyclically-adjusted concepts and numbers.
But what we don’t get from Treasury in the PREFU documents – or anywhere else (other perhaps than in the periodic long-term fiscal report, which isn’t focused on the next 2-4 years) – is any sense of the state or implications of the cost pressures that will be difficult for any party in government to avoid. Political parties can and should debate what programmes should be provided and what not. Treasury can’t offer any particular insight on those debates. But it can, and should, be offering some sense of the spending implications of projected population growth, projected inflation, projected private sector real wage growth, and so on. If the past is any guide, next week’s PREFU will show us none of that. The revenue implications will be taken into account but, except where the law requires indexation (for example), not the expenditure implications. Unless conscious and deliberate other choices are made, those sources of pressure will increase government spending over time. But Ministers of Finance are simply free to give the Secretary to the Treasury a path for future operating allowances which need not bear any relationship to, or be based on any analysis of, largely inescapable cost pressures.
This might be seen primarily as a dig at the current government. It isn’t. In 2017 there was a huge political and analyst debate about alleged Labour “fiscal hole”. Many of the claims proved to be overblown but the “largely inescapable cost pressures” point was very real. At the time, and at the prompting of several former senior Treasury officials, I wrote a post on exactly that issue. By that time we had both the PREFU (reflecting incumbent government’s plans and operating allowances) and the then Opposition’s own fiscal plans (at present we have numbers from neither side). This text and chart was from that post
and after I’d worked through various detailed numbers around forecast influences that would boost costs
Neither side told us how they envisaged reducing government spending as a share of GDP. In a mechanical sense (PREFU and Labour’s parallel) they added up, but in substance they didn’t. Some related points were also in this post.
I expect that in next week’s PREFU there will be an operating surplus shown at some point in the relevant horizon (perhaps a year later than was suggested in the Budget). Quite probably – given that National seems to have no interest in an aggressive fiscal consolidation – that will suit both parties, but in both cases it will avoid the hard discussions around the choices that will bring about such surpluses. Countries don’t get from cyclically-adjusted deficits to surpluses by magic – or by simply drawing a line on a graph. Both sides are already guilty of “line on graphism” with what are no more than assumptions about savings that might be made without addressing programmes or choices that would make such savings sustainable.
It isn’t that medium-term fiscal projections are always useless. Sometimes legislation will already have been passed that will come into effect only gradually, and we want to be able to see the implications of those legislated commitments. But that really isn’t much of an issue at present. And absent such slowly unfolding adjustments it really means that almost no attention should be paid to any fiscal deficit numbers in PREFU beyond the current financial year: this year’s Budget has been passed and what is authorised isn’t vapourware. But what parties tell us vaguely they might do in future (and both are guilty) isn’t really worth much at all.
I ended that 2017 post with this suggestion
I stand by that call. I’m quite confident there has been a lot of very low quality spending in recent years, but I also suspect that the things governments need to spend money on are benefiting temporarily from the big surprise inflation. I’ve made the point here that teachers were more or less forced to accept a real wage cut, and a big cut relative to private sector wage developments. Recruitment and retention challenges are, shall we say, not unknown in the sector, and if we care at all about a high quality education sector then over time (and whatever else needs sorting out) we will need to pay accordingly. The senior doctors dispute seems to have similar characteristics. But how large and pervasive are these effects across the board? Treasury is best-placed to know, and to tell us. If the amounts are material then whatever savings can be made from genuine bloat might not reduce deficits at all but just end up having to be spent to be able to maintain or secure high quality core services. Treasury is obliged to publish a lot, but it could publish more and more useful standardised information along these lines.