More people need more capital

The government’s Budget Policy Statement and the Treasury’s updated forecasts were released yesterday.  I’m not going to comment on the Treasury forecasts in any detail –  it doesn’t help that Treasury produces the only PDFs I’ve encountered anywhere that somehow my computer won’t open – although I’d happily bet against their apparent view that the neutral nominal interest rate is still 4.5 per cent and that inflation is going to quickly get back to the middle of the target range.

But two policy initiatives warranted brief comment.  First, the resumption of contributions to the New Zealand Superannuation Fund (NZSF) is being deferred again.  Leveraged speculative investment funds don’t seem a natural activity for governments, and my only disappointment is that the NZSF isn’t being dissolved.  As Grant Robertson put it, the further delay will put pressure on future governments to review the age of eligibility for NZS etc.  Precisely.

The second initiative was the increase in the capital allowance by $1 billion for the coming financial year.   I’m rather sceptical of the quality of much of the government’s capital spending (Transmission Gully, Kiwirail) but this increase shouldn’t be surprising.  There are a lot more people in New Zealand than was forecast a few years ago, and people need places to live, schools, road, hospitals, shops, factories etc.  A significant chunk of the total capital stock is owned by the government (almost a sixth just by central government) and all else equal, if we have a lot more people more needs to be spent to provide the associated capital stock. That is true in the private sector –  houses, shops, factories, offices –  and in the public sector.   The latest official capital stock data show a net (of depreciation) central government capital stock of around $110 billion.  The population shock in the last few years will have been at least 1 per cent, so we shouldn’t be surprised by the need for additional public sector capital spending.  It shouldn’t be seen as some sort of discretionary fiscal stimulus or (according to the odd argument Graeme Wheeler ran last week) as a way of easing inflation pressures.  It is just something made necessary by the surprisingly strong population.  It is a concrete illustration of how demand effects from immigration surprises typically exceed supply effects in the short-run, again contrary to the new Reserve Bank view.

The net capital stock is almost three times annual GDP: each new worker needs the equivalent of three years production in additional capital (whether housing or factories or whatever)   New workers add to labour supply, of course but of themselves they don’t directly add to the capital stock.  And, as noted, the required addition to the capital stock is large relative to the additional new labour supply in the first year  –  typically several multiples of it.  And we have a new wave of migrants each year, each requiring further additions to the capital stock.    Real resources have to be devoted to putting in place that capital stock (we don’t simply import completed houses, roads, schools or office blocks).

None of this should be particularly controversial.  If a country’s population is growing faster then, all else equal, the amount (share of GDP) that has to be devoted to investment (capital stock formation) should tend to be larger than otherwise.  An acceleration of population growth should be expected to boost investment, and countries with faster population growth rates might be expected to have higher investment/GDP ratios than countries with slower population growth.  The differences should be quite stark: a country with 1 per cent per annum  population growth might be expected to devote around 3 percentage points of GDP more to investment than the average country with zero population growth.  That is just enough more so that the growth in the population would not adversely affect the capital stock per capita.    It is never going to be a precise relationship, since there is always a lot else going on.  And some countries have patterns of production that are less capital-intensive than others (eg the UK’s financial services industries are probably less capital intensive than Germany’s heavy manufacturing).

But, in fact, the relationship doesn’t look to have been there at all, either historically or more recently.

The OECD volume I had down the other day also had data for average annual population growth and gross fixed capital formation for the “old” OECD countries for the 1960 to 1967 period.  Here is the scatter plot, with a dot for each country.

gfcf and gdp old oecd 1960s

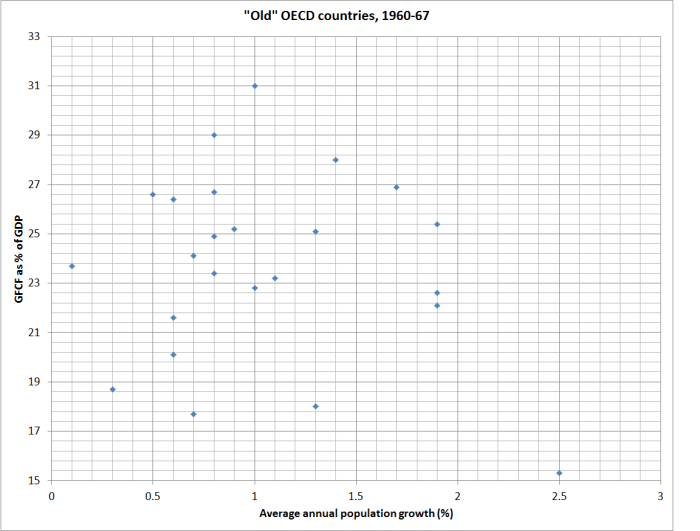
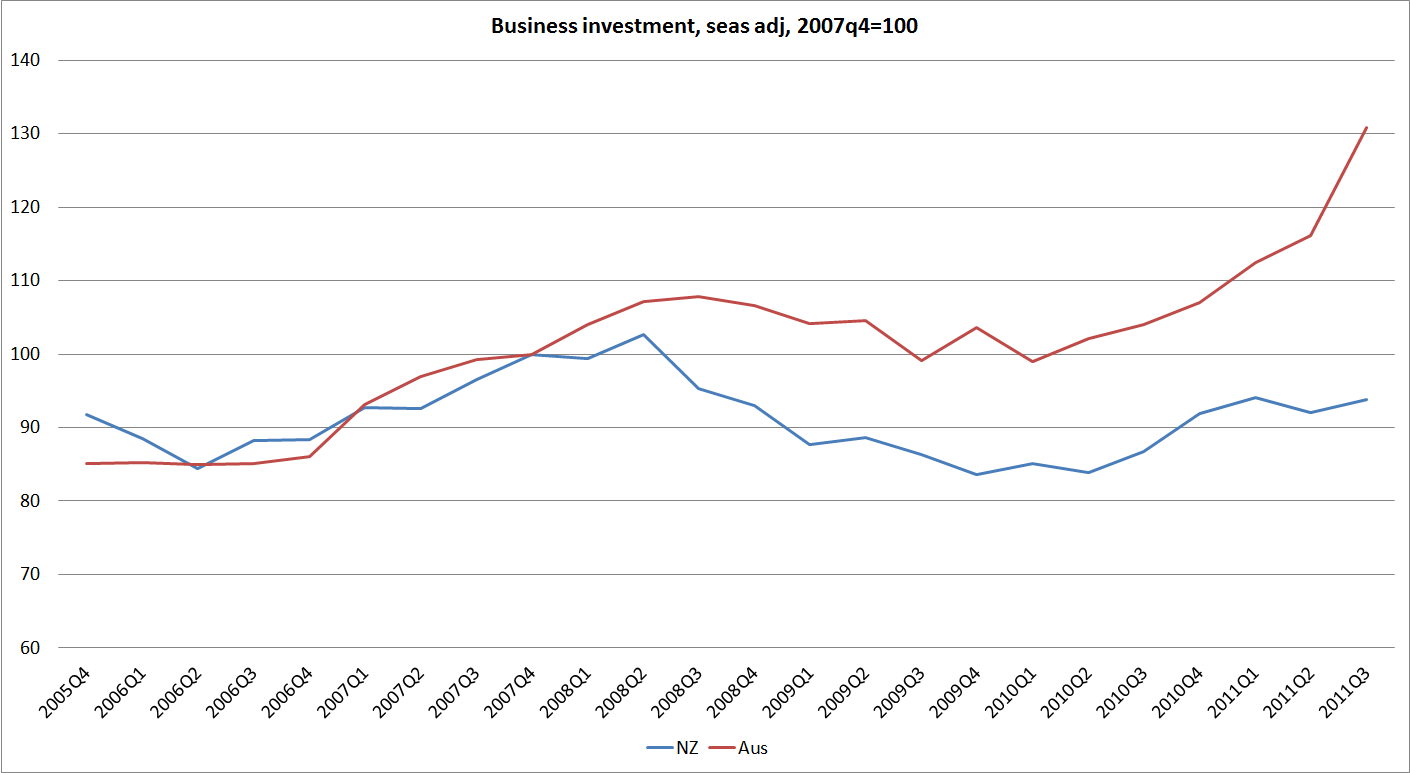
There is basically no relationship at all, and certainly nothing as strong as 3 percentage points more of GDP in investment for each 1 percentage point faster annual population growth.  It looks as though, across countries,, more rapid population growth tends to crowd out some investment growth. And since everyone needs to live somewhere, and governments have statutory command over resources and fewer market disciplines, the most likely investment to be crowded out is business investment.

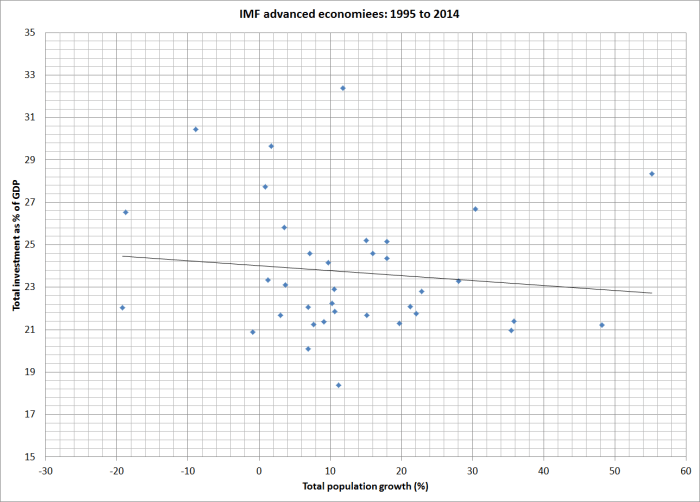
The 1960s is a long time ago.  So I also downloaded the same data from the IMF WEO database for each of the advanced countries for the last 20 years (1995 to 2014).  Here is the relationship between total population growth and the investment share of GDP.  The relationship is basically non-existent, and if anything (not statistically significantly) the relationship is the wrong way round.

gfcf to gdp 95 to 14

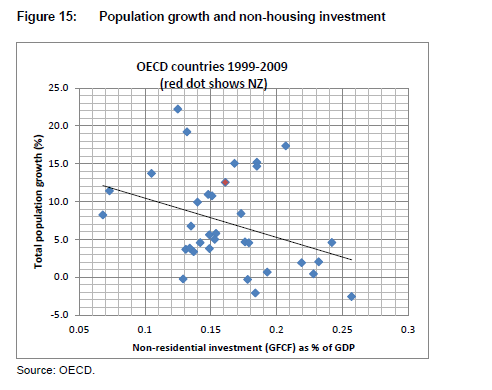
I didn’t have the energy to track down updated non-housing investment data, but I’ve shown previously that there has been a negative relationship between non-housing investment and the rate of population growth across advanced economies.

population and non-housing investment

According to the conventional story, this just should not be happening.  After all, our population growth is now largely the result of immigration policy, and high rates of skilled immigration are supposed to spark innovation, skills transfer, and new investment not just to maintain per capita capital stock but to capture the gains to the rest of us from the influx of capable people.  In fact, across countries and –  as far as we can tell –  across time faster population growth tends to squeeze out some business investment in the productive sectors.  Why?

There are two ways of articulating the story.  Strong demand, reflecting the desire to boost the capital stock to keep pace with the  population growth, tends to puts upward pressure on domestic interest rates (relative to those elsewhere).  That crowds out some of the desired investment (it just doesn’t happen), especially the return-sensitive business investment. It also tends to raise the exchange rate, providing a double-whammy adverse effect on investment in the tradables sector.     Growing per capita exports becomes harder.

The other way of looking at it, is to look at the relative prices of tradables and non-tradables.  Tradables prices are determined in world markets, and domestic demand doesn’t really affect them. But non-tradables prices are set in the domestic economy reflecting domestic demand (and underlying productivity growth).  High domestic demand associated with rapid population growth tends to raise the prices of non-tradables, and wages, while leaving tradables prices unchanged.  That makes it relatively more attractive to produce for the non-tradables sector, all the more so since all tradables production uses (now more expensive) non-tradable inputs.  External competitiveness is eroded and investment in non-tradables replaces, to some extent, investment in tradables.

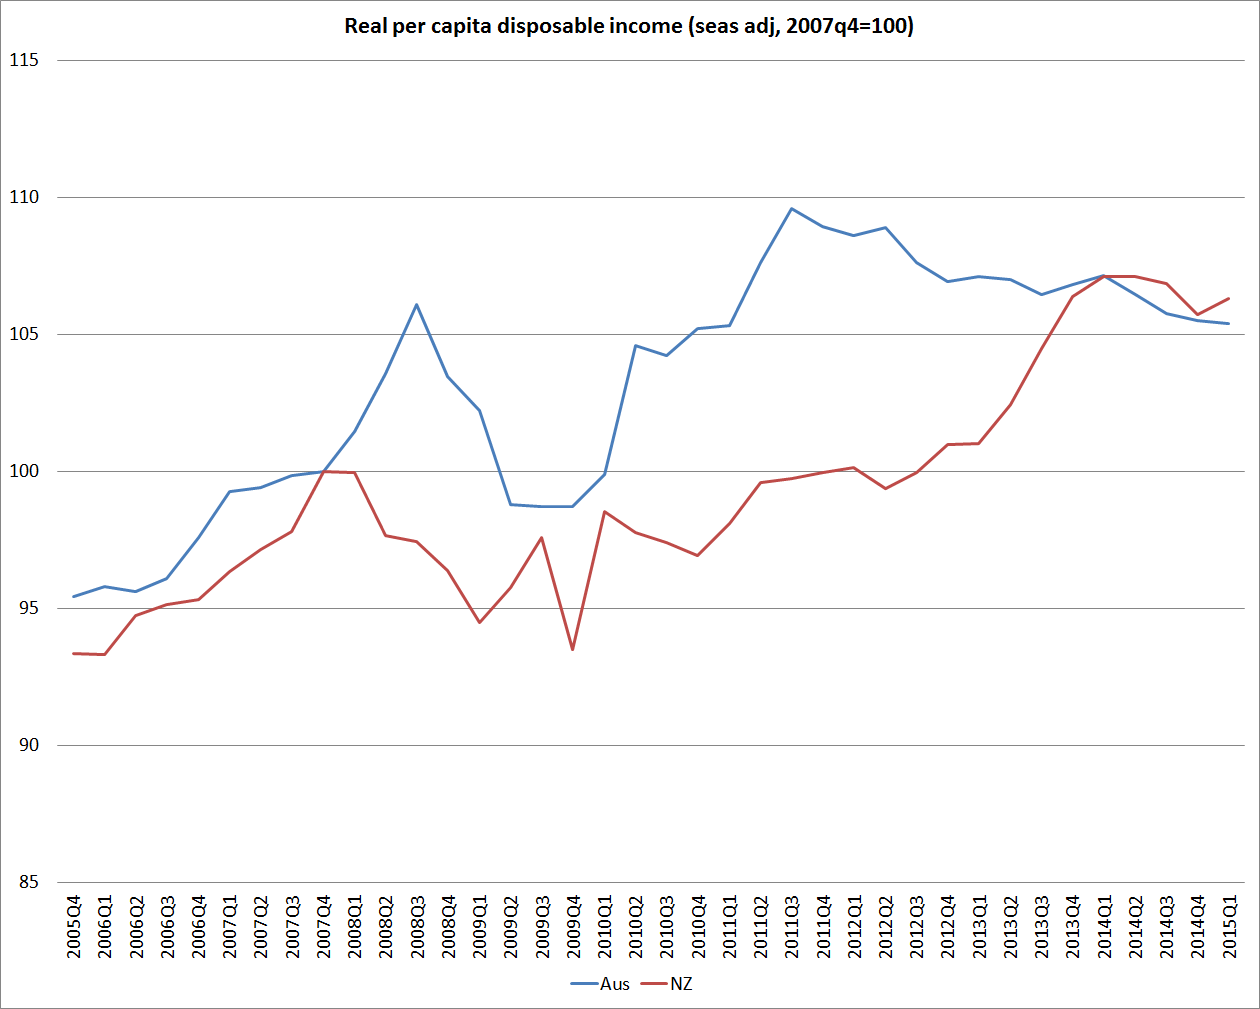
Which brings us back to yesterday’s announcement.  The additional government capital expenditure was probably necessary, but at the margin, it will tend to be to squeeze out some other capital investment elsewhere in the economy.  The cross-country perspectives suggest that fast population growth will come at the expense of maintaining the per capita capital stock, and make it harder for New Zealanders to keep up, or close the gap on, the incomes of people in other advanced countries.

None of this is new.  It was the perspective of able New Zealand economists looking back on the post-war New Zealand experience.  Here, for example, is Professor Gary Hawke, writing in the last full economic history of New Zealand in the early 1980s.

the economic consensus is strong one. In essence it simply observes that productivity was highest in agriculture whereas population growth was catered for by the relative expansion of other activities. Population growth thus fostered expansion of relatively low-productivity activities and therefore tended to reduce average per capita income. The key assumption is that sectoral productivities would not have been even more unfavourable in the absence of population growth, and discussion of later chapters shows that assumption to be reasonable….Perhaps if less importance had been attached to full employment, or if a different exchange rate had been implemented, the sectoral productivity trends could have been changed. Perhaps so, but population growth made it more rather than less difficult to effect those changes in policy, even if they had been desired, and, in terms in which it was debated, the economic case against population growth in the post-war economy was always a strong one.

It still is in 21st century New Zealand.


Converging on the US: trends in government spending

I was dipping into the latest update of the OECD Outlook database, and landed on the tables for government current spending and revenue as a share of GDP.

Spending first. I’ve shown here the shares for the US, New Zealand, and for a median of the OECD countries for which the OECD has data all the way back to 1970. Unfortunately, the New Zealand data aren’t available before 1986 – which was probably about the time government spending as a share of GDP peaked here.

gen govt disbursements.png

What I found interesting was how general government spending as a share of GDP in New Zealand has converged with that of the United States. Back in 1970, the United States was only just below the median for the other member countries for which there is data all the way back.  Now, both New Zealand and the United States are well below the median (whether for this sample, or for the whole OECD – for which group the median is now 42.6 per cent). The role of the US government in its economy may, in effect, be even larger than that in New Zealand, since there are so many “tax expenditures” in their system. Mandated private spending, such as that under Obamacare, would also add to the effective US total.

Of course, our government accounts are close to balanced, and those of the United States are not. When we look at current government receipts we are about half way between the US and the OECD median.

gen govt receipts.png

What about changes over the last few years? For all the talk of austerity, in only two OECD countries – Hungary and Poland – is current government spending as a share of GDP lower this year than it was in 2007, the last pre-recessionary year. In New Zealand, for example, general government spending this year is estimated to be almost a full percentage point of GDP higher than it was in 2007. At the other end of the chart, 11 of these 29 countries have government current spending five percentage points or more higher than it was in 2007. Check out Finland – an increase that almost defies belief over such a short period, at least outside wartime.

spending 07 to 15.png

And what of taxes? The median country is estimated to have seen almost no change in the government revenue share of GDP since 2007. New Zealand is among the countries with the largest reductions, but then we were running surpluses prior to the recession. Greece has, quite remarkably, managed a very large increase in the revenue share of a falling GDP.

receipts 07 to 15.png

Most of the countries with large increases in the government spending shares are still estimated to have material negative output gaps. In principle, an eventual recovery might help shrink the relative size of government. But, for most, it is not remotely clear where the sustained recovery is going to come from, and when.

On which note, for a bit of gloomy weekend reading, I suggest Ambrose Evans-Pritchard’s piece on Finland. The tragedy of the euro, compounding what would in any case have been a difficult economic adjustment.

Fiscal policy – a response to some comments

Following my post on Saturday about macroeconomic policy options, a reader posted the following substantive and interesting comment, which I thought warranted more of a response than a few lines buried in the comments.

The fiscal advice you propose is consistent with mainstream new-Keynesian models. This is the sort of outcome you get from the IMF modeling of the impact of a tighter fiscal stance in NZ in 2010 WP 10/128.

However, all these models assume that central bank acts rapidly and forcefully and is able to return inflation to target and output back to potential in short order (12-18 months or quicker because they assume that the monetary policy maker has a model of the economy that tell it in advance where output will be with certainty). This has not been the case. It is now 6 years since inflation has been at target and output at potential.

In these circumstance looser fiscal policy in the past (all else being equal) would have lead to high output, lower unemployment and inflation closer to target. All around welfare is higher. Perhaps we should leave aside the issue of what the fiscal policy maker should do if they share your beliefs about the RBNZ meeting its future target. Although just for the sake of playing devil’s advocate it would seem to me to be hard for the central bank to react to a fiscal loosening in this situation in the same way they might at close to full employment and their inflation objective.

Just looking at the near term it appears to me we face the risk of fiscal policy again being contractionary (perhaps only mildly) at a time when output is below potential – and fiscal policy will again be pro-cyclical.

Now there might be a good reason for all this if NZ was struggling with a large public debt burden and had no history of delivering fiscal consolidation. Yet this is not the case on either count. If you look at the IMF fiscal number and look at the change in primary balance (I used a 3 year average over the crisis period compared with calendar 2015) you will find that NZ adjustment (~ 7.5) looks like around the level of Portugal and Spain and Greece (Ireland is off the chart because of the size of the fiscal support provided to the banks through the accounts in these years). This is all in the context of macro models that suggest the appropriate pace of debt reduction from once in a generation shock is slow…..

And what about commodity prices?. I think the way to think about this is that you might tell you something about the right level of structural balance to aim for abstracting from the cycle. In my humble opinion it cannot tell you too much about the right fiscal stance from a cyclical point of view. To see this just imagine that this approach would have suggested a rapid tightening of the fiscal stance in 2010 as commodity prices returns to their peak despite the economy being in a deep slump. Another way to see this is to look at the cyclically adjusted balance scenario with the terms of trade at their 30 year average – this suggests that the structural balance is 2.5 percent worse than the forecast in every year.

Lastly, the decision needs to be made under the knowledge that the outcomes are asymmetric. If the central bank does its job as the macro models predict then we get a slightly different mix of output. But output reaches potential – no harm no foul. On the other hand if this is not the case then the outcome of looser policy will be much like I describe above for the past 5 years – higher output, employment, and welfare. All without reference to the risks of deflation or the zero lower bound.

There are a number of different points here.

I had noted that if a tighter fiscal policy had been adopted over the last few years that should have eased pressure on demand, the exchange rate and the OCR.  But as the commenter points out, it has been quite some years since core inflation was at target, and output also appears to have been consistently below potential (at least judging by the unemployment rate, if not by eg the Reserve Bank’s output gap estimate).

If so, mightn’t a looser fiscal policy –  as suggested by Brian Fallow –  have delivered some better economic outcomes?  I don’t think so.  The repeated mistakes the Reserve Bank has been making over the last few years have not had to do with fiscal policy.  The Bank’s approach is simply to take announced fiscal policy –  Treasury’s own numbers –  and build those assumptions into its own economic forecasts.  Internally, I was sometimes critical that we were too willing to base policy on government promises –  which is all forward operating allowance estimates are –  but in recent years doing so hasn’t provided a misleading steer.  The government got the Budget back to balance roughly when it said it would.

All that means that, as they said they were doing all along, the Reserve Bank set the OCR a bit lower than they otherwise would have because of the fiscal adjustment that was promised (and delivered).  Had the government planned a slower pace of fiscal consolidation, the Reserve Bank’s demand and inflation forecasts would have been a little stronger, and the case for tightening in 2013 and 2014 would have appeared even stronger to them than in fact it did.  The mistakes were about how the economy was working, not about the government’s own fiscal actions.

Only if fiscal policy had been surprisingly loose (unrecognised by the Reserve Bank) might there have been some windfall macro gains –  output a bit higher and inflation nearer target.  But no one wants to go back to a world of non-transparent fiscal policy –  perhaps especially not where one part of government (Treasury) keeps fiscal actions secret from another part of government (the Reserve Bank).

The commenter suggests that “we face the risk of fiscal policy again being contractionary (perhaps only mildly) at a time when output is below potential”.  The PDF with the supplementary Budget information on the Treasury website won’t open so I can’t check the fiscal impulse etc numbers, but two thoughts (a) surely any contractionary discretionary fiscal policy over the next few years must be pretty mild? and (b) whatever is flagged in the Treasury numbers is already included in the Reserve Bank’s forecasts and policy.  Since we are still nowhere near the zero lower bound, it seems unlikely that any additional fiscal contraction over the next couple of years will be holding back economic activity or inflation.    The Governor can fully offset the effects of well-signalled, relatively modest, fiscal actions.

I had made the point that the Budget had been flattered over the last few years by the high terms of trade.    If anything, I argued, a case could be made for having got back to balance a bit sooner than the government chose to.  After all, as Treasury’s numbers show, if one redid the fiscal numbers with the terms of trade set at their 30 year average, there would still have been a material (although not unduly alarming) deficit even in 2014/15.  My commenter seems to see this as an argument against faster tightening, but I don’t quite understand why.  A rising terms of trade does not of itself argue for faster discretionary fiscal consolidation, but rather for recognising that much of any improvement in the reported conventional cyclically-adjusted balance estimates is just arising from the boost to the terms of trade, and the underlying extent of adjustment still required remains as large as ever.  The improvement in New Zealand’s fiscal position has been flattered by the impact of the terms of trade.

Judging how much fiscal consolidation there has actually been is more of an art than a science.  My commenter presented one set of numbers, which suggests that there has been a very substantial fiscal consolidation in New Zealand in recent years, even by comparison with some of the benchmark austerity countries like Spain and Portugal.

I’ve got an alternative take, using the OECD’s underlying balance measure –  which is both cyclically-adjusted, and removes identifiable one-off items (eg bank recapitalisation s in a single year, or earthquakes).  Since the most recent OECD numbers are a few months old, the numbers aren’t quite as up to date as the IMF ones, but it is unlikely that the picture would change very much with a few months extra data.

OECD gen govt underlying balance

Here is the increase in underlying surplus (reduction in the underlying deficits) as a per cent of GDP,  from the low point reached over 2008 to 2010 to the latest 2015 estimate.  Over that period, the median OECD country reduced its underlying fiscal deficit by 3 percentage points of GDP, while New Zealand’s adjustment was 4.1 percentage points.  But New Zealand’s numbers were flattered by the fact that we had among the strongest terms of trade of any OECD country over that period.  If that were corrected for, the extent of our fiscal adjustment would be even more unremarkable, and much less than those in Ireland, Iceland, Portugal, Spain and the US.  And, of course, over that period our debt has increased.

It is quite reasonable to argue that New Zealand was under no particular market pressure to have adjusted that fast (neither was the US).  But on the other hand, unlike all these countries other than Iceland, we still had plenty of room for conventional monetary policy to offset the short-term demand effects of contractionary fiscal policy.  And although New Zealand did not use fiscal policy actively to counteract the 2008/09 recession (unlike the US, UK, or Australia, for example) it is worth reminding ourselves how large the deterioration in New Zealand’s underlying fiscal position was: on this underlying balance measure, only Spain and Iceland saw a larger fall in the underlying surplus from years just prior to the recession to the recessionary low.  Fortunately, we had started from large surpluses.

In making choices about fiscal policy now, the effects are not asymmetric.  The Reserve Bank will offset any  discretionary fiscal easing now –  the revised assumptions will feed straight into the forecasting models.  We won’t end up with higher output, higher employment, or higher inflation, we’ll just end up with slightly higher (than otherwise) interest rates, exchange rates, and public debt (and temporarily higher spending or lower taxes).  It is only when conventional monetary policy has reached its limits (say, an OCR at -0.5 per cent) that discretionary fiscal policy is likely to play a useful stabilisation role.  And we provide the best chance of that being a politically viable and economically credible option, for the several years of stimulus that might then be required, if the government keeps a tight rein on fiscal policy now.  I don’t favour running large structural surpluses in boom times –  it is a recipe for fiscal splurges of the sort the 2005-08 government took.  But adverse shocks are inevitable from time to time, and one of the best ways to cope with them is to keep public debt very low, and ensure that the budget runs modest structural surpluses in the more normal times.  Even then , a severe adverse economic shock may well undermine tax revenue sufficiently that there will often be surprisingly little discretionary fiscal leeway.

More please (or “What New Zealanders think of public spending”)

The New Zealand Election Survey (NZES) has been running since 1990

NZES’s main source of data are questionnaires which are posted to randomly selected registered electors across the country immediately following each election.

Some of the questions stay the same but others reflect some mix of the issues of the day and researchers’ interests. There usually seem to be quite a range of economic and social policy questions.   They achieve quite a large sample (in the 2014 survey they had 2835 responses) and the reported responses are weighted to, as far as possible, reflect the demographic characteristics of the population (age, sex, race, qualifications and party support)..

I haven’t seen any media coverage of the results of the 2014 survey, but reading through the responses to the policy questions over the weekend I thought some were worth highlighting.

Perhaps the responses that most caught my eye were those around government spending.  These were the first set:

Should there be more or less public spending on:
More Same Less Net (more- less)
Health 66.8 26.7 1.6 65.2
Education 64.2 29 1.6 62.6
Housing 48.6 36.3 8.3 40.3
Police and law enforcement 42.8 45.3 5.2 37.6
Public Transport 41.8 43.3 7.5 34.3
Environment 40.2 45.4 6.5 33.7
Superannuation 31.8 55.4 5 26.8
Business and Industry 29.7 47.8 9.7 20
Defence 18.2 54.3 18.7 -0.5
Welfare benefits 15.4 41.6 24.6 -9.2
Unemployment benefits 12.4 38.6 40.5 -28.1

In most categories, more people favoured keeping expenditure at current levels than favoured either raising it or lowering it, but, equally, for most categories the net balance of respondents were much more in favour of raising public spending than of lowering it.  The only area in which respondents favoured cuts in public spending were “welfare benefits” and especially “unemployment benefits”  (while by similar margins they favour spending more on superannuation).

I was a little surprised.  There are areas where I would favour increased government spending (eg statistics and legal aid), but I’m pretty sure that if faced with this survey I’d not have answered “more” to any of these questions.

Despite the answer on superannuation, respondents narrowly favoured raising the NZS eligibility age to 67 (as they did when the same question was asked of an overlapping sample in 2011)

Agree Disagree
Raise NZS age to 67 between 2020 and 2033 42.2 38.3

That left me wondering why people wanted to increase public spending on superannuation.  Perhaps they want fewer people getting superannuation, but for each superannuitant to get more?  But as we have one of the lowest rates of poverty among the elderly of any OECD country that would be a surprising stance.  Perhaps it is just that people are more hard-headed faced with a more specific question?

The survey also had a few questions about whether some types of government spending is good or bad (ie not asking whether the current level should be raised or lowered).  I found those responses a bit eye-opening as well.

Should government give financial help to
Yes No
Companies for research and development 66.7 11.8
Companies to help them develop products for export markets 61.3 14.3
Sportspeople to allow them to compete internationally 56.6 19
Film makers to encourage filmmaking in NZ 50.7 18.6
Banks to help them in time of economic crisis 26.2 40.9

I’m not sure how I’d have answered the banks question –   there wasn’t an “it depends” option.  I’d like to think I’ve have answered “no”, but revealed preferences matter and in Treasury in 2008 I argued strongly for the use of guarantees and, on balance, still think that was the right advice.

In fairness to respondents, there are no questions in the survey about how they would propose that the country should pay for this spending.  The presence of a budget constraint – even a hypothetical one in a survey –  might have changed how some respondents answered.  But perhaps not by that much.

There was one tax question in the survey, in which respondents narrowly opposed a capital gains tax.  In principle the question was ambiguous  –  asked if we needed a “capital gains tax excluding the family home”, some respondents might have objected to the exclusion of the family home, but would have favoured a more textbook comprehensive CGT.  But I don’t suppose there were many such respondents.

Overall, I’m not quite sure what to make of the results.  One person I showed them to suggested that “ACT should read them and give up”.  They were suggestive of a New Zealand with attitudes perhaps not much different than similar surveys might have found 50 years ago.  There is quite a strong suspicion of (non-superannuation) welfare in these and other questions in the survey, but also a quite striking degree of belief in a role for a fairly large and active government.

Then again, for better or worse, although government spending in New Zealand is very large –  central and local government current spending totalled 37.1 per cent of GDP last year –  there were only three OECD countries where current government spending now accounts for a smaller share of GDP than in New Zealand.  And in all but a handful of countries the government spending share of GDP has risen somewhat over the last decade or so (as it has in New Zealand).  Korea is at the low end of this chart, with current government spending of 28.6 per cent of GDP last year, but as recently as 2002 that share was only 22.0 per cent.  Between rising government spending and the continuing encroachments of the regulatory state, whatever ails the world economy at present doesn’t look to have been an outbreak of small government.

gen govt spending

Fiscal and monetary policy interactions: some New Zealand history

The role of fiscal policy has been much-debated in recent years. I think the consensus view now is that discretionary adjustments to fiscal policy make little difference to GDP in normal times, because monetary policy typically acts to offset any demand effects. By contrast, if interest rates can’t go any lower (or central banks for whatever reason are reluctant to take them lower) then discretionary fiscal policy adjustments can have quite material impacts on near-term GDP behaviour.

These debates focus on demand effects. If the government spends less, without changing tax policy, spending across the economy as a whole is likely to be dampened to some extent, all else equal. But there are also stories about confidence effects. If the overall economic and fiscal situation is sufficiently fragile, then in principle tough and credible new fiscal initiatives could lift confidence sufficiently that the confidence effects overwhelm the demand effects.  This was the vaunted “expansionary fiscal contraction”. I’m not sure I could point to any examples in advanced countries, but others read the evidence and case studies a little differently. I’m not wanting to buy into debates about Greece here – but “credible” was perhaps the operative word in the previous sentence.

Before 2008, there was a variety of historical episodes that people often turned to when looking at the effects of fiscal contractions.  The UK experience in the early 1980s and the Canadian experience in the mid-1990s got a lot of attention.  I think the best read on the Canadian episode (with more extensive treatment here) was that substantial fiscal contraction did not have adverse effects on the Canadian economy because interest rates fell sharply,the Canadian exchange rate fell in response, and the United States – Canada’s largest trading partner – was growing strongly.

And then there was New Zealand’s experience around 1990/91. After several years of significant fiscal consolidation (which had been sufficient to generate material primary surpluses), new fiscal imbalances had become apparent by late 1990. In a major package of measures in December 1990, and in the 1991 Budget, substantial cuts to government spending were made. In combination with the earlier efforts (which were probably more important), these cuts helped lay the foundation for the subsequent decade or more of surpluses.

Former director of the Business Roundtable, the late Roger Kerr, was prone to argue that it was an example of an expansionary fiscal contraction. I’ve repeatedly argued that it wasn’t. Certainly, the recession troughed at much the same time as the 1991 Budget and the subsequent recovery was pretty strong. And, as Kerr noted, the academic economists who publicly argued that the fiscal contraction could only depress the economy further and would prove largely self-defeating ended up looking a little silly.     But the recovery had much more to do with the very substantial fall in real interest rates – as inflation was finally beaten – a substantial fall in the exchange rate, and with the recoveries in other advanced economies than with any confidence effects resulting from the tough fiscal policy measures.   By mid-1991, the new National government’s political position was so fragile that no one could have any great confidence that the fiscal stringency that was announced would be sustained (and, indeed, several of the higher profile measures were subsequently reversed). The rest of the macroeconomic policy framework, including the Reserve Bank Act, were in jeopardy. Elected in October 1990 with a record majority, the National party was 15-20 points behind in the polls only a year later, and only scraped narrowly back into government in 1993.

A few years ago, there was renewed debate here around the appropriate pace of fiscal consolidation. At the time, the government had large deficits, and the exchange rate had risen uncomfortably strongly from the 2009 lows. Some argued for a faster pace of fiscal consolidation, arguing that to do so would ease pressure on interest rates and the exchange rate. It had been the thrust of Treasury advice, and some outsiders were also making the case. Among them was then private citizen Graeme Wheeler, who had had a meeting with John Key and Bill English and had reportedly cited the experience on 1991, noting that monetary policy could offset any demand effects of faster fiscal consolidation.   Reports of this conversation had been passed back to the Reserve Bank.

Not many people at the Reserve Bank knew much about that earlier period. Newly-returned to the Reserve Bank from a secondment to Treasury, I wrote an internal paper discussing the interplay between fiscal and monetary policy over 1990 and 1991, including addressing some of the “expansionary fiscal contraction” arguments. It drew extensively on previously published material, on the now-archived files I had maintained during the late 1980s and early 1990s (as manager responsible for the Bank’s Monetary Policy (analysis and advice) section, and from my private diaries.

The Reserve Bank finally released this paper yesterday, with a limited number of deletions (I have appealed these deletions to the Ombudsman, given that they relate to events of 25 years ago, and in some cases involve deleting quotes from my own private diaries). The Bank is obviously uncomfortable about the paper. Despite the fact that the paper draws extensively from contemporary records – most of which are in the Bank’s archives – and was run past (in draft) several of senior people from the Reserve Bank in the early 1990s, the Bank has included a disclaimer on each page suggesting that the paper is primarily based on my memories, which it can’t vouch for. But, to be clear, it draws primarily on contemporary records, trying to document and explain historical events, and then to interpret them to an audience used to different ways of conducting monetary policy. Different people may read the same evidence in different ways, and access to a fuller range of records could alter some perspectives. As an example, while my files had copies of many Treasury papers, and records of many meetings with Treasury officials, I did not have access to a full set of Treasury papers comparable to the collection of Bank papers I used. As background, Graeme Wheeler was the Treasury’s Director of Macroeconomics in 1991.

A copy of the paper is here (two separate links, as that is how I got it from them).

Memo to MPC – Fiscal policy, monetary policy and monetary conditions part 1

Memo to MPC – Fiscal policy, monetary policy and monetary conditions part 2

This was an extremely tense period. The Reserve Bank Act had come into effect on 1 February 1990, and although both main parties officially supported it, it was contentious in both caucuses. In the National Party caucus, Sir Robert Muldoon and Winston Peters had been the leading sceptics. The Labour Party was almost equally split, and Jim Anderton had left the party over the direction of economic policy. Going into the 1990 election, no one knew which wing would dominate the (probable) new National government, nor which tack the Labour Party would take once it was in Opposition. Economic times were tough, and patience with the Reserve Bank was wearing rather thin as the disinflationary years dragged on. It wasn’t helped by the system for implementing monetary policy that we were using (documented here) which at one point led to our efforts being described by Ruth Richardson in Parliament as comparable to those of Basil Fawlty in the comedy classic. (Treasury and the Bank were actively at odds over the implementation arrangements – they variously hankered after money base targets or, on occasion, exchange rate rules[1]).

Last night I reread some of my diaries from the period, and dipped into Ruth Richardson’s book, and Paul Goldsmith’s biography of Don Brash, and was reminded just how fraught the period was. We spent most of 1991 not knowing whether, or how long, the monetary policy framework would last, and whether the senior management would survive. Ruth Richardson records that even at the end of 1991 when the worst of the pressures were beginning to ease, the Prime Minister Jim Bolger, in a meeting of senior ministers, canvassed the possibility of changing the Reserve Bank Act to provide an impetus to growth.

The Bank had for some time publicly argued that there was no problem with the exchange rate. As a result the Bank’s position with the new government was not helped by a change of stance quite late in the piece: the new view was that a lower real exchange rate was likely to be required to rebalance the New Zealand economy. This was an important theme in the Reserve Bank’s 1990 post-election briefing, and took the incoming Minister of Finance quite by surprise. The Reserve Bank openly making the case for a lower exchange rate seemed to provide ammunition for some of her caucus and Cabinet colleagues who were less convinced of the overriding importance of macroeconomic stabilisation.

She would have been more aghast had she realised that until the very eve of the election the Reserve Bank had been planning to recommend stepping back from the 0-2 per cent inflation target itself. This had been the outcome of some mix of unease over how (excessively) mechanical the first Policy Targets Agreement had been, and a wish to allow room for the desired depreciation in the exchange rate. The suggestion had been to keep a medium to longer-term focus on a 0-2 target, or perhaps redefine it to 1-2 per cent, but to add a 0-4 per cent “accountability range”, within which inflation could fluctuate without triggering severe accountability consequences. We stepped back from that recommendation at the last minute, in large part because of the view that to have recommended that sort of change would have left Ruth Richardson out to dry, as the only defender of a 0-2 per cent target, exposing her to (in the words of my diary two days before the election) “Peters’ and Muldoon’s ridicule and Bolger’s incomprehension”.

In terms of the fiscal policy dimensions, one of the Reserve Bank’s deletions in from this extract from my diary a couple of days after the election:

We had a marathon session in Don’s office (from 8-11) going thru para by para agreeing on a text with DTB finally showing his impatience with the last minute chaos. Changed fiscal tack in favour of a tough stance now, to help cement-in any exchange rate depn and, as important as anything it seemed, to help the Richardson faction in Cabinet.

What this captures is the somewhat uncomfortable extent to which the Reserve Bank (and Treasury, as we shall see) in this period were focused on supporting, or at least not undermining, those political players supporting the sorts of frameworks and reforms that the Bank and Treasury favoured. In the Bank, senior management came to a view in 1991 that saving the framework (the Act) was, for now, more important than price stability itself (as least in the short-term). Sceptics of this stategy – I was one – caricatured it as “the Reserve Bank Act is more important than price stability”.

Even with the benefit of long hindsight, I’m not sure what to make of the approach taken at the time. On the one hand, it is somewhat distasteful – neither the Governor nor the rest of us were elected – but on the other hand, perhaps it is just what inevitably happens in any fraught and controversial period. As it happens, we probably gave quite unnecessary ammunition to the opponents of reform through this period. In small part this was because we communicated badly and ran an implementation system that – with hindsight – was pretty bizarre. But more importantly, we held monetary policy too tight for too long – not to make any points, or reinforce any positions, but simply because we misread how strong the disinflationary forces were by then. In a serious recession, that was black mark against the Bank (and I was one of the more hawkish people on the Reserve Bank side).

During 1991, the Treasury became very focused on supporting the political position of Ruth Richardson as Minister of Finance. Some of this is captured in the paper. But much of I didn’t include, since the focus of the paper had been on the fiscal/monetary interplay. On page 15 of the paper, the Bank seems to have deleted some of this extract from my 4 September diary”

David [Archer] and I had lunch with Graeme Wheeler and Howard [Fancy][2] and were treated to a litany of gloom, of how we needed to be supporting the macro policy mix and helping get the recovery going and being very concerned about the political risks. As GW said “I wouldn’t want history to look back on me as a policymaker and say that in my confidence about the framework I hadn’t taken adequate precautions” – referring to the Bank. He was going on about how we had a “near-perfect” mon pol framework for the medium-term but that at the moment we needed to be more flexible. Both were concerned to play down 0-2, with vacuous waffle about “best endeavours” but taking the view that, in effect, 2-4% inflation wouldn’t worry them. ….. Apparently Bolger is getting worried about 1981/1932 re-runs: mass demonstrations, violence in the streets etc.

Only a few months previously the Treasury had been openly sceptical that macro policy was sufficiently tight.  It wasn’t always clear how well Treasury was reading the politics either – I had a very good relationship with Ruth Richardson’s own economic adviser, Martin Hames, and on the evening of the deleted extract above I recorded a long conversation with Martin in which “he still claims there are no real threats: says things were a lot worse at times in Oppn”.

This has been become rather a long post. It is partly about providing some context for those who think about reading the whole paper. Here are a few of my bottom lines:

  • Had we been running a now-conventional system of monetary policy implementation, many of the less important of these tensions and ructions would not have arisen.  When demand and inflation ease –  whatever the source –  the OCR is generally  cut.
  • While, with the benefit of hindsight, New Zealand was probably always going to settle at a low inflation rate (all other advanced economies did) that wasn’t remotely clear at the time.  In particular, the initial passage, and the survival, of the Reserve Bank Act was a much closer-run thing than is generally recognised. Infant mortality was a real threat
  • Neither the Reserve Bank nor the Treasury covered themselves with glory through this period in their macroeconomic analysis and policy advice.

[1] Murray Sherwin presciently argued that we should adopt an OCR. I’m still embarrassed by the note I wrote in response to that suggestion.

[2] David was the Bank’s deputy chief economist, and Howard was Treasury’s macro deputy secretary.

Fiscal policy and how NZ and Australia did in 2008/09

My post the other day about fiscal policy (and why it shouldn’t be eased in New Zealand now), together with a throwaway line about Kevin Rudd’s fiscal policy in the 2008/09 crisis, prompted me to spend a bit of time digging around in the data for the 2008/09 period for both New Zealand and Australia.  This relates to the question “why did New Zealand have a recession and Australia didn’t”

Of course, even that statement is not as simple or uncontentious as it looks.  The shorthand people are using here is the “two consecutive quarterly falls in real (seasonally adjusted) GDP”.  On that measure, New Zealand actually had two recessions (from a peak in 2007q4 to a trough in 2009q2, and not having regained the previous peak, real GDP again fell for a couple of quarters from mid 2010).  By contrast, real GDP in Australia fell in only a single quarter, in 2008q4.

But Australia did not just sail through unscathed:

  • In per capita terms, it took two years for real GDP in Australia to recover to 2008q3 levels.
  • When Australia’s terms of trade fell, real net national disposable income per capita (a measure that captures the direct effects of the terms of trade) fell by around 9 per cent.   The similar measure in New Zealand only fell by around 5.5 per cent.
  • Australia’s unemployment rate rose by around 1.5 percentage points in 2008/09, the scale of increase that might be expected in a mild recession (similar, for example, to the increase in unemployment rate in the New Zealand recession of 1997/98)

So, I don’t want to get hung up on the question of whether Australia had a recession or not.  But it is pretty generally accepted that Australia was less hard-hit than New Zealand (and many other countries).

Some people reckon that the difference is fiscal policy.  No doubt senior figures in the then Australian Labor government (if they could agree on anything) would like people to think so.  The government, egged on by the Australian Treasury, announced two significant fiscal packages in the middle of the global crisis, one in October 2008 and another (much larger) one in February 2009.  By contrast, neither New Zealand government (either side of the November 2008 election) did any material amount of discretionary fiscal stimulus in response to the crisis.

But what I find striking is how similar New Zealand and Australian fiscal policy was, in bottom line terms, during the second half of the 2000s.  If we did not have a crisis-response package in late 2008, we had had a very expansionary Budget earlier that year.  And both countries had been running down structural surpluses for several years.

Here are some charts from the IMF WEO database:

For revenue

revenue

For expenditure

expenditure

For the fiscal balance

net lending

And for the (estimated) structural balance

structural balance

And, perhaps most starkly, here are direct real government purchases (consumption and investment) for the two countries (indexed to 10o in 2007q4).  It is not until the start of 2010 that one can see any material difference between the two lines.  New Zealand’s recession (like those of most other OECD countries, ended in mid 2009).

C+I

Of course, these are highly aggregated numbers, and it may be that there was something in the specific make-ups of the fiscal programmes that meant fiscal policy was much more effective in Australia.  But it isn’t obvious, and it probably shouldn’t be that surprising since in both countries the central banks will have been taking fiscal developments into account in deciding how much to cut their respective policy interest rates.  As it happened (and unsurprisingly) the Reserve Bank of New Zealand cut the OCR by much more (575 basis points) than the RBA (which cut by 400 basis points from the end of 2007 to the trough in April 2009 – having raised the cash rate in early 2008).

So if fiscal policy differences don’t appear to explain why Australia did less badly through this period, what does?  In the New Zealand story, the drought at the start of 2008 didn’t help.

More generally, the terms of trade are very important to both countries, and in both countries they are quite volatile.  In New Zealand, changes in the terms of trade flow more directly into changes in household incomes, since most of the tradables sector is domestically owned (FDI in New Zealand is heavily concentrated in the non-tradables sector).  By contrast, most of the Australian minerals sector (where the terms of trade volatility arises) is foreign-owned, so that Australian residents’ incomes are not so directly affected.  But the Australian minerals sector is very capital intensive, and huge investment programmes drive off actual and expected minerals prices.

What happened to the terms of trade in the two countries?  New Zealand’s increased by around 10 per cent in 2007, and then started gradually falling away again.  But Australia’s terms of trade rose by around 20 per cent in 2008.  The terms of trade then fell away almost equally sharply  before the effects of the Chinese rebound drove hard commodity prices on to their 2011 peak.    But what that timing difference meant was a quite different environment for the Australian economy in 2008 than was the case in New Zealand (or most other OECD countries).

tot 08 and 09

One important place where the difference shows up is in business investment.  Australia’s business investment peaked the same quarter as the terms of trade and – no doubt reflecting long lags on minerals investment projects, and perhaps the sharp fall in the exchange rate – never fell as far as New Zealand business investment did.  As has been pointed out previously, New Zealand’s business investment boom in the 2000s appears to have been concentrated in the non-tradables sector.

business investment

A similar timing difference is apparent in respect of residential investment. New Zealand’s peaked in 2007q3 and Australia’s peaked in 2008q3.  It looks as though timing differences (both domestically and particularly in the terms of trade) were enough to provide just enough momentum for Australia to avoid the two quarters of falling real GDP.

In closing, here is the chart of RGNDI (for NZ) and RNNDI (for Australia), both indexed to 2007q4 (the peak of the last cycle for NZ, the US, and a number of other OECD countries).  It helps highlights just how important that 2008 terms of trade surge was in limiting the slowdown in economic activity in Australia through 2008.

rgndi rnndi

It isn’t time to shift the fiscal stance

The media have been reporting a suggestion from the ANZ Economics team that New Zealand’s fiscal policy might be made more stimulatory in response to the actual and expected slowdown in growth that is underway.  When I heard this story reported this morning, I wondered if ANZ had been misreported, but on checking their weekly Market Focus document, it appeared not.

In a piece headed “Time to shift the fiscal stance” here is what they argue

Monetary policy is generally expected to do theheavy lifting when growth slows. However, fiscal policy and local authorities have stabilising roles to play too. Both the government and local authorities have large balance sheets, which allow them to absorb swings in the business cycle more easily than SME’s. It goes against human nature for fiscal policy to be run in a counter-cyclical sense (i.e. crank things up in bad times and wind things back in the good times), but it is sound economics. Of course there are relatively long lags involved, which can make the pursuit of such an approach difficult. But that shouldn’t stifle the concept altogether. 

Fiscal policy could move to a more neutral stance – or even an expansionary one – next year if thinking-caps were put on now. The sacrificial lamb would be nascent operating surpluses. But with net debt sitting around 27% of GDP, delaying or deferring the achievement of surpluses for a year or two is trivial – and as discussed below, the accounts are still running ahead of expectation anyway. Local authorities in rural (dairy) aligned regions could also be pulling forward investment projects. And there is room for rates relief, or at least limiting the magnitude of increase. There shouldn’t be a fear from officials to use the balance sheets at their disposal. The Government sector has a role to play just as monetary policy does, particularly when growth is below trend.

Frankly, I’m still puzzled by the case they are making.  Here’s why:

  • If the OCR were at zero, or very close to it, I would probably endorse their call.  Discretionary fiscal policy can play a useful stabilisation role when monetary policy is reaching its limits.  But the OCR is at 3.25 per cent.  ANZ expect it to be cut to 2.5 per cent, and I think there is a pretty good chance of even deeper cuts.  But even if the OCR gets to 2 per cent (probably not until early next year) there is still a material buffer above zero.  When buffers like that exist, looser fiscal policy tends to be approximately fully offset by tighter monetary policy (in the jargon, the multiplier is basically zero).  That is what happened in the years leading up to 2008, and would no doubt happen here again, given that, on the evidence of its comments and actions, the Reserve Bank would probably prefer to avoid plumbing new lows on the OCR if at all possible.
  • We have the highest real interest rates in the advanced world.  Of course, they are low by historical standards, but higher than other advanced country governments are paying.  Why would I want the government to take on even more debt, at my (future) expense at such relatively high interest rates?
  • Sometimes overseas enthusiasts for more fiscal stimulus argue for more infrastructure spending, citing the allegedly poor state of infrastructure in, say, the United States or Germany.  But the New Zealand government has been spending very heavily on infrastructure for the last decade. Indeed, at the last election I went to a session with David Parker, then Opposition spokesman on Finance, who declared his view that quite enough had now been spent on public infrastructure.  He may have had a variety of reasons for saying so, but when the finance spokesman for a left-wing party makes the case for not increasing public infrastructure spending we should probably listen.
  • How comfortable are we about the likely quality of any new government spending?  Do I need to go much beyond mentioning the economics of Transmission Gully, Kiwirail, and cycle-ways programmes?  Many of the projects governments actually spend money on simply fail to cover their costs.
  • I was left open-mouthed in astonishment at the suggestion that local government could play a part in securing a fiscal stimulus.  I’m sure many councillors would be delighted, but what sort of return do voters and the country get?  The talk of is “pulling forward investment projects”, but the investment project wishlist in often pretty questionable.   Another Dunedin Stadium for some other city?  Or a Wellington Airport runway extension?   Or even more spent on cycle-ways (I live in Island Bay where the Wellington City Council is just pouring money down the drain in a particular pointless (and controversial) “cycleway to nowhere”).
  • It is always easier to increase spending than to cut it later.  We are still living with the aftermath of the 2005 to 2008 fiscal easing.  Why put ourselves through that again if we don’t (yet?) need to?   (And did I mention Australia under Kevin Rudd?)

I can envisage a scenario in which fiscal stimulus could be useful (although if our OCR gets to zero the exchange rate will be much much lower than it is now, with a TWI still above 70) but let’s keep the powder dry for that time.  General government debt in New Zealand is not extraordinarily low (as a per cent of GDP), and even if it turns out that a modest operating surplus was recorded in 2014/15 –  made possible by record terms of trade – the prospects for the coming year are probably worse than they were when the Budget forecasts were done.  There are distinct political limits to how much fiscal stimulus any government can do, even in a crisis, so why fritter away the capacity now?  By all means, have Treasury working up some options, but don’t lose sight of monetary policy as the primary cyclical stabilisation tool.  It works.  And it probably needs to be used more aggressively now,  after being  headed in the wrong direction last year.

ANZ don’t mention it as a reason, but perhaps they are uneasy that further cuts in the OCR will fuel the house market. Perhaps, but if the outlook really is as  gloomy as they suggest it might become, then  income growth will be taking a hit as well (wage expectations are already falling), and New Zealand will be increasingly less attractive to migrants.  Real interest rates are hundreds of basis points lower than they were in 2008, and in most of the country real house prices are still lower than they were then.  The OCR is generally cut for a reason – that demand is weakening at any given interest rate.

Macro policy flexibility since 2007

I’ve been looking at how advanced economies have performed since 2007.  New Zealand has not done that well, contrary to some of the stories one sees around (eg the somewhat incredible “rockstar economy” phraseology that held sway for a while).

It surprised me that New Zealand had not done a little better since 2007.  As I noted last week, we have had some of the strongest terms of trade of any OECD country.  But we also had other advantages.  For example, we did not have a substantial domestic financial crisis.   No major financial institution failed, and although many finance companies failed they were fairly peripheral.  Overall loan losses appear to have been relatively modest, and any disruption to the financial intermediation process –  of the sort often discussed in the literature around the economic costs of financial crises – must have been slight at best.  That New Zealand and the United States have had such similar paths of GDP in the last decade has left more sceptical than I was of the proposition that financial crises have large sustained real economic costs.

New Zealand also had more macroeconomic policy leeway than most countries.  Macroeconomic policy tools –  fiscal and monetary policy –  don’t make much difference to a country’s long-term prosperity, but they can make quite a difference to a country’s ability to rebound quickly from shocks.  Thus, for example, almost half the advanced countries I’ve been looking at are now members of the euro area.    Individual countries have no national monetary policy (so they can’t adjust their own interest rates or their nominal exchange rates) and the region as a whole has been at or near the lower bound on nominal interest rates for years now.  Many other advanced economies –  the US, UK, Japan, Switzerland, Sweden, the Czech Republic –  are also at the lower bound for nominal interest rate.  In all cases except Japan, they were able to cut policy rates a long way when the recession hit, but then they ran into limits.

New Zealand did not run into such limits.  In 2008/09 the Reserve Bank cut its policy rate, the OCR, by more than almost any of the other advanced country central banks.  But even then the rate was still 2.5 per cent.  There was plenty more leeway had that been judged warranted.  And during the recession itself, our floating exchange rate fell very substantially..

But the other area of macroeconomic policy where we had leeway was fiscal policy.  Intense debates rage around the role of fiscal policy in economic cycles.  When a country is not at the zero bound it seems reasonable that the stance of fiscal policy won’t make much difference to the path of GDP  (although it may affect the composition, and in particular that between tradables and non-tradables).  But it is likely to be a different matter for a country at the zero bound.  If there is little or no effective monetary policy leeway, changes in the fiscal balances are likely to have reasonably predictable “Keynesian” type effects: fiscal contractions will dampen recoveries, and fiscal expansions will support them.  Of course, confidence effects can undermine those effects, but in reasonably well-governed countries with floating exchange rates, it takes a lot to lead to material adverse confidence effects.  There is no evidence, for example, that the UK or the US came close to triggering serious adverse confidence effects during the years since 2007.

Turning to the IMF WEO database again, we can see what has happened to (estimates of) structural fiscal balances since 2007.  I would stress the word “estimates” –  no one can ever know the level of a structural fiscal balance with certainty, and current estimates for 2014 will be revised, in some cases perhaps quite substantially.  But here is how structural fiscal balances have changed since 2007.

fiscalbalances

Around half the countries have had fiscal contractions over that full period, while the other half have had expansionary fiscal stances.    Over the period as a whole, only seven countries are estimated to have had more expansionary fiscal stances than New Zealand.  What I found interesting is that of the 15 countries to the left of the chart, 10 had floating (or flexible in Singapore’s case) exchange rates.  Of the countries that have had contractionary fiscal stances, only a handful have flexible exchange rates.

Like most countries, New Zealand’s picture is one of two halves.  There was a huge shift from substantial structural surpluses as recently as 2007 ( when only Singapore had a materially larger structural surplus than New Zealand) , to large structural deficits just a couple of years later.   When I did one of these charts back in 2010, New Zealand had then had (depending on the measure used) either the largest or second largest expansionary shift in fiscal policy of any advanced economy.  The odd thing about New Zealand’s shift was that almost none of it was fiscal stimulus measures initiated once the recession hit –  it was all the effects of decisions made when it was thought (by politicians and their Treasury advisers) that times would stay good.

Since 2009 New Zealand, like many other countries, has been gradually reducing its structural fiscal deficit.  My point here is simply that we had the flexibility to do so, fast or slow, without materially affecting the economic cycle, because we never ran out of room to use conventional monetary policy to offset the short-term demand effects of fiscal consolidation decisions.  Having, on average, the highest real interest rates in the advanced world isn’t a good thing for our longer-term growth prospects (I argue) but in getting through the last few years it has had one distinct upside –  we had more room to cut rates than almost anyone else.  Given our disappointing economic performance, and weak inflation outcomes, one might argue that it is a shame that that leeway was not used more aggressively.

And finally, a chart of the IMF’s estimate of the level of each country’s structural fiscal balance in 2014.  New Zealand looks pretty good on this score (although the terms of trade flatter our numbers somewhat).
fiscal2014
Perhaps the saddest bars on both charts are those for Greece.  Running structural fiscal surpluses, in an economy at the zero bound and with 27 per cent unemployment, would not normally be considered sensible.  But that is what happens when a country loses market access, and yet lingers on in a straitjacket like the euro.  I stand by my assertion a month or two ago that there is no politically acceptable deal (politically acceptable in both other countries and in Greece) that can allow Greece to stay in the euro and yet begin to make material ground reversing the catastrophic loss of output and the appalling unemployment rate.  It increasingly looks as though the break is coming soon.  When and if it does, it will be messy for a time, but it finally offers a way back towards a more fully-employed economy.

Some bigger picture thoughts prompted by Budget day

Some further, slightly scattered, thoughts prompted by the Budget.

I can’t get excited about the question of which year a surplus is finally recorded.  Apart from anything else, the government’s interest costs include an inflation-adjustment component (medium-term inflation expectations are still around 1.85 per cent per annum).  That is effectively a repayment of principal, not an operating cost.  A modest deficit is consistent with inflation-adjusted balance or surplus.  And if one is content to have a positive target level of debt –  as those on both sides of politics seem to be –  then a small deficit each year is still consistent with a stable or falling ratio of debt to GDP.  We probably should be a little more worried about the continuing structural deficits, especially once an adjustment is made for the above-average terms of trade New Zealand has been experiencing.  High terms of trade should have made it easier than otherwise to get back to balance.   Then again, the Treasury appears to be quite optimistic about the future path of the terms of trade – let’s hope they are right.

When I went to Treasury for a couple of years, one of their more sage observers counselled me to focus on the core Crown residual cash balance (just like analysing a set of corporate accounts – look for the cash). That measure includes all the gains from the buoyant terms of trade, and the cycle peaks, and still doesn’t get to balance for another three years.

residual cash

Perhaps the more important question is how much debt should governments aim to have.  We like to think of New Zealand government debt as quite low.  Debt is often quoted as a ratio to GDP, but if we take government gross debt as a percentage of government revenue, that ratio is now around 130 per cent – not so different from the ratio of household debt to disposable incomes that often seems to trouble observers.  Net debt is certainly lower, but a considerable chunk of the financial assets are in the highly volatile New Zealand Superannuation Fund (which I have been meaning to write about).

gross debt

Looking at the tables in the last OECD Economic Outlook, six OECD countries currently have positive net government financial liabilities (Estonia, Finland, Korea, Luxembourg, Norway and Sweden).  Some argue for the government to run net assets, to counter the effects of the welfare system in deterring private savings.  Others could construct a case for a positive net debt, because of the significant real assets governments own (some of which are, arguably, productive).  Those effects go in opposite directions.  Personally, I’m not convinced there is a case for governments holding large net assets, but perhaps we should be looking at reframing the local debate, and aiming to see net government debt at least fluctuate around zero.    Shakespeare’s “neither a borrower nor a lender be” has some appeal as a medium fiscal strategy.  It won’t be a textbook public finance strategy, but those particular textbooks don’t give much weight to the failures, and weaknesses, of governments.  Aiming for something around zero would also mean citizens just didn’t have to worry about government debt, one way or the other.

As a strategy for normal times, I also quite like the longstanding Swedish fiscal rule, of aiming for a 1 per cent of GDP structural surplus (although I see that the current Swedish government is looking at scrapping it).  No one can do structural adjustments particularly accurately in real time, but a 1 per cent structural surplus target is a cautious pragmatic second best approach.  If you get it right, debt will be low when crises hit – and they eventually will.  But often enough you will misjudge your how structural your surplus is.  But if you think you are running a 1 per cent surplus, and it later turns out that it was in fact a structural deficit (if, say, potential GDP turns out to have been lower than was thought) you are most unlikely to be in major fiscal problems.  Getting back to balance from a 2 per cent structural deficit isn’t likely to be that hard, or that urgent.

And, on the other hand, aiming for no more than a 1 per cent structural surplus deliberately foreswears the over-optimism of those who believe that very large swings in structural fiscal balances can act as effective macro-stabilisers in boom times (ZLB periods might be different).  In fact, running up large surpluses in boom times – when no one knows how long booms will last –  just tends to set up an electoral auction.

The previous government in many ways deserves a lot of credit for keeping spending in check for their first six years, but the structural surplus in 2006 peaked at 4.7 per cent of GDP (OECD estimate). Those huge surpluses just set up an electoral auction in the 2005 election campaign.  No political party will ever want to be in the position of allowing their opposition to spend the surplus their way –  those choices, about priorities, are a large part of what politics is about.  And the large surpluses built up in the early 2000s didn’t even do much to ease pressure on monetary policy, because they were run up well before the peak pressures on resources (2005 to 2008).  Quite possibly, overall macroeconomic management in New Zealand over the last 15 years would have been a little better if piecemeal adjustments had been made throughout.  We’d never have got into a position where we had highly stimulatory discretionary fiscal policy in the period (2005-2007) of greatest pressure on resources (and on the exchange rate).  And it would also have avoided a situation where Treasury, applying its best professional judgement, finally determined only just before the great recession of 2008/09 that the revenue increases looked permanent.  A high stakes judgement that turned out to be quite wrong.  Fiscal institutions, and ambitions, need to take more serious account of the severe limits of anyone’s knowledge.  A Fiscal Council, as the New Zealand Initiative and the former director of the IMF’s Fiscal Affairs Department have recently called for, might explore some of these issues.  Or a Macroeconomic Council might?  Then again, our academics and think tanks might lead such debates,

In passing, it is worth noting that the Reserve Bank is always curiously reluctant to analyse sovereign debt risk in their FSRs, even though the New Zealand government would be by far the largest single-name credit exposure of any of the banks.  And the New Zealand government last defaulted on its debts some decades more recently than the last time a New Zealand bank defaulted on any of its debts.  In a through the cycle sense, how robust are the risk weights on domestic sovereign debt exposures?  I’m not suggesting that the New Zealand government is in any near-term danger of defaulting, but then neither are the banks – apart from anything else, the Bank’s stress tests told us so.  The Reserve Bank tends to assume that governments can always just increase taxes to pay their debts, or inflate it away, but the historical track record is that they don’t always do so.  Sovereign debt defaults are simply not that uncommon.  We’ve done it.  The US and UK have, and Reinhart and Rogoff reminded us of the rather long list of others.

But to return to the Budget, perhaps the saddest aspect is that there is no sign of any serious effort to turn around New Zealand’s decades of relative economic decline, or indeed to materially alter the state of affairs that sees 10 per cent of the working age population on welfare benefits.  Another year, another wasted opportunity.  There is a line in the Bible, “to whom much is given, from much shall be required”.  I doubt history will look that kindly on Key, Joyce and English, or Clark, Anderton, and Cullen –  stewards of our country’s affairs for the last 16 years between them. .  It is not that the macroeconomic stewardship has been that bad, under either government, but both seem to have been content to preside over whatever direction the ship is taking, rather than exercising effective and persuasive leadership to make of this country what it once was, and again could be.  The common line is ‘ah, but at least we avoided a financial crisis”, but to what advantage when our overall economic performance in recent years has been as bad as that of the United States, the country at the heart of the crisis, despite having had the best terms of trade in decades.

nz vs us

Jordan Williams does this better, but…

The government’s Budget was delivered yesterday.  I’ll post a few more analytical thoughts later, but this post is just a few scattered observations on individual measures:

  • Another $10m for the SuperGold card public transport subsidies.  Really?
  • A new tax on international travel.  I wonder if the government looked at the possibility of levying these costs on, for example, the apple and kiwifruit industries, for whose benefit most of the biosecurity apparatus seems to exist?  Are those industries really economic?
  • Scrapping the $1000 sign-on bonus for Kiwisaver is a good move, and perhaps next year they could scrap the $500 tax credit, and then abolish the scheme altogether (as a statutory provision).  At present, there is no evidence that Kiwisaver has raised the national savings rate at all and for people with both Kiwisaver accounts and mortgages the effective after-tax returns on funds held in Kiwisaver accounts must be pretty low (mortgages are repaid out of after-tax earnings, and tax is paid on earnings on Kiwisaver funds).   A more thoroughgoing review of capital income taxation, with a view to lowering it, would be a better step.
  • Radio New Zealand often doesn’t find very sympathetic people for its interviews.  As I was making lunches for my children this morning, I heard a benefit recipient complaining that the $25 benefit increase would only pay for buying a couple of school lunches for his kids.  That didn’t sound quite right:  On the one hand, if he really isn’t giving his kids lunches now, the increase must surely make a considerable difference.  And on the other hand, I’m pretty sure that the total cost of my three kids’ school lunches for a week, home baking included, is less than $25.  Incidentally, the Dom-Post reports that the benefit increases are around 8 per cent.  That is not small – real GDP per capita has increased by only that much since June 2005.
  • And does the government really have its priorities right when we still fritter money away on a Retirement Commissioner, a Children’s Commissioner, a Ministry for Women, a Ministry of Tourism, and a Ministry of Pacific Island Affairs.  I could go on: why are we funding a Reserve Bank museum (in what would be prime Wellington café space) or a “state of the nation” report answering the question “Who are NZ’s ethnic communities?”  And that is before we ask more serious questions about $400 million more to Kiwirail, and lots more to UFB (to which I have a jaundiced view after asking a senior minister at a forum some years ago why there had been no cost-benefit analysis of government spending in this area, to which he responded that one was not necessary because he knew the answer).
  • One hopes (surely?) that the reference in a press release to “up to $52 million” to replace a wharf on the Chatham Islands was a typo.  Then again, we are giving away money to a spa operator in Rotorua, so perhaps not.