A couple of days ago, I put this chart and brief comment on Twitter
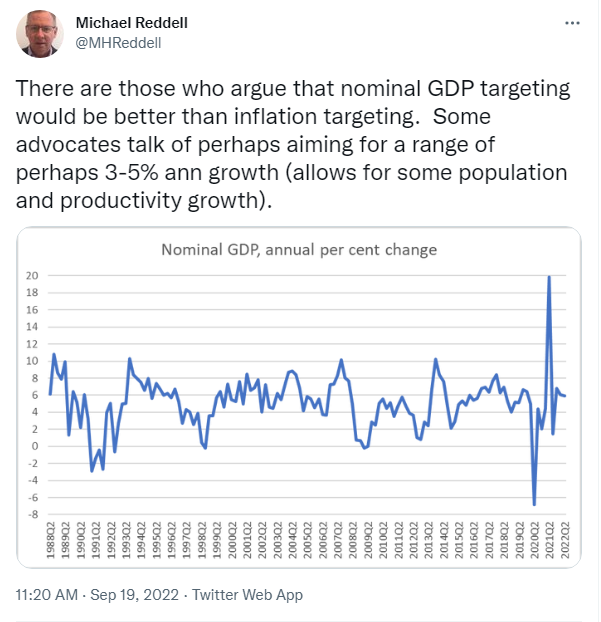
I added “I do not think nom GDP targeting is generally superior to inflation targeting for NZ, but recent outcomes (latest annual 5.9%) are at least one reason for a little caution about further aggressive OCR increases”.
There is a long history of people writing about nominal GDP targeting (it was being championed in some of the literature before inflation targeting was even a thing). I’ve written about it a few times (including here and here) and just this morning I noticed a new commentary from Don Kohn, former vice-chair of the Federal Reserve looking (sceptically) at some of the issues. No central bank has shifted to nominal GDP targeting (whether in levels or growth rates) but a fair number of people (including Kohn) will suggest that there may still be useful information in developments in nominal GDP – something to keep at least one eye on.
Almost every piece of economic data has been made harder to interpret over the last couple of years by Covid. In my chart, the eye immediately tends to go to the unprecedented fall (in 2020) and unprecedented rebound following that. But my eye next went to what wasn’t there: the most recent rate of increase (nominal GDP in the June 2022 quarter is estimated to have been 5.9 per cent higher than that in the June 2021 quarter) wasn’t at all out of line with typical experience in the last few decades. It is quite a different picture than we see with headline and core inflation measures. And although Covid has continued to affect economic numbers, last June quarter seemed relatively little affected by Covid here (the Delta outbreak was mid-August), and by the June quarter we were through the worst of the restrictions. Perhaps as importantly for what follows, the June quarter was pretty normal for most other countries too (and the June 2020 quarter was pre-Omicron disruptions).
One upside of New Zealand’s slow publication of macroeconomic data is that when our GDP numbers are finally published, pretty much everyone else’s are available for comparison. And although people often note (fairly) that nominal GDP numbers are published with a longer lag than inflation numbers, we are also now in the long New Zealand hiatus where it is two months since we last saw an inflation number, and another month until we get another one. The MPC makes its next OCR decision before that.
So how did New Zealand’s estimated nominal GDP growth for the year from the June quarter last year to the June quarter compare with the experience of other OECD economies? Here I’m focused on places having their own monetary policies, and so show the euro-area rather than the individual countries in that area. I’m also going to leave Turkey off my charts – mostly to keep them more readable, in a context where they are running a crazy monetary experiment and have recorded nominal GDP growth of 115 per cent in the last year.
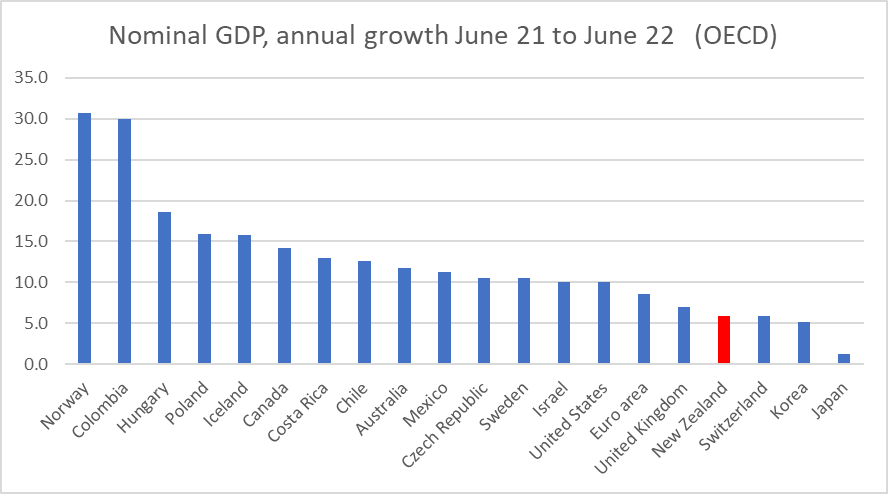
Nominal GDP growth in (fairly low inflation) Norway went sky-high because the invasion of Ukraine etc has sent oil and (especially) gas prices very high.
But look at New Zealand: we had the fourth lowest rate of nominal GDP growth in that year among all the OECD countries (monetary areas). And two of those below us – Switzerland and Japan – had not only not eased monetary policy in 2020, but had spent years grappling with such low inflation they’d needed persistently negative policy interest rates.
Absolute comparisons like this can mislead a bit. Some countries have higher inflation targets than others – Chile, Costa Rica, Mexico, and Colombia for example target 3 per cent inflation, and have historically had somewhat higher nominal GDP growth rates consistent with those higher targets. But I could take the Latin American countries (poor enough that they are really OECD diversity hires) off the chart and it wouldn’t much change the picture as it affects New Zealand and the countries we often compare ourselves to. In Australia, for example, nominal GDP increased by almost 12 per cent in the year to June.
The last quarter before Covid was December 2019. Across the OECD as a whole (and in New Zealand) core inflation at the time was generally a bit under the respective (core) inflation targets, and many central banks had been cutting policy rates that year.
Here is nominal GDP growth (as now recorded – GDP revisions are a thing) for the same group of countries for the last pre-Covid year.
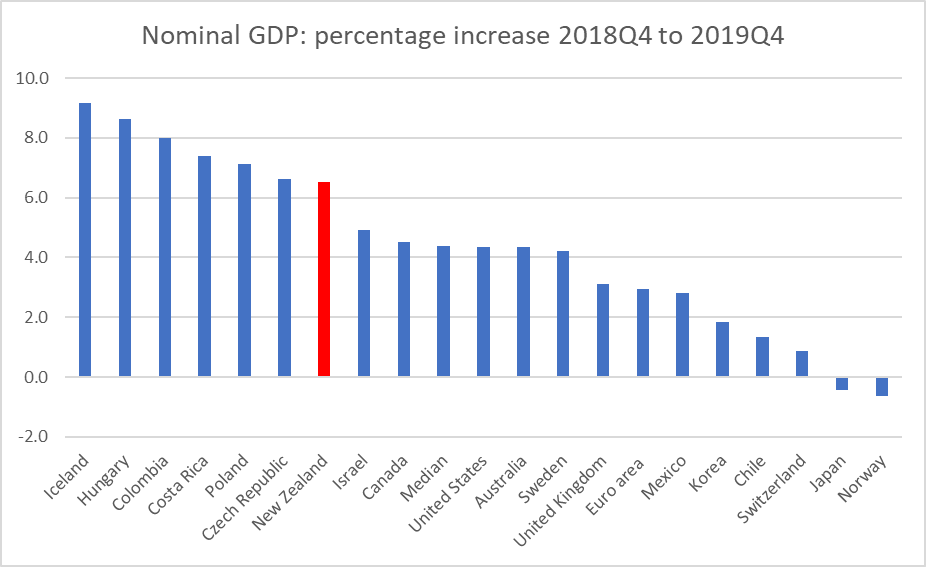
New Zealand’s rate of nominal GDP growth then was a bit higher than the median OECD country, perhaps consistent with the fact that our population growth rate was faster than those for most advanced countries. But our nominal GDP growth rate that year was also a bit higher than the average rate New Zealand had experienced in the previous decade or more. (Note Norway again; not even the staunchest advocates of nominal GDP targeting recommend it for countries with terms of trade shocks on that scale.)
The next chart shows annual growth in nominal GDP for the latest period less annual growth to the end of 2019. The idea is to see how much acceleration there has been (with the sort of lift in core inflation we’ve seen across most of the world all else equal one might expect to have seen quite a lift in nominal GDP growth).
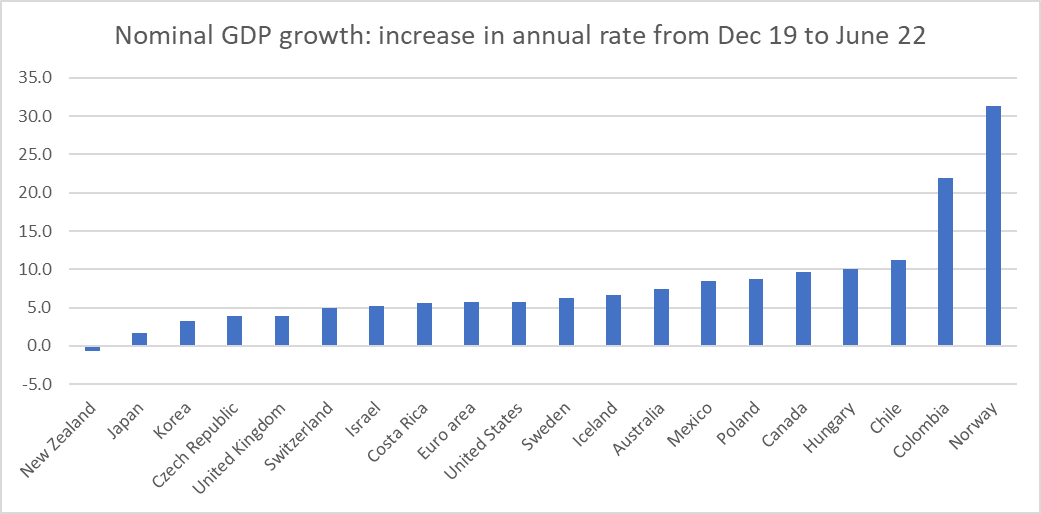
Fair to say that New Zealand stands out somewhat. In the year to June 2022 New Zealand was the only OECD country to have had nominal GDP growth lower than in the immediate pre-Covid period. And if our terms of trade have fallen a bit in the last year, that was still in a context where (NZD) export prices were up 17 per cent in the most recent year, with import prices up even more.
I am genuinely not sure what to make of these pictures and the New Zealand comparisons specifically. If you look across that last chart you would have little hesitation in suggesting that a lot of monetary policy tightening (interest rate rises) has been warranted in the advanced economy world. For the median country, nominal GDP growth has accelerated by 6 percentage points. But in New Zealand, nominal GDP growth has slowed.
And if one were a champion of nominal GDP levels targeting, here is New Zealand’s nominal GDP over the last decade
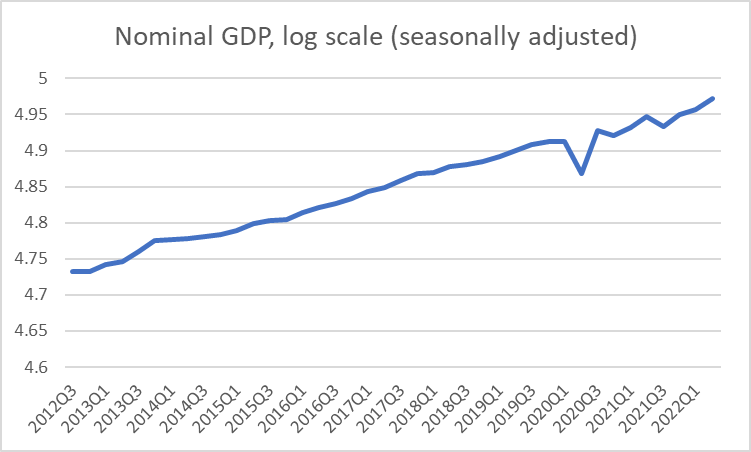
Things have (inevitably) been bumpier in the Covid period, but there is nothing there suggesting things have gone off track in recent times (although the mix has changed, with less population growth and more inflation).
The usual fallback position when anyone invokes nominal GDP numbers is to note (entirely fairly) that revisions to GDP are very much to be expected. Perhaps we will find, five years hence, that nominal GDP growth in the year to June 2022 was really a couple of percentage points higher than SNZ currently estimate. That would be a pretty large change for a single year (as distinct from historical levels revisions as data collections and methodologies change). But – if every other country’s estimates didn’t change – one could revise up New Zealand’s rate of nominal GDP growth by 2 percentage points and we would still be equal lowest (with Japan – where they are still running avowedly expansionary monetary policy) on that chart showing the acceleration in the rate of nominal GDP growth.
Two other considerations are worth noting. It isn’t true that our Reserve Bank was particularly early in raising the OCR again – about six of these countries were ahead of them – but market interest rates had already risen quite a bit last year in anticipation and we had had one of the frothiest housing market during the Covid period, and are now somewhat ahead of the pack in seeing house prices and house turnover falling away. Even if – as I am – one is sceptical of house price wealth effects, housing turnover itself is one (modest) component of GDP. Either way, our subdued nominal GDP growth may be foreshadowing what could be about to happen elsewhere.
Monetary policy is avowedly run on forecasts – that would be true (or the rhetoric) even if one were targeting nominal GDP growth rather than inflation – and I guess it is always possible that we might see an acceleration of nominal GDP growth from here, that might support further Reserve Bank tightening from here. Perhaps, but it is difficult to see quite where this acceleration might come from.
I have been a little more sceptical than some in recent months of quite how much further the OCR is really likely to need to be raised, but I am not drawing strong policy conclusions from these data just yet. But they do seem like a straw in the wind that (a) warrants further investigation and (b) might make one somewhat cautious about championing further tightenings, especially in the absence of timely fresh inflation data. Subdued growth in nominal GDP is more or less exactly what one might expect to see if, with a lag, core inflation was already on track to slow, perhaps quite a bit.

Recognising this is a discussion about operation of monetary policy, and for that reason looking at nominal GDP growth, it would still be interesting to include graphs on real GDP growth per head. That would strip out the discussion of immigration/population growth, and would also give an idea of how we compare against similar countries in real terms.
I guess that wouldn’t be a monetary policy discussion then, but it was immediately what I was thinking about when perusing your graphs.
LikeLike
As you say, a quite different topic in many ways, but the chart in this tweet gives per capita growth comparisons over the period since just prior to Covid
LikeLike
Interesting data. Not overly impressive, but to be honest not as bad as I’d feared. Still worse than Australia, but better than a number of places.
LikeLiked by 1 person
As far as Immigration being inflationary, this has clearly been debunked with the non existent and negative immigration in the last 3 years now and inflation though the roof. Clearly immigration dampens overall prices pushing down the wage costs which feeds into all our consumed products.
LikeLike
I’m not sure you can conclude that from the evidence.
I think you can conclude that in this instance immigration wasn’t the cause of inflation. That doesn’t mean it’s never the cause, particularly in respect of asset prices (e.g. house prices in an environment with constrained supply).
Equally, I don’t think you can conclude that immigration lowers wages, there have been a lot of studies on that with mixed results. As with many things, I think the answer is “it depends”. Much like minimum wages may cause unemployment, but really only when the minimum wage is set at a level close to the median wage (as NZ’s is). Skilled immigration can drive up wages. Unskilled immigration increases the overall number of consumers in the economy, which creates demand for labour. It also increases supply of unskilled labour. Would it be true to say that temporary workers going fruit picking holds down fruit picking wages? Or more that NZers simply don’t want to do that job anyway?
LikeLike
I work in the Accounting/Taxation sector and the property sector. I can tell you straight off the bat, that immigration, particularly the missing 100k students refreshed each year now non existent lowers wages massively. A lot of junior lower level work now has to be performed by more senior higher paid accountants with the resultant labour shortfall to complete higher level which has in turn driven up wages to fill those roles. Similarly in construction, the missing 400,000 foreign workers are driving up wages throughout the property building and services sector.
I say bring back immigration and get back sensible wage levels.
LikeLike
By that logic, the unions are right. Stop immigration and drive up wages for NZers, make us a high wage economy.
On both sides of that argument I think it’s more complex than that.
LikeLike
Unions and workers will always want higher pay. That is a known fact. But higher wages without the associated increase in productivity also leads to higher inflation. Higher productivity that actually makes an iota of difference means to have highly automated factories with fewer workers. But we have shut down our factories and instead are reliant on cheaper and cheaper imports from China to dampen inflation for product consumption. That is why like cheaper product imports from China to lower product consumption inflation, cheaper foreign workers also another major cost component reduces inflation. It is actually just common sense and simple maths equations. Covid unfortunately shut down our access to cheap Chinese products and cheap workers, hence that’s what is essentially driving up inflation.
LikeLike
A detailed analysis of the CPI at the 3rd level of disaggregation shows that inflation is likely to disappear as quickly as it materialised. Much of it is transitory, with some big base effects, and a good slug is connected to housing, which is clearly struggling. Also petrol prices are going to become disinflationary from here, Q4 CPI could be surprisingly weak.
The removal of COVID travel restrictions is already seeing a bounce back in tourism, but weakness in domestic demand and stock building means GNE is going to be very weak, constraining imports. So while we may avoid a recession in GDP, the recession in GNE isn’t gonna be fun.
And it’s quite clear in the migration data that its turning up. Work and Student visas are holding it back but thats heavily seasonal. As that normalises over the summer months concerns about the labour market and wage pressures will dissipate.
Further rate hikes aren’t required, but they’re coming regardless.
LikeLike
I wonder why you think petrol prices will become disinflationary. As I understand it, the downwards pressure on price was manufactured by the US releasing such a sizeable level of its reserves. As I’ve read it, they will now reverse that and begin to replenish those, and now in even more of a hurry given Russia has just declared all-out war on Ukraine. I wouldn’t be surprised if we see rationing in the US.
LikeLike
Downward pressure on inflation comes down to China and its factories reopening and pumping out cheaper products. If China remains covid restrictive inflation will still be high and higher and higher interest rates will just decimate the local NZ economy but will not dampen inflation. All we will see is a collapse of the NZD and inflation still through the roof.
LikeLike
Rate hikes are inherently also inflationary. When you add to the cost and in order to maintain margins, a business will have to increase prices which is inflationary.
Someone mentioned today in the news that we need 50,000 extra people out of work. What an idiot. Decimation of an economy can also lead to a collapse of the NZD which is also inherently inflationary when we are heavily import reliant.
LikeLike
I believe the release of oil reserves was a drop in the bucket (and puzzling that they sold some of that oil to China). The more significant cause for the price of oil easing was the widely held market expectation that the Fed was determined to aggressively raise interest rates to lean against inflation, like other CBs, and the belief that this would lead to a recession (in which the economy would consume less oil).
LikeLike
The canary in the mine are businesses that are heavily debt reliant which does point to the development and building sector and also the support services to this sector eg real estate agents. As interest rates rise, activity in this sector declines. I have usually been pointing to the RBNZ as foolish economists for decimating the NZ economy with rapid interest rate rises.
I have started to understand why the RBNZ has no choice but to accelerate interest rate rises at a rapid pace. It is to do very much with our governments ability to borrow when issuing NZ bonds. A bond tender would be more likely to be successful when the market believes interest rates have peaked. Bond value rises as interest rates fall.
Vice versa, Bond market values decline when interest rate rises. Who will invest in NZ bonds when interest rates are rising? It is therefore critical for the market to believe that interest rates have peaked and poised to fall in order for the govt to be able to borrow by issuing new bonds, hence the reason why the RBNZ has no choice but to drive up interest rates by sacrificing the NZ economy to satisfy the governments hunger for borrowings.
LikeLike
Any reason why you are not calculating percentages using annual totals/averages? You appear to be using quarter t on quarter t-4 for the % instead of annual t on annual t-4 in your chart and commentary. The latter would seem to make more sense in that people typically think of nominal GDP in annual terms and would be a lot less volatile as a target. Using annual figures your 19.9% figure for 2021Q2 would become 7.3%.
LikeLike
Yes, two (closely related) reasons for using quarter on same quarter a year ago, rather than four quarter total and four quarter total a year earlier. My focus is on where we are now (well, June quarter is as close to “now” as we get from the national accounts) or v recently. Annual growth from the same quarter a year ago is a lot more recent than annual growth in the four quarter totals (which still has in its denominator developments from 2 years back). But the v specific reason is the Covid disruptions that were very severe in the June 2020 quarter, quite serious in the Sept/Dec qtrs last year, and somewhat serious earlier this year. Comparing this June quarter with the June quarter 2021 (free of immediate Covid lockdowns disruptions etc) was a relatively clean read (a) for NZ, but also (b) for other advanced countries (few of whom were having lockdowns in either quarter).
Ideally one might put more weight still on quarterly percentage changes, but in quarterly data the noise to signal ratio is quite a bit higher (and more so in this June as there was some recovery from Omicron disrupted March).
LikeLike