I was always a bit ambivalent on the idea of a public holiday to mark the death (and life) of Her Late Majesty: there were (and are) better, cheaper, and more enduring things that could (have) been done. And the more so when the day chosen seems less to do with Queen Elizabeth (whose funeral and burial were a week ago) and more to do with the Prime Minister’s schedule. But here we are.
It seemed like a good day to potter in the old data and see how things went, in terms of relative economic performance, for the independent countries of which the Queen was monarch throughout her reign – the United Kingdom, Canada, Australia and New Zealand. Back in 1952 there were a few others – South Africa, Pakistan, and (as it then was) Ceylon. The other current realms (PNG, the Solomons, Belize, and so on) were not independent until later.
In the table below I started with Angus Maddison’s collation of historical GDP and GDP per capita (in purchasing power parity terms) estimates. I used the Western Europe and “offshoots” (NZ, Australia, Canada and the US), the east Asian countries that are now very prosperous (Singapore, Taiwan, Japan, and (South) Korea), included a few representative central European and South American countries, and included the other 1952 realms (South Africa, Pakistan, and Ceylon).
My main interest was comparing rankings from 1952 to those now. But if one starts from 1952, some people will make (not entirely unreasonable) objections about it being just after the war, and so the numbers may flatter countries that had little or destruction in World War Two, so I’ve also included 1939 numbers where (most cases) Maddison had them available. And for the most recent period I’ve included rankings for both GDP per capita and (my preferred focus) GDP per hour worked.
(UPDATE: This table replaces the original one in which I had inadvertently given Uruguay’s the US’s 2021 GDP and vice versa)
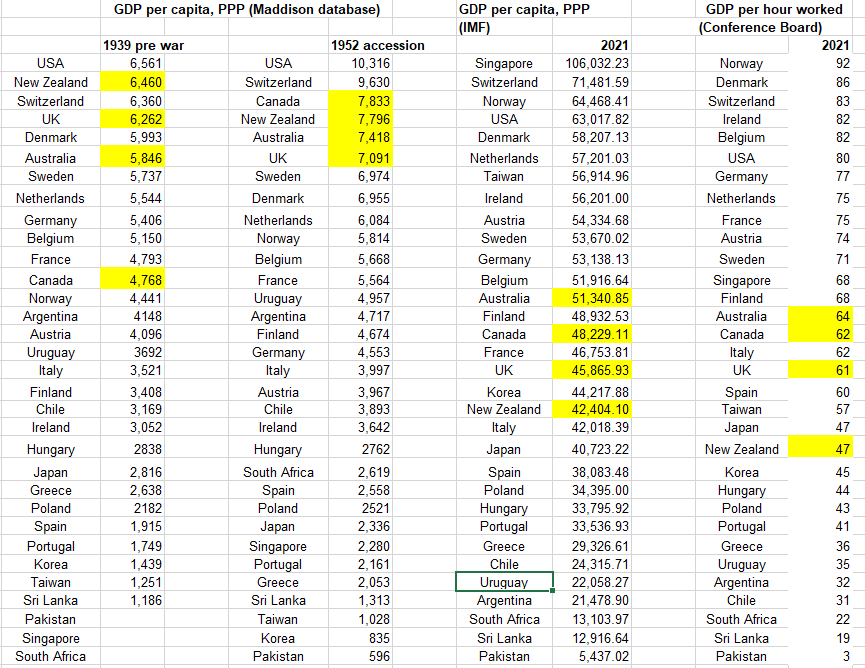
There are all sorts of extended essays one could write about relative growth performance over the decades/centuries for different groups of countries, but here my main interest is just in the four Anglo countries of which the Queen was monarch from 1952 until a couple of weeks ago. That picture is not a pretty one. 70 years ago all four countries were in the very top grouping, and these days not one of them is. Not in any way the fault of Her Late Majesty of course: she and her Governors-General act only on the advice of respective sets of ministers in each country, but a poor reflection on the countries concerned, and their successive respective governments nonetheless. New Zealand, sadly, has been by some margin the worst of them.
If I were inclined to be particularly gloomy – okay, I am – one could even note that the extent of the drop down the league tables for these stable democratic rule-of-law countries, isn’t materially different to the drop experienced by Uruguay, Argentina, and Chile, none of which enjoyed uninterrupted democratic governance over those decades. South Africa has had a similar drop down the league tables too.
I have my own stories about why most of the seven countries (Anglo and South American) have done poorly, but I don’t claim to have any particularly compelling tale about the UK and the extent of its continuing relative decline.
