The OECD’s latest Economic Outlook came out a few days ago. As always with the OECD, the value is rarely in the analysis or policy prescriptions, but mostly in the vast collection of more-or-less comparable tables, collating data for a wide range of advanced economies (and a few diversity hires).
Take public debt as an example. Next week our Treasury will be out with their HYEFU and more-detailed New Zealand numbers for central government. But there is no easy way of comparing Treasury’s New Zealand numbers with those for other countries. And so I tend to focus most often on the OECD series of “net general government financial liabilities”, which includes all layers of government, and doesn’t exclude things that particular national governments find it convenient to exclude (in New Zealand’s case, all the assets in the Crown’s hedge fund, the NZSF).
The OECD’s forecasts only a couple of years ahead, but that is probably about the most that is useful anyway, Here are their recent forecasts for net general government liabilities as a per cent of GDP (for the 30 countries they do these numbers for).
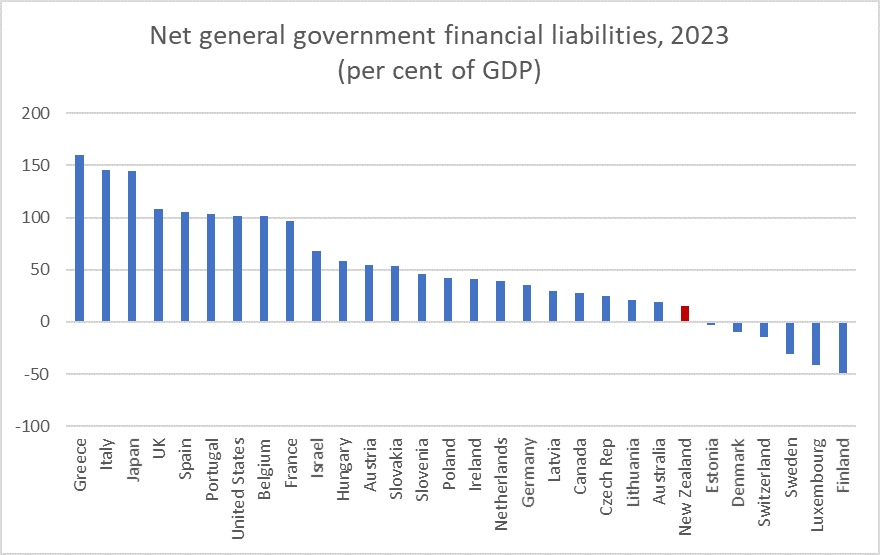
For New Zealand, the 2023 number is 14.82 per cent of GDP and on these forecasts we’d be 7th lowest of (these) OECD countries. There isn’t a forecast for Norway for 2023, but they have net financial assets of about 350 per cent of GDP, so call it 8th.
Going into the pandemic, our net general government liabilities as a per cent of GDP in 2019 was 0.8 per cent. (Including Norway) we were 8th lowest of these OECD countries.
That is a not-insignificant increase in net debt as a per cent of GDP. Between 2007 and 2012 – serious recession and the earthquakes – net general government financial liabilities were increased by about 12 percentage points of GDP. But, and on the other hand, in five good-times years (from 2002 to 2007) net general government liabilities as a share of GDP dropped by 23 percentage points of GDP.
Here is the cross-country comparison over time
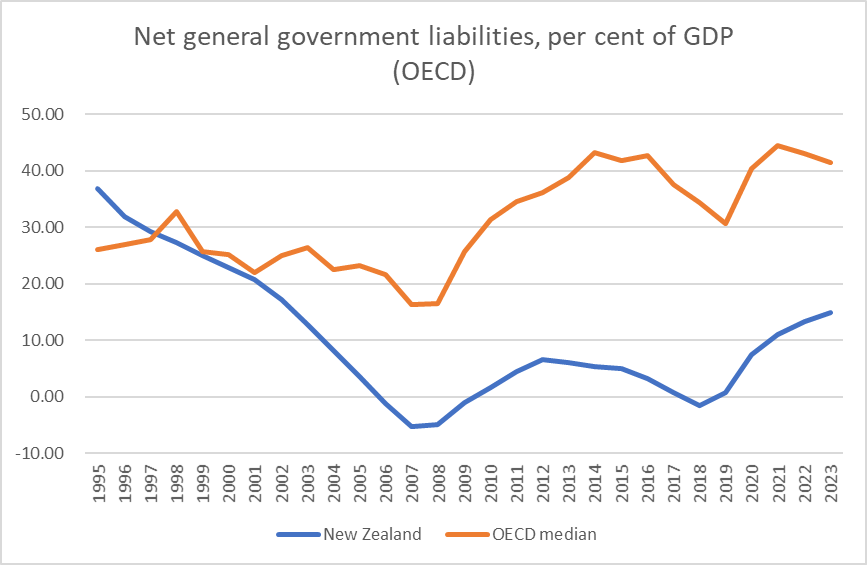
I’m not suggesting we should be totally comfortable about that picture, but our net public debt is forecast to remain (a) low, and (b) much lower than the typical advanced country.
What if we break out the countries. Some argue (I’m not really convinced) that big countries, at least those with a history of reasonable government etc, can comfortably ran higher ratios of public debt than smaller countries. And, on the other hand, perhaps the countries most like New Zealand are the fairly-small places with their own central bank and floating exchange rate. Here are the relevant comparisions over time (medians in both cases).
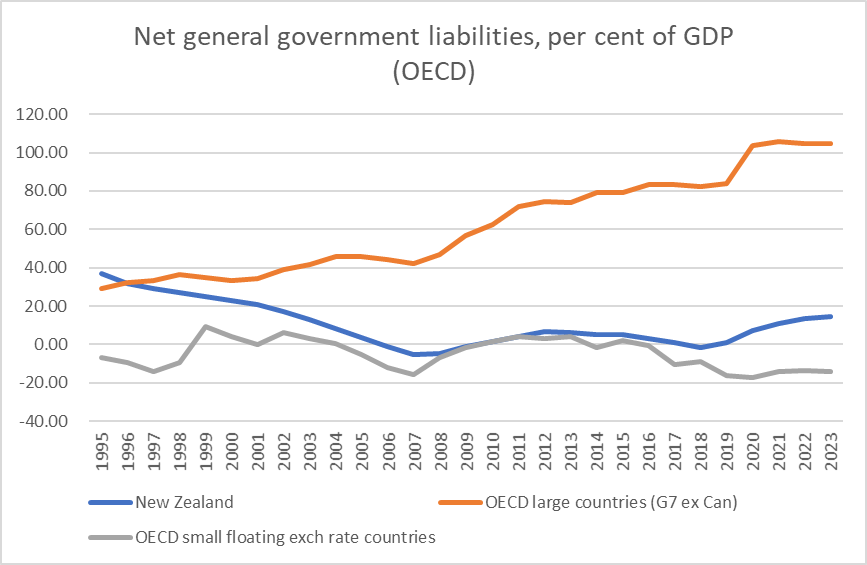
The big countries – Germany excepted – really have been on a rising debt path. I’m not one who believes crisis and/or default is looming (generally – Italy remains a wild card) but were I a voter in one of those countries I’d be seriously uneasy. Were I involved in an opposition political party, I hope the high and rising debt would be made a salient political issue.
But – and generally – the small advanced countries have done pretty well (true on this sample of countries, or if one uses all the small countries – including those in the euro – in the database), and there has been (and is) nothing startling or particularly impressive about the New Zealand performance. If anything, one might note the widening gap at the end of the period.
Of course, none of this includes the fiscal challenges imposed by the rising NZS fiscal burden from maintaining the age of eligibility at 65 (although it is now a decade since baby boomers started turning 65) and the expected trend increase in public health expenditure….but I really can’t see public debt itself being a particularly salient issue in 2023.
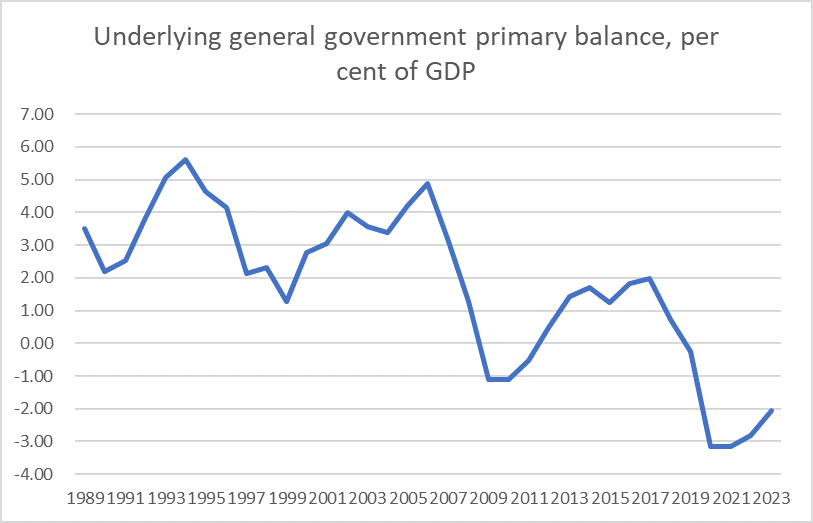
But what about deficits? No one argues the government should have been running a balanced budget last year, and perhaps not even this year (given the renewed lockdowns and big output losses the government left itself open to), but why not 2023? These are the OECD’s projections – the primary balance excludes financing costs, and a common rule of thumb is that even a small primary surplus is consistent with keeping debt in check. “Underlying” captures cyclical-adjustment.
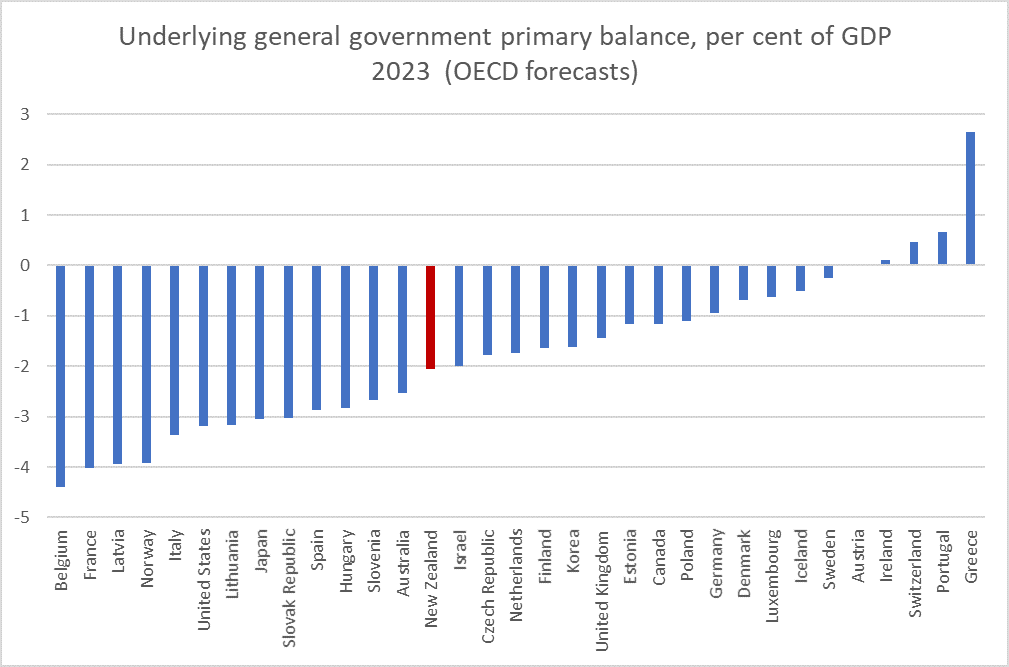
In 2023, with the economy projected to be fully-employed (a reasonably significantly positive output gap), with a strong terms of trade, and (as ever) with some of the highest real interest rates anywhere in the advanced world, the OECD estimates that the government’s fiscal policy will see us in 2023 with a large primary deficit, a bit worse than the median OECD country. (Norway’s primary deficit is much larger, but remember that they have big net earnings (finance receipts) on the government’s huge net asset position.
Were one confident that spending initiatives were being ruthlessly scrutinised to keep waste to an absolute minimum, perhaps one might be a little less worried – although small structural surpluses, where spending is funded by taxes remains a good rule of thumb – but does anyone suppose that describes current New Zealand approaches to public spending.
I don’t suppose Ardern and Robertson are likely to let things get really out of hand. They seem oriented enough towards broad macro stability – in the traditions of all New Zealand governments of recent decades – even as they too watch our real economic performance decline, but at present the structural deficit picture (as the OECD interprets our data and policies) isn’t looking that good.
There should be considerable scrutiny on the government’s plans in the forthcoming Budget Policy Statement, and the Treasury’s HYEFU projections.
