Next Monday morning in Paris, the OECD’s Economic and Development Review Committee will be gathering to discuss the draft of the latest Economic Survey of New Zealand. These mid-level public servants will pose some questions, offer some observations (some insightful, most probably not), and their French and Hungarian members will lead the questioning and – if the past is any guide – get to enjoy a very nice lunch at the New Zealand Embassy. Some weeks later, after the text has been haggled over line by line, we will get to see what the OECD has to say about our economic performance and policies.
But in many respects, the numbers speak for themselves, and the OECD does a pretty good job – one of the useful things it does – of collating and making accessible a wide range of data for its member countries.
The OECD’s series of labour productivity data (real GDP per hour worked (in PPP terms)) starts from 1970. New Zealand joined the OECD in 1973 when it was a club of 24 countries. For all but two (Austria and Greece) of those countries there are labour productivity estimates back to 1970. By 1970, New Zealand had already dropped a bit below the median OECD country, but the countries either side of us were France and the United Kingdom, and we were just slightly behind Germany.
In relative terms, New Zealand’s economic performance was particularly bad in the 1970s. Of those 22 OECD countries for which there was a consistent series of data, over the course of the 1970s New Zealand’s real GDP per hour worked fell from about 95 per cent of that of the median country to about 75 per cent. By 1980 only four of those countries had lower labour productivity than we did, and we were no longer between the UK and France but between Ireland and Finland. To younger readers, Ireland may not sound too bad, but Ireland in those days was still an underperforming economic backwater.
Things didn’t look too different in 1990. The number of countries for which there is data had increased a bit and of the 1973 membership we now stood between Japan and Greece.
The 1990s was an era of opening-up. A variety of countries re-emerged from the ashes of the Soviet Union and Yugoslavia, other countries formerly under the thumb of the Soviet Union began turning themselves into market economies. And the OECD itself started to broaden its membership, looking to Asia and Latin America for new members. That process has continued and there are now 38 OECD countries, and (more importantly for this post) labour productivity data for all of them since at least 2000.
In 2000, 17 of those 38 countries had average labour productivity lower than New Zealand’s. We were still between Greece and Japan.
By 2010, 16 of those 38 countries were below New Zealand. By then we stood between Greece and Slovenia, the first of the former eastern-bloc states to match us.
So far, so mediocre.
But what about the more recent period? 2020 marked the end of another decade.
It takes many many months to get a complete set of annual data (and, of course, many of those numbers – including our own – are still subject to revision). But the full set of 2020 estimates is now available.
I have been quite hesitant about using 2020 data for anything other than Covid purposes. Countries had quite diverse Covid experiences – some good (bad) luck, some good (bad) policies etc but most of any differences probably not telling us much about the longer-term economic performance story. And measurement was a real challenge – both GDP and hours worked. Bear those caveats in mind in what follows, but looking at the data (and checking against trends to 2019) the distortions seem less than I might have thought/feared.
Here is how things looked in this snapshot.

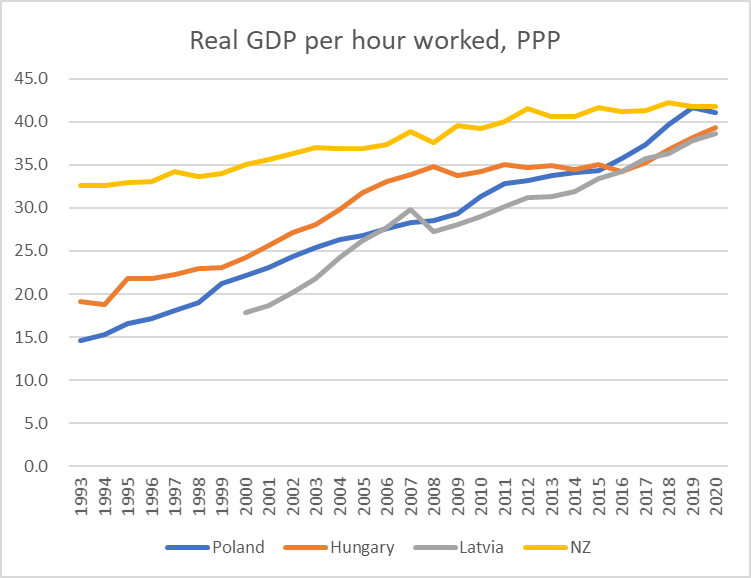
Only 9 countries now do less well than us, and we are bracketed between Korea and Poland (for all the hype around Korea’s economic performance – and it is impressive over several decades – only now has their average labour productivity matched that of underperforming New Zealand). Former laggards Turkey, Slovakia, Slovenia, Lithuania, the Czech Republic and Estonia have now moved past us – some well past us – and mostly just in this last decade.
And if you think this is just a story about other countries doing really well – which we shouldn’t begrudge for a moment, it is something to celebrate – bear in mind that on these estimates New Zealand’s productivity growth rate in the 2010s was less than it was in the 1970s. That’s the New Zealand of Key, English and Ardern – oh, and record terms of trade – managing to underperform the New Zealand of Kirk, Rowling and Muldoon.
If that chart is bleak enough about New Zealand’s standing in the OECD league tables, just think where it might be a few years from now. It is good of the OECD to have welcomed in the four Latin American members – the diversity hires – who will keep New Zealand off the very bottom of the league table for a long time. If Chile is managing pretty good productivity growth. Mexico in 2020 had real GDP per hour worked no higher than it had been in 2000.
But of the five countries below us last year, three are likely to go past us in the next few years.
Portugal could pass us too, but they’ve been just slightly behind us for 30 years now.
2025 was once – briefly – the year when we were supposed to have caught up with Australia by. Instead, most likely, on this metric the only OECD countries that will be doing worse than us will be Portugal, Greece, and the four Latin American members that don’t even make most lists of advanced economies.
What a woefully bad set of outcomes successive waves of politicians and officials have delivered for New Zealanders. (All while they’ve delivered us some of the most expensive housing anywhere.) And what is perhaps most depressing is that none of this seems to bother either side of politics, and neither political parties nor (so far as we can tell) officials seem to have any real interest in reversing decades of underperformance. These outcomes aren’t some exogenous given, but the outcome of repeated sets of policy choices. And if the policy choices of the previous government in this area were bad (and they were) those of the current lot seem materially worse (exemplified in recent days by the tens of billions of taxpayers’ money they want to spend on glorified trams, as if money were no object).
Incidentally, lest anyone be under the illusion that Australia itself is some sort of success story, Australia (7th in the OECD in 1970) is now close to the middle of the league table – much better than New Zealand, but not exactly a multi-decade success story.
There is a group of countries near the left hand side of the first chart – from Switzerland to Germany – that I’ve often contrasted us with. Even in 1970 we were behind all of them on this measure (basically level-pegging with France). But now, to catch up with the median of those countries it would require a 69 per cent lift in New Zealand average labour productivity.
It could be done – it would take productivity growth averaging 1.3 per cent per annum faster than in those countries for 40 years – but it isn’t going to happen by simply ignoring the issue, hoping for different outcomes, or by adopting sets of policies that are only likely to continue our decades of relative decline.

Whilst this is depressing and disappointing the global chaos presents opportunities but to be successful will require painful adjustments and changes in attitudes not least from Politicians & Bureaucrats so some short term pain will be suffered if an administration (2023) makes those changes. I live in hope but not expectation.
LikeLiked by 1 person
Hi Michael,
One criticism I have of these data is their definition of the PPP rates, which I’m deeply skeptical of…
LikeLiked by 1 person
Fair point Peter on absolute levels comparisons. That said, the OECD numbers are specified in one specific year’s PPP terms (2015 in this case), so that the changes in rankings over the last decade just reflect relative growth rates in real national constant price data.
On levels, it might be sensible to treat anything 10% either side of the point estimate as much the same . In 1970 that would have put us in a bunch with Italy, France, Germany and the UK, and last year with Israel, Slovenia, Lithuania, Czech Rep, Estonia, Korea, Poland, Latvia, Portugal, Hungary.
LikeLiked by 1 person
About 10 years ago the neighbouring property was rented to a Turkish family; they stayed about 4 years, had two children and then returned to Istanbul. I’ve often wondered why they left, hypothesising issues with religion, home-sickness, lack of babysitting grandparents and kiwi lifestyle. Your data gives me another reason – quite simply they would be better off financially in Turkey.
When I arrived in NZ almost 20 years ago my impression was disposable incomes in Auckland were lower than London but maybe similar to equivalent sized cities in the UK: Leeds, Manchester, Glasgow but in those days NZ house prices even in Auckland, were far cheaper than London. When I was last in Europe (France, Germany, England) in 2019 my impression was NZ had fallen further behind but I still preferred my Auckland lifestyle over most equivalent ones in England – however if I ever learned French I might be tempted away.
It is sad our politicians rarely discuss productivity.
LikeLiked by 2 people
I wish I knew more about Turkey, and am somewhat surprised just how fast the reported growth in Turkish productivity has been in recent years (amid the political tensions and monetary chaos). But there seems little doubt they have done much better than us in the last 20 years or so.
I’m certainly not going anywhere myself but I’m increasingly inclined to suggest the kids seriously consider leaving (sad as that might be at a personal level).
LikeLiked by 1 person