In yesterday’s post I drew attention – yet again – to New Zealand’s continued drop down the international productivity league tables. There are all sorts of caveats to the details – PPP comparisons are inevitably imprecise, and the data are subject to revisions – but few seriously doubt that we do much worse now relative to other advanced countries than we did just a few decades ago.
But it is easy to lose sight of what the numbers actually mean for ordinary New Zealanders, so I thought today I might do just a short stylised illustration.
In yesterday’s post – as on various occasions in the past – I’ve contrasted our outcomes with those of a group of highly successful OECD countries (but excluding Norway (oil), Ireland (even their own authorities don’t use GDP as a measure of Ireland’s outcomes) and Luxembourg): Switzerland, Denmark, Belgium, the United States, Sweden, Austria, France, Netherlands and Germany. They can be thought of these days as some sort of “leading bunch”, at least as regards labour productivity.
In 1970, when the OECD data start, our real GDP per hour worked was about 82.5 per cent of the median for this group of countries. By 1990 that proportion was about 64.5 per cent.
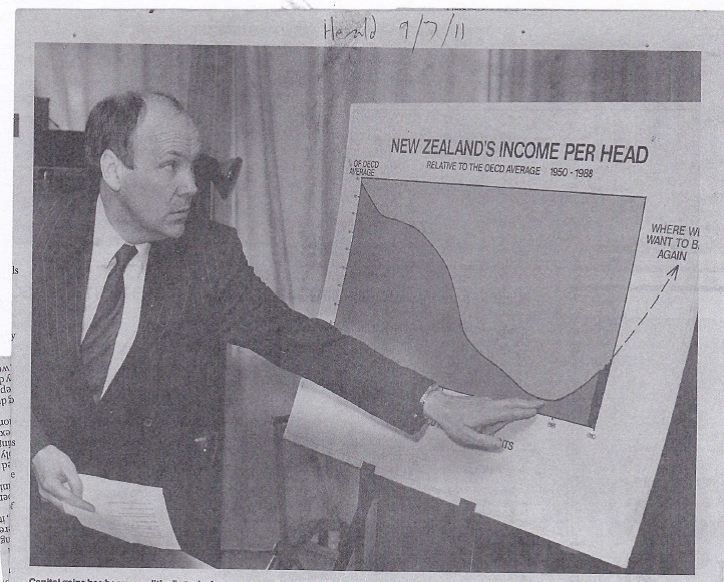
In 1990 the confident hope – among officials and ministers, and more than a few outsiders – was that we were on the brink of turning things around. I’ve shown before this photo of then Finance Minister David Caygill’s aspirations/expectations.
Let’s suppose it had worked.
The fall in our performance relative to that OECD leading bunch had taken 20 years, so suppose that over the following 20 years we had steadily improved such that by 2010 our real GDP per hour worked was again about 82.5 per cent of that of the leading bunch, and then held at that ratio subsequently. That wouldn’t have made us a stellar performer, but at least on the OECD’s numbers we’d be doing about as well as Canada and a little better than Australia. Since we’d more or less tracked Australia for many decades earlier it wouldn’t have been an unrealistic aspiration at all.
How much difference would it have made?
There are lots of possible moving parts, but I did this little exercise by taking as my starting point actual real GDP per capita for New Zealand each year over the last 30 years and scaling it up by the ratio of the assumed productivity performance to our actual. Fortunately the official GDP per capita series starts in 1991.
This is what the chart looks like.

By the end of the period, the annual difference – per man, woman, and child – is about $20000.
But what does it add up to? After all, every year since 1991 our incomes could have been higher than they were. And $1000 extra from 1991 invested even just at a real government bond rate adds to quite a lot by now (especially given New Zealand’s interest rates over that period). Applying a (stylised) series of real interest rates – falling over time – and applying them to each year’s difference in real GDP per capita, the total difference came – in today’s dollar terms – to a bit over $500000 per man, woman, and child. For almost everyone in New Zealand that would be serious money.
You could produce a different number with different scenarios. Slower convergence would, of course, produce a lower number. On the other hand, using the sort of discount rate The Treasury requires government agencies to use – rather than just a long-term real interest rate – would value past gains more highly and produce a materially bigger number.
The point also is not to suggest that if somehow economic policy had been run better and produced these stronger productivity outcomes that everyone would have banked all the proceeds and be sitting today on an extra nest-egg of $0.5 million. That wouldn’t have happened at all. In a more productive economy, people would have been able to – and no doubt would have- consumed more. Government revenues would have been stronger, and better public services might have followed even at the same tax rates. Some might have chosen to work less (a real gain to them too). The half million is a way of putting a number to the options that much better performance would have created. And the gains would be mounting further every single year. Another way of putting that is that every single year, the failure of successive governments means a median family of five is missing out on another $100000.
To repeat, this exercise is entirely stylised. Depending on one’s view of which set of policies might have delivered these better outcomes. some other things might have been very different. Perhaps our terms of trade would have been different (since probably a somewhat different mix of products). Perhaps our real interest rates would have been closer to world levels. Perhaps…perhaps. The point is simply that decades of economic failure adds up to really large amounts of income (and potential consumption) just lost. In New Zealand’s case, half a million per capita will do to be going on with, mounting at $20000 per capita with each year we languish so far behind the bunch.
And just think of how much better off our country would be – avoiding all the systematic and deeply unjust redistributions – if over the same period successive governments also had not so badly messed up the land market, in a way that has delivered us such extraordinary house prices.
What might have been……
But what still could be if there were to be a government of courage and vision.

A very good explanation. How much of the issue is about poorly focused government expenditure? What actions should the next government take to start an improving productivity performance?
LikeLiked by 1 person
On your specific question, “not very much” (and total govt spending as a share of GDP isn’t particularly high by OECD stds) even though they is plenty of questionable spending.
On where a next govt might usefully focus, I did a post with a list a few years ago. The list mostly still seems valid, with the immigration policy item at the top.
https://croakingcassandra.com/2018/05/25/lifting-productivity-what-id-do/
LikeLike
It’s absolutely heart-breaking that so many New Zealanders went through so much upheaval & pain for no result – in fact, we just went backwards, and not only in economic terms.
Two questions:
Why didn’t the reforms of the late 1980s/early 1990s (under the Labour & National Governments) work?
And, more importantly, what are the 3 or 4 specific actions that could be taken now to lift our GDP per capita?
Michael, I know you’ve probably answered both questions previously in various posts, but it would be great to have your summarised responses, as well as comments from other readers.
LikeLiked by 1 person
Here is a short post I did a few years ago outlining what I’d do.
https://croakingcassandra.com/2018/05/25/lifting-productivity-what-id-do/
On my analysis, the single most important change we need is a radical reorientation of our approach to immigration, recognising the limited opportunities that seem to exist for profitable business investment in this remote corner of the world.
More of my story, which also I think deals with your first question is here (a chapter of a recently published – but v expensive – book I contributed to)
Click to access an-underperforming-economy-the-insufficiently-recognised-implications-of-distance-longer-version-of-book-chapter.pdf
The Productivity Commission is currently undertaking a review of immigration policy, and is due to issue a draft report this month. It will be interesting to see if, and if so how, they engage with my analysis and arguments.
LikeLike
So every $10 would be $14. Assume $2 goes to the govt and we would have more hospital beds and nurses which are the biggest factor controlling NZ’s Covid-91 lockdowns. The other $2 would be spent by individuals and families. My wife prefers sirloin but we usually buy rump; that would change. Consider just the climate change factors that currently are just out of our family’s budget: wall insulation, solar panels, replacing. our elderly gas guzzling vehicle.
The more I think about it the more I realise that 40% increase in disposable wealth would improvs the lives of ordinary Kiwi families. Those earning $200,000pa would not be any happier with another $80,000 but changing our $75,000pa to $105,000pa would cheer up my family. The biggest beneficiaries would be our hard-working but low paid adult children with families; they would really appreciate having another $15,000pa because they would be able to afford a proper family holiday and they wouldn’t have to choose between paying for either sports or music lessons for the grandchildren.
LikeLiked by 3 people
Reblogged this on Utopia, you are standing in it!.
LikeLike
Thank you Michael, you’ve sorted my evening reading! The use of immigration to buy economic growth – or the appearance of it – has been utterly cynical.
And Bob, thank you for describing what we failed to achieve 30 years ago in real-life, real-world terms. That’s what’s so wrong, and it’s an abject failure shared by every NZ government since 1984 – caused, I think, by a widespread inability to create great policy and publicly argue the case for it, and a lack of the courage required to implement it. So much easier to go for the magic-wand-waving solution and cover up the cracks with very expensive, very clever spin.
The way I’m going, I’ll be voting in 2023 as I did in the first two elections I voted in, in 1978 & 1981 – crossing out every single option. And that really upsets me!
LikeLike
Not voting (party vote anyway) was my reluctant choice last year. First time ever, and at present the 2023 choice looks no better.
LikeLike
My rather cynical view would be that all the extra income would have gone into people buying more and more expensive housing and no-one would have been better off in aggregate excepting landlords, downsizers and people moving out of Auckland.
LikeLike
This analysis is backward looking. I’d agree that our forward looking prospects don’t look much better, at the moment, with the current government.
However, fundamentally, I reject this defeatism.
I’ve worked and lived most of my life in Switzerland and England..
In my experience, New Zealanders are not some kind of untermenschen, destined to fail overseas. To the contrary, New Zealanders can and do compete successfully against everyone else. We are not doomed as a country to perform worse economically than the former Soviet bloc countries. I feel no sense of inferiority against the people who are our trading partners.
Why should say Poland, or Slovakia, or indeed anyone, do better than us? I’m unconvinced that the distance handicap is as big as is being made out. Technology brings the world closer together.
NZ is doomed if we go down the socialist road (which is what we are doing at present), but this is a different scenario. At the next election, this could change.
My view is that NZ has incredible advantages (climate being one) that mean that we could be amongst the wealthiest countries in the world, with the correct policy settings.
We just need a government that sets up the incentive structures correctly, and New Zealand could thrive.
LikeLike
I don’t count myself as defeatist. There is a clear policy path out of this mess, it is just that there is no sign of ministers, officials or the political Opposition being willing to do what it would take. Failure – and we have failed badly – is a consequence of govt choices.
LikeLike