The two have nothing to do with each other, except that both were things I happened to see over the weekend.
First, motorways. Someone yesterday sent me a table of motorway length per capita by country. From it I generated this chart for the group of (loosely) advanced countries (EU members, OECD members, and Singapore and Taiwan) – plus I seem to have accidentally left Georgia on.
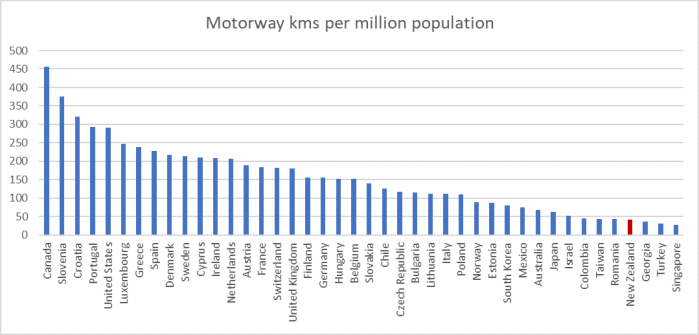
One always has to be careful with these sorts of cross-country comparisons. The data were taken from a Wikipedia page, but there are footnotes which appear to link to a range of national sources (and the NZ numbers coincide with the definition/number NZTA reports on its website). I found one other such listing, and while the precise numbers differ (sometimes probably because of different dates) the broad patterns looked similar. That said, I suspect one still needs to be cautious, including about what roads do and don’t get classed as “motorways”.
The person who sent the data to me is frustrated and believes that New Zealand has too few motorways. I don’t have a strong view on that. I’m not in any sense anti-car, I staunchly oppose government/Council efforts to coerce people to live more densely, and if I have the advantage of no longer commuting, the trip north out of Wellington or bits of state highway 1 in the central North Island are a reminder of some of the limitations of our roading network. On the other hand, there have been plenty of individual roading projects where the economic case has often been questionable/marginal, to say the very least. My correspondent argues that in part that reflects a tendency for New Zealand roading projects (expressways etc) to be over-specified, and perhaps there is something to that. But it isn’t obvious (perhaps I’ve missed them?) that there are lots of projects with really high benefit/cost ratios.
In some ways, the interesting thing about the chart was how diverse the experience was. Yes, even the Latin American OECD countries – who often seem included to help make New Zealand seem less bad – all have more motorways per capita than New Zealand, but richer Taiwan and much richer Singapore are both down our end of the chart (of course, Singapore strongly disincentivises private car ownerships, and is extremely dense). And if the US is towards the high end of the chart, so are fairly small, not very rich, places like Slovenia, Croatia, and Portugal.
At the far left of table, Canada is interesting. In a way it seems surprising: after all, Canada has extremely low population density. But then one remembers that most of Canada’s population (two-thirds) lives in the 4 per cent of Canada’s land within 100 kilometres of the US border.
I guess one would need a proper multi-variate analysis to really unpick the cross-country data, but if I was looking around for countries with some relevant similarities to New Zealand (modest population, low population density) perhaps Finland, Sweden and Norway might be relevant comparators. Of course, they are each richer/more productive than us – and at least in part motorway networks will be consumption goods rather investment ones. A little further up the population listings, but also with low population density are Australia and Chile. All five have, on these numbers, more motorways per million people than New Zealand does.
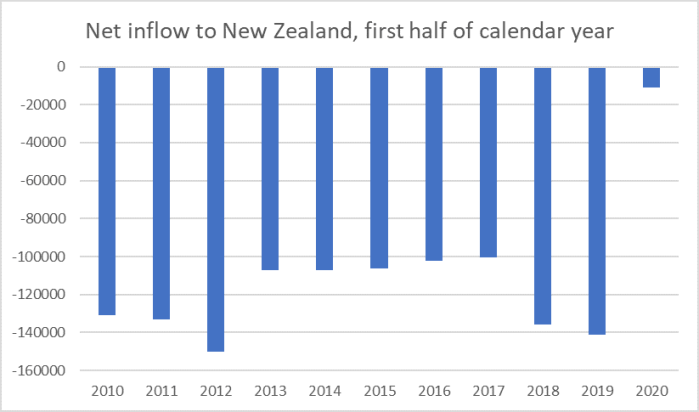
The other chart was prompted by this tweet from someone who appears to be a New Zealand diplomat.
Those looked like large net outflows from the last few months. A later tweet confirmed that Appleton was using daily Customs data on air passenger movements (which will be the overwhelming bulk of the net flow).
But my initial reaction was utterly and completely wrong. In this chart, I’ve used the SNZ monthly total arrivals and departures data, which are only available on Infoshare to April, and added the Customs data for the last two months (the two measures are pretty similar for the first four months of the year). This is how the net flow out of New Zealand has compared this year to each of the first half years for the last decade.
I was quite surprised, and am still a little puzzled. Up to the end of April, SNZ estimates of the numbers of visitors in New Zealand and of New Zealanders temporarily abroad suggested a significant reduction, compared to the same period last year, in foreign visitors here and only a small drop in the number of New Zealanders temporarily abroad.
But the unseasonally adjusted total data is what it is. In the first half of the year, we typically see a net outflow of 100000 people (foreigners and New Zealanders), and this year hardly much of a net outflow at all. Presumably for the last two months, for which we only seem to have the highly aggregated data, the picture is being more influenced by a drop in New Zealanders heading to warmer climes. But it was still a little surprising; we seem, on these numbers, to currently have 100000 more people in New Zealand – in many cases in their own homes – than might have been expected just six months ago.

True motorways are an “urban economic” phenomenon. They exist to get large volumes of traffic around an urban area, or between urban areas that have enough transport interaction to justify it.
NZ is often quoted, selectively, as having a very high mileage of “national road network” per capita but almost all of it is rural. Much of NZ is covered in a network of rural roads at relatively close spacing. The utilization rate of these roads is extremely low. If we consider the provision of transport infrastructure per person in the NZ rural economy to the NZ urban economy, it is no contest. The rural economy is “provided for” at a colossal rate, out of proportion to the aggregate income it generates.
Most nations work to some kind of logical framework for road capacity according to demand. 10,000 vehicles per day is time to add a couple of lanes of capacity to an existing one lane each way. 20,000 is time to add a couple more. 30,000 is time to add a couple more. Good planning would have designated the rights of way for this to be done without costly acquisitions and demolitions when required.
NZ is literally one of the world’s worst countries by this simple logic. We have numerous one-lane-each-way roads carrying close to 30,000 vehicles per day. We have roads that should be nothing more than the suburban “main street” substituting as high-volume arterials. Think Ngaio and Kelburn, for example. The projects we are doing to increase capacity are “catch-up”. We have virtually no designated rights of way in place anywhere in anticipation of future capacity provision.
It is one of the most barefaced lies in politics anywhere in the world, that NZ “has overinvested in roads” and the even worse corollary big lie, that this “induces so much traffic it makes congestion worse not better”. Goebbels and P T Barnum weren’t out of the nursery compared to the anti-car lobby in NZ. Plus Kiwis must be some of the world’s most apathetic and gullible people. GPS-based congestion delay data that has become available over the last few years shows that typical tinpot cities of 300,000-odd people can, do and should have traffic congestion delays of around 5 minutes per 1 hour of driving at peak time. Sir Bob Jones once said that we should regard most cities this size as “bigger versions of Havelock North” (not smaller versions of Hong Kong). Wellington could not be worse had it been planned as some kind of bad-taste joke against car drivers. Auckland is a little better but still a joke compared to normal cities like Indianapolis or Lyon.
“Geographic difficulties” I hear you say. Our ancestors just got on and built a Viaduct and a couple of tunnels to open up the rugged West of the city decades ago with far less capital resources. We also underestimate the geographic difficulties that have been overcome by virtually all cities, even the ones we perceive to have easier conditions than Wellington. Not all flat land is stable, there is streams, swamps, soft ground; and of course grade separation of conflicting traffic flows requires expensive building “up” to substitute for undulating terrain (which makes grade separation cheaper to do in combination with good planning).
We’ve kidded ourselves for too long that our low-income-job generating primary export sector enables us to foot it with real first world countries that do “added value”; we’ve imagined that we can blow public money at the same rate as, say Sweden, on some things, but cry poor when it comes to urban motorways. Urban motorways are a glaring example of something we’ve done without because of a low-value economy constraining our palette of fiscal options. Even the public transport that the anti-car lobby insists we throw money into at the same rate as high-value-economies in Western Europe, is something Western Europe has because they can afford it. We have this back to front. Urban highways are what we should attempt to “keep up with”, while admitting that the very nature of our national economy means that using Hong Kong and Manhattan – high density and public transport – as our models is a kind of Walter Mitty syndrome. We are actually the Appalachia of the South Pacific. And I bet they have far more motorway lane-miles per capita than we do.
LikeLiked by 1 person
THanks Phil
LikeLike
1) There is also the issue of total road network km per capita. NZ is long skinny country and is likely to have very high km / capita. This all requires maintenance $.
2) We dont have the traffic volumes to justify many more SH motorways. There is nice graph NZTA did looking at volume per lane & there are only 1 or 2 locations where motorways are currently justified and not currently provided.
3) The rural SH network is very poor on safety grounds. We need a lot more 2+1 lane roads & wire barriers like Sweden to stop killing people. 2 or 3 dead on rural SH’s in Canterbury over the last day.
4) Urban motorways are generally built to provide for peak traffic. Those using them should pay for them through congestion tolls.
LikeLike
we have the 11th highest total road kms per capita. i was interested that Finland, Sweden and Estonia top that table.
otherwise, generally agree.
LikeLike
Motorcyclists call the wire barriers “cheese cutters”…
LikeLike
What we need are high productivity roads. A quiet drive around Tauranga would soon show we have a couple and urgently need a couple more. Same in many places I suggest.
If the criteria were “High Productivity” then we would see a change in attitude and we wouldn’t bother statisticians and accountants with their mindless mind-bending gymnastics trying to figure out if a road would pay for itself.
Productivity is what matters. The rest will come.
LikeLike
Higher productivity equals more robots and fewer humans. Feeding the unemployed masses where wealth would be more and more centered on fewer people would be the problem. Not exactly the utopia that most of us are looking forward to.
LikeLike
Our secondary & rural roads actually make NZ money (being a rural based economy) & tend to be of a much higher standard than overseas equivalents (which often little more than slightly modernised cart track). It should be pointed out that the largest single road mileage user in the country is Fonterra, most of their milage isn’t highways.
Current roading policies are clearly flawed, a local example was roading safety improvements reduced 4 lanes to two added 2 to 5 minutes to a 20 minute commute and its safety improvement measure didn’t account for traffic that as a result took other roads of an even lower standard.
More motorways will never fix Auckland, its simple a low margin place to build a city.
It would be interesting to check the road maintenance cost of those countries, geology matters, even before accounted for NZ adopting a high cost model (low skill, high over heads, too many consultants).
So do road safety improvements actually make the roads safer, given overseas data suggest 1/3 of road fatalities in the USA are deliberate, no reason to expect that’s its that low here given other figures. We never see that sort of analysis for NZ crashes.
LikeLike