The two have nothing to do with each other, except that both were things I happened to see over the weekend.
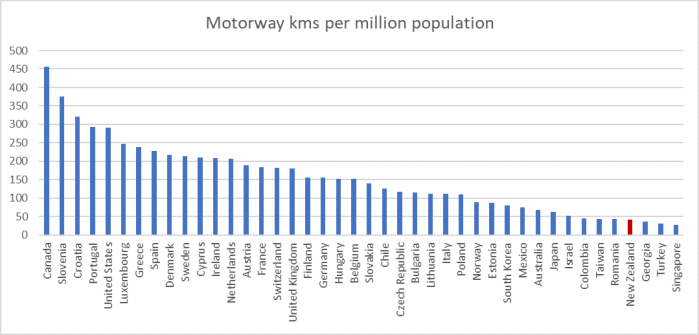
First, motorways. Someone yesterday sent me a table of motorway length per capita by country. From it I generated this chart for the group of (loosely) advanced countries (EU members, OECD members, and Singapore and Taiwan) – plus I seem to have accidentally left Georgia on.
One always has to be careful with these sorts of cross-country comparisons. The data were taken from a Wikipedia page, but there are footnotes which appear to link to a range of national sources (and the NZ numbers coincide with the definition/number NZTA reports on its website). I found one other such listing, and while the precise numbers differ (sometimes probably because of different dates) the broad patterns looked similar. That said, I suspect one still needs to be cautious, including about what roads do and don’t get classed as “motorways”.
The person who sent the data to me is frustrated and believes that New Zealand has too few motorways. I don’t have a strong view on that. I’m not in any sense anti-car, I staunchly oppose government/Council efforts to coerce people to live more densely, and if I have the advantage of no longer commuting, the trip north out of Wellington or bits of state highway 1 in the central North Island are a reminder of some of the limitations of our roading network. On the other hand, there have been plenty of individual roading projects where the economic case has often been questionable/marginal, to say the very least. My correspondent argues that in part that reflects a tendency for New Zealand roading projects (expressways etc) to be over-specified, and perhaps there is something to that. But it isn’t obvious (perhaps I’ve missed them?) that there are lots of projects with really high benefit/cost ratios.
In some ways, the interesting thing about the chart was how diverse the experience was. Yes, even the Latin American OECD countries – who often seem included to help make New Zealand seem less bad – all have more motorways per capita than New Zealand, but richer Taiwan and much richer Singapore are both down our end of the chart (of course, Singapore strongly disincentivises private car ownerships, and is extremely dense). And if the US is towards the high end of the chart, so are fairly small, not very rich, places like Slovenia, Croatia, and Portugal.
At the far left of table, Canada is interesting. In a way it seems surprising: after all, Canada has extremely low population density. But then one remembers that most of Canada’s population (two-thirds) lives in the 4 per cent of Canada’s land within 100 kilometres of the US border.
I guess one would need a proper multi-variate analysis to really unpick the cross-country data, but if I was looking around for countries with some relevant similarities to New Zealand (modest population, low population density) perhaps Finland, Sweden and Norway might be relevant comparators. Of course, they are each richer/more productive than us – and at least in part motorway networks will be consumption goods rather investment ones. A little further up the population listings, but also with low population density are Australia and Chile. All five have, on these numbers, more motorways per million people than New Zealand does.
The other chart was prompted by this tweet from someone who appears to be a New Zealand diplomat.
Those looked like large net outflows from the last few months. A later tweet confirmed that Appleton was using daily Customs data on air passenger movements (which will be the overwhelming bulk of the net flow).
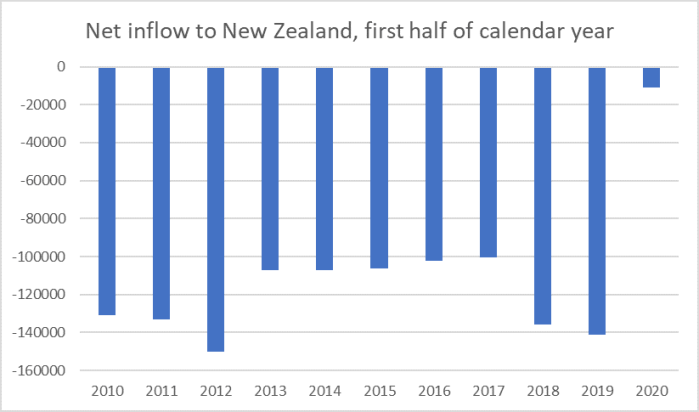
But my initial reaction was utterly and completely wrong. In this chart, I’ve used the SNZ monthly total arrivals and departures data, which are only available on Infoshare to April, and added the Customs data for the last two months (the two measures are pretty similar for the first four months of the year). This is how the net flow out of New Zealand has compared this year to each of the first half years for the last decade.
I was quite surprised, and am still a little puzzled. Up to the end of April, SNZ estimates of the numbers of visitors in New Zealand and of New Zealanders temporarily abroad suggested a significant reduction, compared to the same period last year, in foreign visitors here and only a small drop in the number of New Zealanders temporarily abroad.
But the unseasonally adjusted total data is what it is. In the first half of the year, we typically see a net outflow of 100000 people (foreigners and New Zealanders), and this year hardly much of a net outflow at all. Presumably for the last two months, for which we only seem to have the highly aggregated data, the picture is being more influenced by a drop in New Zealanders heading to warmer climes. But it was still a little surprising; we seem, on these numbers, to currently have 100000 more people in New Zealand – in many cases in their own homes – than might have been expected just six months ago.
