Continuing on with updating my regular charts in light of the national accounts revisions released last month, I got to the one distinguishing (indicatively) between real growth in the tradables and non-tradables sectors of the economy. Recall that for these purposes the primary sector (agriculture, forestry, fishing, and mining) and the manufacturing sector count as tradable, together with exports of services. The rest of GDP is classed, loosely, as non-tradables. As I’ve noted in an earlier post
The idea is to split out those sectors which face international competition from those that don’t. It is no more than an indicator, and people often like to point out the components of “non-tradables” where, at least in principle, there is international competition. But as a rough and ready indicator, it serves its purpose. It was first developed by a visiting IMF mission about 15 years ago to help illustrate how one might think about the impact of a lift in the real exchange rate.
Here is the latest version of the chart, with both series expressed in per capita terms.
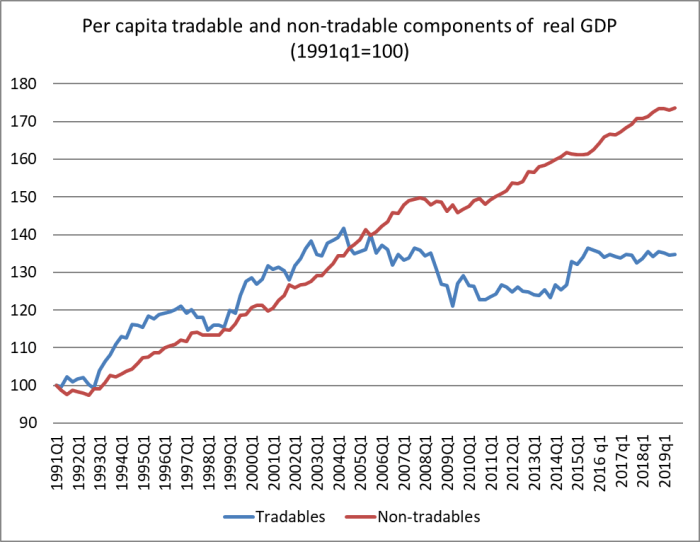
In per capita terms, there has been no growth at all in (this indicator of) the tradables sector since about 2002. That is 17 years now. The economy is increasingly concentrated in the non-tradables sector, the bits (generally) not very exposed to international competition.
One can – people do – quibble about adding up these components, so here is a chart of the individual components of the tradables sector measure. It starts from mid-2002, when the tradables aggregate first got to around the current level.
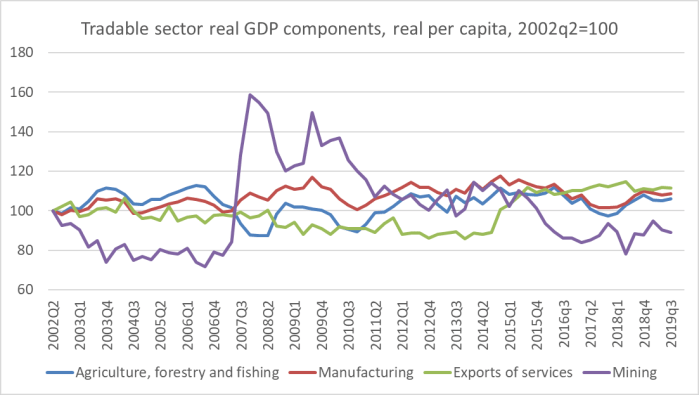
None of these sectors has done particularly well, The best performer – oft-cited hope of the future – services has averaged per capita growth of 0.6 per cent annum. The mining sector is smaller than it was, and agriculture, forestry and fishing (taken together) has managed no per capita growth since 2012.
Perhaps there is no connection at all between this performance and developments in the real exchange rate
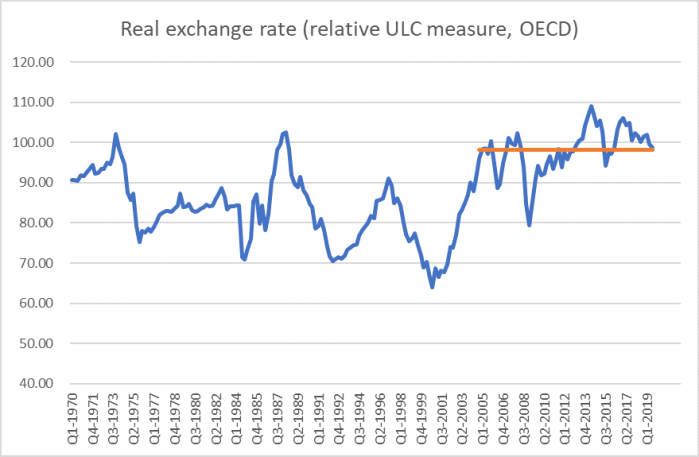
but I doubt many detached observers would think so.
It can get a little repetitive making the point, so this time I decided to put together – for the first time in some years – the comparable charts for Australia.
Here is the aggregate chart for Australia
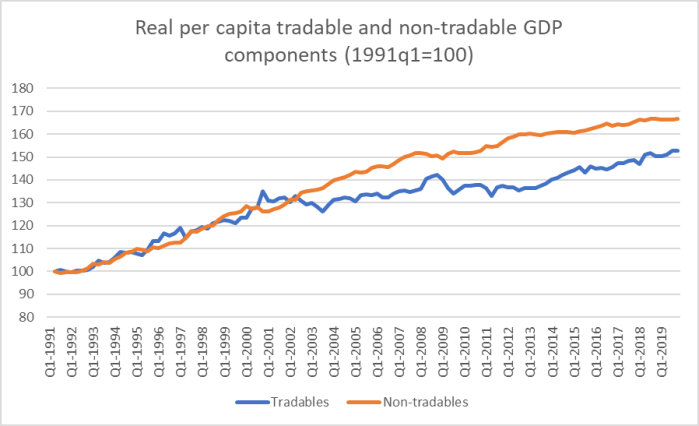
Australia’s tradables sector had also gone more or less sideways for a while, but no longer. Here is how the two countries’ tradables sectors look like on the same chart.
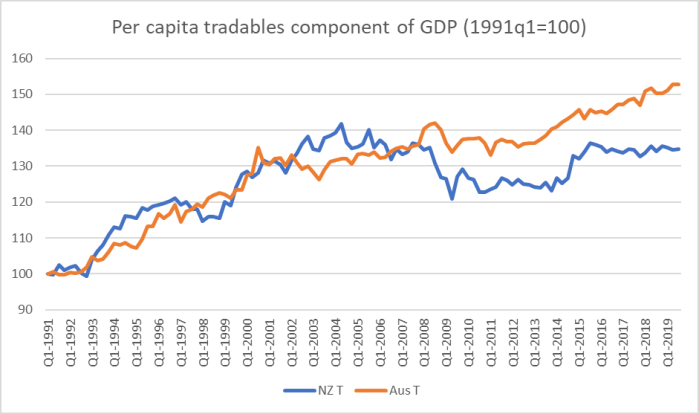
The 1990s were pretty good for the tradables sectors of both countries. And although Australia has again been performing better in the last few years, even that growth is slower than Australia experienced in the 1990s. As for New Zealand….well, no growth at all.
Here, for completeness, are the non-tradables sectors of the two countries.
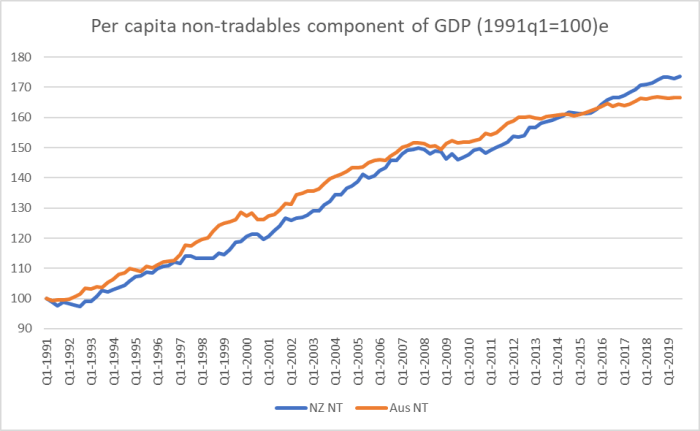
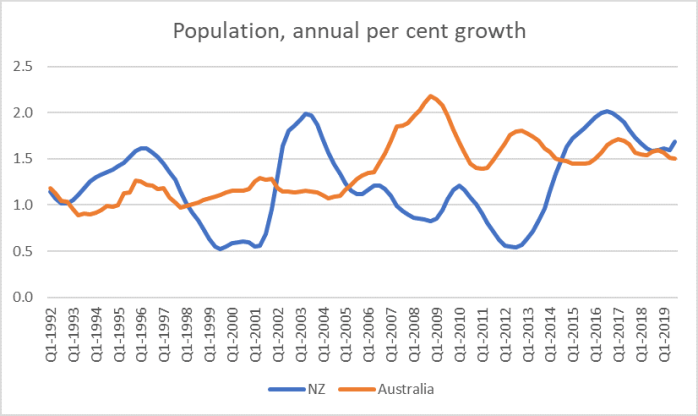
Our non-tradables sector has been growing a bit faster than Australia’s in recent years. That looks to be mostly because we’ve had a period of faster population growth – rapid population growth tends to require more resources devoted to non-tradables sectors (notably construction).
And what about the breakdown of Australia’s tradables sector?
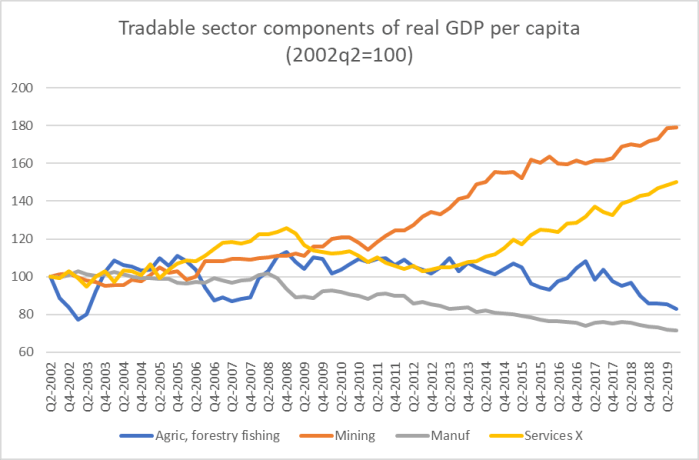
It is very different from the New Zealand picture in almost every respect. The mining line didn’t surprise me – it was the story I expected to be telling – but the others did, including the continued strong growth of services exports. Back in 2014 and 2015 it looked as though something similar was happening on both sides of the Tasman, but no longer: services exports here (per capita) have simply stagnated again.
New Zealand and Australia have both enjoyed pretty strong terms of trade in the last couple of decades (Australia’s more volatile than ours). But over the decades, New Zealand average productivity (real GDP per hour worked) has kept dropping further behind Australia’s – roughly 42 per cent ahead of us now, compared to about 25 per cent in 1970. And yet OECD data suggest our real exchange rate has risen relative to Australia’s over that half-century.

It isn’t that much of a rise – around 15 per cent – but the longer-term economic fundamentals pointed in the direction of a fall at least that large. Policymakers here have, unwittingly (although that isn’t much of an excuse after all this time) delivered a climate – a combination of factors – that mean it is very difficult for the tradables sector to grow much in New Zealand. Unless that changes it is difficult to envisage New Zealand not continuing to slip further behind, not just Australia but other advanced countries as well.
If the government were at all serious about responding to the productivity failings, these are sorts of imbalances they’d be instructing the Productivity Commission to investigate and make sense of.
