In my post yesterday on labour force participation rates I included this chart

There has been some increase in participation rates for those aged 70 and over, but the really striking movement has been in the 65-69 age group. More than half of men, and almost 40 per cent of women, in this first NZS recipient age group, are still in the labour force. (Interestingly, the gap between male and female participation rates for this age group hasn’t materially changed over the 30+ years of the chart.)
I went on to observe, relevant to NZS policy, that (emphasis added)
If you are able to work and are financially able not to, that is almost entirely a matter of individual/family choice, but you (generally) shouldn’t be eligible for long-term state income support. New Zealand’s experience suggests that the overwhelming bulk of those aged, say, 65-67 are well able to work (we don’t have the data, but presumably – given what happens from 70 on (see above) – participation rates of those 68 and 69 are materially lower than those for people 65-67). Against that backdrop, there is something just wrong about having a universal pension paid to them – well, me not that many years hence on current policy – simply on the basis of having got to that age.
My post caught the eye of someone at Statistics New Zealand who dug out the data by each year in the 65-69 age range, and sent me the following chart.
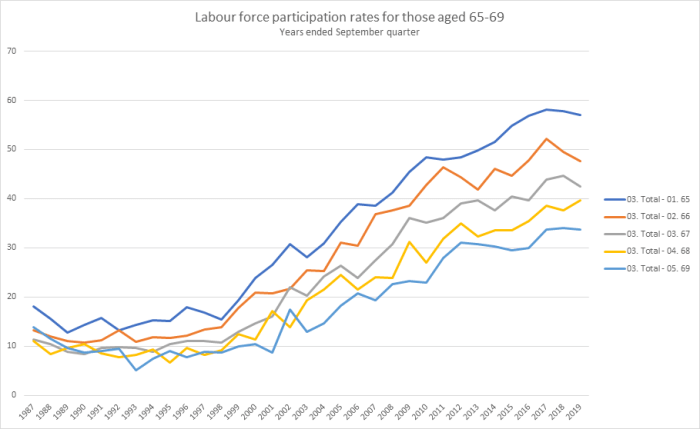
The standard errors on some of these estimates are quite large, so don’t pay much attention to the year to year changes in each series. But it was good to see a consistent monotonic pattern in which – beyond the NZS eligibility age – the older you are the less likely you are to be working.
Using the data she sent me, here are what the participation rates look like for men and women separately at ages 65 and 69 (also for September years).
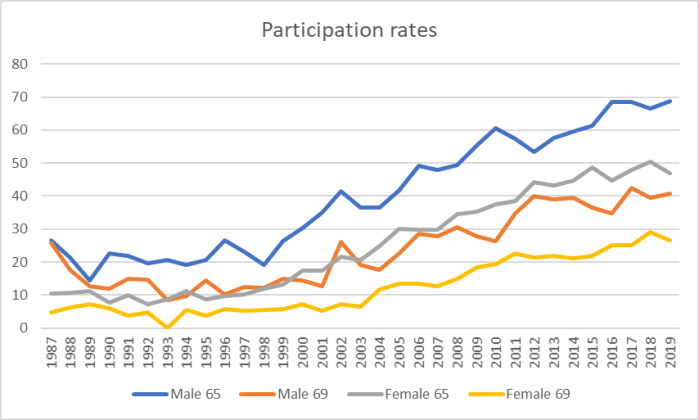
So almost 70 per cent of men aged 65 – almost all of whom will be recipients of NZS – were still working (or, in small numbers, actively seeking work). In some cases, of course, that work will be part-time only (being employed, in HLFS terms, means a minimum of an hour’s paid work in the reference week), but even a half-time minimum wage job would pay as much or more as a single rate of NZS.
As interesting perhaps is that even at 69 40 per cent of men were still active participants in the labour force. Since women have a longer life expectancy than men, presumably the materially lower female number is a reflection of past cultural practices and expectations – or perhaps even a stronger preference to spend time with grandchildren or in community activities – rather than physical incapacity.
I don’t often praise SNZ but today I offer only unmitigated kudos
(Well, perhaps mitigated only in this sense that if the annual data are readily available, and they are happy for people to use them – as they told me they were – why not make them routinely available on Infoshare?)

Interesting read thanks
LikeLike
Hello, I appreciate your articles. Something I would like to point out is that at a minimum wage you’d be getting work at the more physical level and in my experience older people aren’t able to keep that up eg labourers, cleaners etc if they’re doing their work properly. Perhaps pencil pushers in government jobs or other office type work? I can’t think of many other minimum wage government jobs. Presentism is really prevalent in many who are fighting tooth and nail to keep the jobs they’re in because they know how difficult it is to avoid subsistence living on the super. Perhaps the 1 hour or even the actively seeking work is skewing the graph. It would be interesting to see the data so that I can see geographic area and wage levels and hours worked, or if they’re looking. There is are 2 massive retirement “settlements” that I have dealings with and I would say that almost to a man (or woman) they would LOVE to be supplementing their super to help buy the little extras like a movie or more regularly spoil their grandkids. Ageism is alive and well for those who do manage to snag an interview. I’m looking forward to more of your articles and opinions, Kind regards, Thea Lloyd
On Tue, 12 Nov 2019 at 15:12, croaking cassandra wrote:
> Michael Reddell posted: “In my post yesterday on labour force > participation rates I included this chart There has been some increase in > participation rates for those aged 70 and over, but the really striking > movement has been in the 65-69 age group. More than half of men, and” >
LikeLike
Thanks. Interesting points. I suspect the data are probably getting to their limits (and any more is behind SNZ walls and I’d have to pay to get anyway). the number of, say, 65-67 year olds in, say, the Bay of Plenty will be very small in the sample survey so any answers will be pretty unreliable.
I suppose the other not-too-physical jobs that prob pay at/near the min wage will be retail. Having said that, I’m not suggesting most older wage are on the min wage, just pushing back against people who say that just people are employed doesn’t mean they are near fulltime. My point is that you don’t have to be to still earn more than the single NZS rate.
Ageism clearly is an issue in some types of roles, but nonetheless we still see a huge proportion of the young-old still in the workforce. (That said, I’m glad I’m not trying to apply for work even at 57).
LikeLike
I think there are 3 other very significant factors operating here.
One is the impact of the Finance Sector crash which impacted the aged especially.
Wikipedia says that “Between May 2006 and the end of 2012 there were sixty-seven finance company collapses in New Zealand; including companies entering into liquidation, receivership or moratoria”. Who invested in these companies? Retired people trying to supplement their NZS income were a very significant group. Suddenly they lost both their income – and their capital. So they went back to work – anything to help them recover.
The second factor impacting is the gradual then catastrophic reduction in bank deposit rates. The elderly again are the majority group so invested to eke out a slightly higher standard of living than offered by NZS. OK there are those who understand investing in real assets (other than property) and especially the share market, but that is a small percentage – made even smaller by the 1987 crash in which many were caught and burned and will never again invest in such risky assets.
Financial education and the lack of it has a significant impact on boomers – and the financial planning industry sure didnt help. Diversification was investing in 7 different finance companies! And then that reticence was compounded by the Dotcom crash around 2000.
The third is the trend to re-structure. A lot of cods-wallop in many cases. The change managers get rid of ‘middle management’ – those who can be replaced by younger people at half the cost. But who is it that knows the business and understands how it works? The mistakes the new staff make destroys the business. It takes time, but its basically inevitable.
I acknowledge that technology is changing things, but its often a case of how its done, rather than the risks of particular strategy.
I think you would find that most of those over 65 are in menial/retail low-paying, part-time jobs. That data would be really interesting.
And I certainly would suggest that anyone looking for a job when they are over even 50 is a miserable and degrading experience – unless you have specific skills, then the options are pretty limited and certainly not well paid.
LikeLiked by 1 person
Thanks for those interesting observations.
I guess my only caveats to that are to note that NZ had the largest increase in 65+ labour force participation since 2002 of any OECD country, and it isn’t obvious that we had the most dramatic wealth losses/disruptions etc during that period. On the finance companies, yes I recognise the phenomenon – my father was one of those people – but of course the losses were now 11-14 years ago, so the people who are now working at say 67 were only around 55 then. The people who were retired when the finance companies failed are now mostly either dead or getting beyond an age at which they could physically work.
LikeLike
The Finance Companies collapsed because the building industry collapsed. The building industry collapsed because the RBNZ got trigger happy with rapid interest rate rises and as a consequence engineered a severe NZ recession.
LikeLike
My idea of how superannuation should work is that it should be phased in. For example you get a quarter of it at age 60, half at age 65, three quarters at age 70, and the full amount at age 75. Ages given are suggested only and the “full” amount might be increased over the current existing amount.
The idea behind this is to encourage gradual reduction in work hours into retirement rather than a sudden shock. I imagine this is already happening quite often but such official encouragement as this could still be very helpful, especially with convincing larger employers.
LikeLike
A number of 65+ full time workers I know are asset rich(ie own the house) but cash poor.
The Super barely covers their living costs as they pay higher rates/insurances etc. As they age they need support. ie lawns mowed etc etc.
This is the reason that many of them give me for looking for jobs such as bus drivers, helpers in Bunnings, and airport security.
Its the extra cash they want to maintain a “decent”lifestyle.
Personally I like the Canadian ? system. Take your pension at 65 or delay it until 70 when you get more cash.
LikeLike
That 70% could also reflect the fact that we have a low wage economy?
LikeLike
This is the reality for some people
LikeLike
I wonder how that David Seymour euthanasia Bill is going to apply to a dementia patient who is not able to look after himself or make decisions? How do 2 doctors decide whether to end life to ease the burden to the state and to families? Slippery slope if the state decides to end life to save money.
LikeLike
He has just passed away.
LikeLike