The Reserve Bank Deputy Governor’s speech yesterday was released under the title Safer banks for greater wellbeing, while the handout at the venue went even further and was headed (in a very big font indeed) Safer banks = safer society. Count me sceptical.
It was a disaappointing speech. Plenty of people turned up to the university at lunchtime, including such eminent figures as the Governor and the former Deputy Governor (Grant Spencer), but we were treated to something not much more than the ECON101 case for huge increases in bank capital requirements. Geoff Bascand’s speeches have typically been the most thoughtful and considered of those given by Reserve Bank senior management. This latest effort didn’t reach that standard. Instead we had alarmist rhetoric about history, key charts deployed for support rather than illumination, and no attempt to dig deeper and use whatever that digging might throw up to shed light on the case the Bank is making (in a cause in which it is prosecutor, judge, and jury in its own case).
History first. As Bascand noted, New Zealand hasn’t had much history with systemic financial crises (although there is an interesting article here on the two episodes we have had). The first was in the 1890s, culminating in the bailout (and partial nationalisation) of the BNZ in 1894 (and the fiscal cost of that bailout (per cent of GDP) was a bit larger than in the more recent BNZ bailouts). Bascand really only notes this episode in passing but here is the chart of (estimated) GDP per capita during that period.
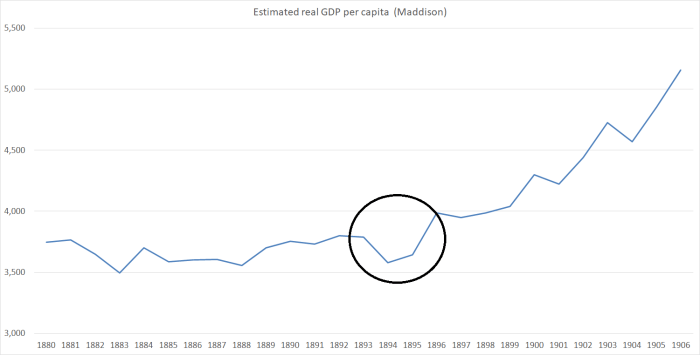
It was certainly a nasty recession – in an era when economies were more volatile than they are now – but it didn’t last long, and even if you attributed all the lost output to the financial crisis itself (and none to the misallocation of resources and bad lending that led to the banking problems) you only end up with total lost output of around 10 per cent of GDP. And that in a regime in which the exchange rate was fixed and New Zealand had no discretionary control of interest rates. (The 1890s crisis in Australia would have provided much stronger superficial support for Bascand’s argument, but with the same attribution issues.)
The more recent episode was involved two recapitalisations of the BNZ (and the failure of DFC, the travails of NZI Bank etc) in the late 1980s and early 1990s. Bascand notes that he lived through this period as a Treasury official and goes on to say
If you ask someone who’s lived through a banking crisis, they’ll likely tell you that the impacts were not only significant, but lasting. Perhaps the person you talk to may have lost their job as a result of the crisis, and if not, it might have been their spouse, a friend, or a neighbour. Maybe you speak to a young couple that had purchased their first home just prior to the crisis, only to see its value decline by 30% in the months following the crisis, forever altering their outlook on the economy and their willingness to make another significant investment. Or maybe you speak to someone who just graduated from university prior to the crisis, only to enter a depressed labour market, and forced to accept work well below their educational qualifications and abilities, forever altering their desired career path.
Talk to these people, and I think they will tell you that banking crises have altered their lives in ways they wished it hadn’t. I think they will also tell you that banking crises should not be accepted as an unavoidable fact of life.
For those that lived through the recession we experienced here in the early 1990s, you will recall that some industries were decimated, and a generation of workers lost. Many of these workers were not able to re-enter the workforce easily and lost valuable skills while trying to find suitable employment. And while recessions sometimes occur in the absence of a banking crisis, it is common for banking crises to ultimately result in recessions.
Actually, most recessions (not just “sometimes”) don’t involve banking crises, and it is asserting that which needs to be proved to suggest that banking crises “result in” recessions. Yes, banking crises often happen at the same time as recessions. Initial waves of bad lending, over-optimism, and misallocated lending often contribute to both the economic downturn and to the banking sector problems. Big increases in capital ratios from already high levels won’t change any of that. Quite possibly any disruptions to the intermediation process associated with banking failures (or near failures) exacerbate the economic downturn, or slow the subsequent recovery, but the Bank cites no studies (and I’ve not seen any) that attempt to separate out those effects. Implicit in a lot of this is handwaving around the poor global economic performance in the last decade, when countries that haven’t had financial crises have (on average) not performed much better than those that have.
And, of course, in the New Zealand in the early 1990s there was a great deal else going on. Although he doesn’t do so in the text, in his address Bascand did acknowledge that point, but simply acknowledging the point in passing – while talking at the same time of 11 per cent unemployment – isn’t really enough. We had the combined effect of:
- disinflation (getting inflation down from 10-15 per cent to something in the 0-2 per cent range),
- significant fiscal adjustment (recall the large deficits at the end of the Muldoon term),
- far-reaching structural reforms in the New Zealand public sector, including the new SOEs, that involved laying off lots of workers,
- significant reductions in trade protection,
- and the after-effects of an asset price and commercial property boom, with considerable misallocated resources (all of which had occurred fresh out of liberalisation, when neither borrowers nor lenders – let alone regulators – really knew what they were doing, what the relevant parameters and possibilities of the new market economy might have been. In the aftermath, whatever happened to the supply of credit, there wasn’t much demand for it either.
So I’m quite happy to believe that the banking crisis itself may have had some economic costs, but if the Bank wants to argue that they were more than a small fraction of overall costs of that period the onus is surely on them to produce the research in support. As it is, (and despite paying little attention at the time to potential financial intermediation channels) the Reserve Bank’s forecasters were surprised by the speed of the economic recovery from the 1991 recession. But I guess it is easier to simply fling round emotion-laden rhetoric about mental health etc.
And even narrowing things down to the BNZ problems, it is worth keeping that episode in perspective. The paper I linked to earlier records that the recapitalisation of the BNZ cost around 1 per cent of GDP. Better never to have had to do it, but that is pretty small by the standards of serious systemic banking crises (and, as I understand it, the direct outlay was fully recouped later). Perhaps relevantly to this debate, I was tempted to ask Bascand yesterday if he had any idea what risk-weighted capital ratio the BNZ would have had in the late 80s. Hard to estimate without someone doing some very detailed research, but I talked to someone else who was around at the time who estimates that at present (before the latest Reserve Bank proposals) the BNZ would be at least twice, possibly three times, better capitalised now than it was then. But of course you get none of this flavour from Bascand’s speech, or from any of the Reserve Bank documents published in recent months.
The Bank’s stress tests didn’t get a mention in the speech but a questioner asked about them. Bascand attempts to parry the question noting that they were “slightly artificial constructs” (sure, and so are any analytical techniques) but offered, without further prompting, that they certainly suggested “pretty resilient banks”. Nothing was offered in elaboration as to why, if severe stress tests show that banks not only don’t fail they don’t even fall below existing minimum capital ratios, regulators should be so insistent on such large further increases in the required capital ratios. I guess it is a bit awkward for them, and silence is easier than explanation? (Incidentally, the same questioner asked if much higher capital ratios would have some quid pro quo in lower supervisory intensity, but Bascand declared that not only would capital ratios be increased but that the Bank will increase its supervisory intensity.)
One of the areas the Bank has been pushed on is how their proposals compare to what is being done in other advanced countries, They’ve still given no satisfactory answers, not even something as (apparently) simple as an indication of the all-up expected capital ratios (core equity and total) APRA will expect for the Australian banking groups. An apparently knowledgeable commentator here has suggested that the total capital requirements are likely to be similar, but that the Reserve Bank is insisting on a much larger share of that being made up of (expensive) common equity. If true, that would be useful context for evaluating the Bank’s proposals. It is the sort of information they should have presented when the proposal was first released, more than two months ago now.
In the speech itself, Bascand included a couple of charts/tables intended to support his view. The first was this one (I’ve added the circling), included in the speech with no elaborating comment at all.
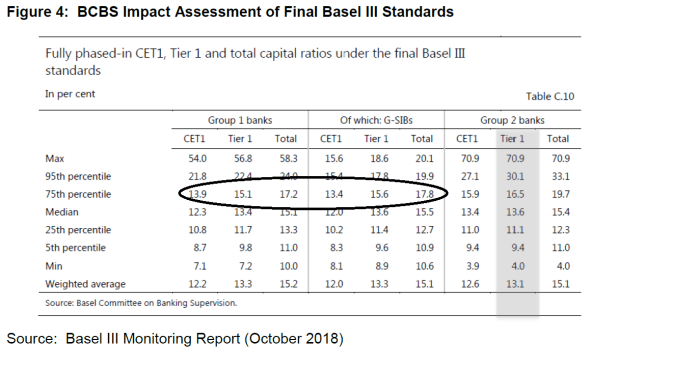
The table is taken from a 180 page paper, and is supposed to represent an estimate of where banks in other countries will get to when the Basle III standards are fully phased in. It isn’t clear – from the speech or from skimming through the 180 pages, although I presume there is a simple answer – whether these numbers are minimum required capital ratios or forecast actual capital ratios.
I’ve highlighted the numbers for the 75th percentile for the Group 1 banks (which includes the Australian parent banks) and the globally systemically significant (GSIB) subset of those. The Reserve Bank’s current proposals will require the four largest New Zealand banks to have minimum capital ratios of 16 per cent of risk-weighted assets. Actual capital ratios – and it is actual capital ratios that provide the buffer not minima – will be higher again. These are higher than the 75 percentile for the world’s biggest and most problematic (if anything goes wrong) banks. The G-SIB banks are typically complex, and cross multiple national boundaries, and there is no clear or robust idea how any potential failure will be resolved. On any sensible framework you would suppose that minimum capital requirements for such banks would be materially higher than those for vanilla retail banks operating in a single country, with large and strong parents. But not, it seems, to the Reserve Bank of New Zealand.
And, as it happens, this table doesn’t help us with one of the biggest differences between the way New Zealand capital ratios have been calculated and those in many European countries (in particular). The minimum risk weights here are generally accepted to be materially higher than those applied in many other advanced countries. Using the same sorts of risk weights used in many other countries, the capital ratios of our banks would appear quite a bit higher.
How much higher? Well, a couple of papers the Reserve Bank itself released (here and here) commenting on some PWC analysis shed light on that. Take the Australian situation first. PWC did some work there which concluded that Australian risk-weighted capital ratios were understated by 4 percentage points. APRA didn’t agree. They did their own study and concluded that the difference was “more like 3 percentage points”. That is stilll a big difference. PWC’s work on New Zealand concluded that the difference here was more like 6 percentage points. The Reserve Bank didn’t do its own study, but the internal note they did do concluded
….even after correcting for these biases, there may well continue to be a degree of reported conservatism, such that while we do not have much confidence in the 600 basis point figure they reach, we would accept the overall assessment that we are likely to be more conservative than many of our peers;
Since minimum risk-weights imposed by the Reserve Bank were typically higher than those imposed by APRA, it would seem unlikely that the difference here is less than the 3 percentage points APRA accepted in their study.
And much of this carries over to the new Reserve Bank capital proposals. Among its plans, the Bank is proposing to use a floor such that the big banks (using their internal models) cannot have capital ratios less than 90 per cent of what would be generated if the standardised approach (applying to other banks) were applied to their portfolios. That is one of the changes that looks broadly sensible to me. But apparently most other advanced countries are planning to use a floor of 72 per cent. All else equal, a 16 per cent capital ratio calculated on Reserve Bank rules could easily be equivalent to something like 19 per cent in many other countries’ systems. And not even the 95th percentile of G-SIB banks will – according to the BCBS table – have a Tier 1 capital ratio of 19 per cent.
I quite accept the Deputy Governor’s point that doing international comparisons well is hard. But the Reserve Bank has a lot more resources, including membership of international networks of regulatory agencies, than most people reacting to their proposals. And yet they’ve made little or no effort to engage in robust, open, benchmarking against what other countries are doing – not even Australia, when resolution of any problems in the big 4 banks will inevitably be a trans-Tasman affair.
The Deputy Governor then included another chart, with not much more comment

It certainly looks helpful to the Reserve Bank’s case, suggesting that current capital ratios (calculated this way) for big New Zealand banks are currently low by international standards and would still be not-high if the new proposals were applied (the Bank assumes quite a small margin of actual capital over minimum required – for reasons that have some plausibility).
But one needs to dig behind this chart and see what is going on. The rating agency S&P engages in its own attempt to calculate risk-weighted capital ratios for a large number of banks, using its own risk-weighting framework. But a great deal depends on the “economic country risk score” the S&P analysts assign. And they take a dim view of New Zealand, assigning us a score of 4 (on a 10 point scale). Here is what that means for housing risk weights

And there are similarly large differences for the corporate risk weights.
As I said, S&P gives New Zealand a 4. But Sweden, Norway, Belgium, Switzerland, and Canada all get a 2. You might think there are such large systematic economic risk differences between New Zealand and those countries, but I doubt the Bank really does, and I certainly doubt. I wrote about this a few years ago where I noted
The S&P model appears to put quite a lot of weight on New Zealand’s relatively high negative NIIP position. But I think they are largely wrong on that score too. First, the NIIP/GDP ratio has been fluctuating around a stable average for 25 years now. That is very different from the explosive run-up in international debt in countries such as Spain and Greece prior to 2008/09. But also the debt is largely taken on by the government (issuing New Zealand dollar bonds) and the banks. No one seriously questions the strength of the government’s balance sheet, or servicing capacity, even after years of deficits. And the ability of banks to borrow abroad largely depends on the quality of their assets and the size of their capital buffers. If asset quality really is much poorer than most have recognised, rollover risk could become a real problem, but it isn’t really an independent source of vulnerability.
Score us as a 3 or even a 2 and suddenly the Deputy Governor’s chart will have the implied capital ratios for New Zealand banks a lot higher.
There aren’t easy right or wrong answers to some of these issues, but the uncertainties just highlight how much better it would have been if the Reserve Bank had engaged in an open consultative process at a working technical level, before pinning their colours to the mast with ambitious far-reaching proposals. As another marker of what is wrong with the process, the Deputy Governor told us yesterday that the Bank will be releasing an Analytical Note on the Bank’s estimates of the costs of their proposals: it will, we were told, be out in a “couple of weeks”, by when two-thirds of the (extended) consultative period will have passed.
In the question time yesterday, the Deputy Governor was given the opportunity by a sympathetic questioner to articulate why the Bank should be conservative relative to many other overseas banking regulators. He didn’t offer much: there was a suggestion that New Zealand is particularly subject to shocks, and a claim that New Zealanders are strongly risk-averse (but not evidence, let alone that these preferences are stronger than those of people in other advanced countries). I can identify grounds on which some regulators might sensibly be more conservative than the median:
- if you were in a country with a bad track record of repeated financial crises. But that isn’t New Zealand,
- if you were in a country where much of credit was government-directed (directly or through government-owned banks). But that isn’t New Zealand.
- if you were in a country that depended heavily on foreign trade and yet had a fixed nominal exchange rate. But that isn’t New Zealand.
- or no monetary policy capability of its own. But that isn’t New Zealand.
- or if you were in a country where the public finances were sick. But that isn’t New Zealand,
- or if you were in a country where the big banks were very complex and you weren’t confident you understood the instruments. But that isn’t New Zealand.
- or if you were in a country where the big banks had no cornerstone shareholder, were mutuals, or where the cornerstone shareholder was from a shonky regime. But that isn’t New Zealand.
The case just doesn’t stack up.
And, as I noted yesterday, using the numbers the Deputy Governor himself cited, a simple cost-benefit assessment doesn’t seem to stack up either. We are asked to give up quite a lot of income (PV of $15 billion on his numbers) for some wispy highly uncertain probability of easing a recession in perhaps 75 years time.
If there is a robust case for what they want to do, it just hasn’t yet been made.

why is credit guidance dismissed as socialism? Japan used it successfully until they adopted fed policy in 1989. Anyway it only works in homogeneous societies. Looks like another bust coming and I’ll lose my job great.
LikeLike
Thank you Michael for a very interesting analysis of the Geoff Bascand Speech.
Do you have any insights on what the proposed capital increases for banks may have for Monetary Policy? Leading in to the GFC, NZ had an OCR around 8.5% – although Inflation was higher than now and RBNZ were attempting to bring it down – while now the OCR is at 1.75%. RBNZ have said that they expect to use the OCR to compensate for the effects of the capital proposal.
I guess one question is,
what should the OCR be when RBNZ is not trying to temper inflation, or increase economic activity?
The next question is, how much room do they need, to be able to react to a shock?
LikeLike
Some relevant discussion here https://croakingcassandra.com/2019/02/08/raising-bank-capital-requirements/ I doubt the OCR effect will be that large, but all else equal perhaps it could be 30-50bps especially in the transition. Depends a bit how aggressively the banks choose to respond (either by trying to maintain target ROEs or pulling back lending). Bear in mind that, all, else equal, a lower OCR will probably also lead to a lower TWI.
I am very uneasy about the next serious recession. Of course the problems are less serious here than in most countries, but when – as you note – the starting point is 1.75% and the lower limit is probably 0.75% there is limited scope to do very much. In a normal NZ recession they’ve need twice that scope – which they could get by doing something active about the lower bound but (like peers overseas) they refuse, claiming (eg) QE will do us just fine.
As for a neutral OCR, one can really only back it out from results. The output gap, on RB estimates has been near zero for a couple of years now. Market implied expectations have been below target, but it still suggests it is hard to get to a neutral OCR much above 2% these days. I’m not championing the number, just arguing back from experience.
LikeLike
Mortgage rates are set to rise, although not having a mortgage I couldn’t care less; as a fixed income investor sick of being thrown under the speculators bus over last decade, what is the likely outcome for deposit rates from the banks? I’m assuming I now get thrown under the bus of the banks margin?
I’m used, now, as a fixed income investor, to basically being shat on from everything that comes out of monetary policy (which is quite a feat).
LikeLiked by 1 person
Mortgage rates have more downside than upside at the moment. The global economy has more downside risk and the NZ economy has also reached peak everything so more downside risk as well.
LikeLike
Lending margins will rise, but how that is split between higher lending rates and low deposit rates isn’t clear, and will depend in part on the extent of any consequential OCR adjustment.
LikeLike
Well I’ll just work on the recent history of monetary policy: I (and all elderly fixed income investors) are set to be screwed again.
Come the The Great Reset soon, these banks better be safe, because there is pretty much no other reason to give them my money (at relatively huge risk which is not anything like compensated for by the rates offered).
LikeLike
Even if you are invested in Kiwisaver you would still have savings deposits with the banks especially with default conservative Kiwisaver and balanced kiwisaver can have as much as 40% of their funds in fixed deposits savings with banks.
LikeLike